| Param | Original file | Final file |
|---|---|---|
| Filename | modeM0/AS1P01_010T01_9000000112_00809cztM0_level2.evt | modeM0/AS1P01_010T01_9000000112_00809cztM0_level2_quad_clean.evt |
| Size (bytes) | 851,031,360 | 88,896,960 |
| Size | 811.6 MB | 84.8 MB |
| Events in quadrant A | 6,364,543 | 589,376 |
| Events in quadrant B | 6,731,588 | 593,354 |
| Events in quadrant C | 6,199,399 | 567,599 |
| Events in quadrant D | 6,106,459 | 551,237 |
| Mode M9 | |||
|---|---|---|---|
| Quadrant | BADHDUFLAG | Total packets | Discarded packets |
| A | 0 | 12 | 0 |
| B | 0 | 12 | 0 |
| C | 0 | 12 | 0 |
| D | 0 | 12 | 0 |
| Mode M0 | |||
|---|---|---|---|
| Quadrant | BADHDUFLAG | Total packets | Discarded packets |
| A | 0 | 22903 | 0 |
| B | 0 | 23951 | 0 |
| C | 0 | 22415 | 0 |
| D | 0 | 22133 | 0 |
| Mode SS | |||
|---|---|---|---|
| Quadrant | BADHDUFLAG | Total packets | Discarded packets |
| A | 0 | 114 | 0 |
| B | 0 | 114 | 0 |
| C | 0 | 114 | 0 |
| D | 0 | 114 | 0 |
| Quadrant | Total seconds | Saturated seconds | Saturation percentage |
|---|---|---|---|
| A | 5583 | 8 | 0.143292% |
| B | 5582 | 14 | 0.250806% |
| C | 5582 | 8 | 0.143318% |
| D | 5582 | 58 | 1.039054% |
Noise dominated data is calculated using 1-second bins in cleaned event files. If a bin has >2000 counts, and if more than 50% of those come from <1% of pixels, then it is considered to be noise-dominated and hence unusable.
| Quadrant | # 1 sec bins | Bins with >0 counts | Bins with >2000 counts | High rate bins dominated by noise | Noise dominated (total time) | Noise dominated (detector-on time) | Marked lightcurve |
|---|---|---|---|---|---|---|---|
| A | 6838 | 5584 | 140 | 140 | 2.05% | 2.51% | 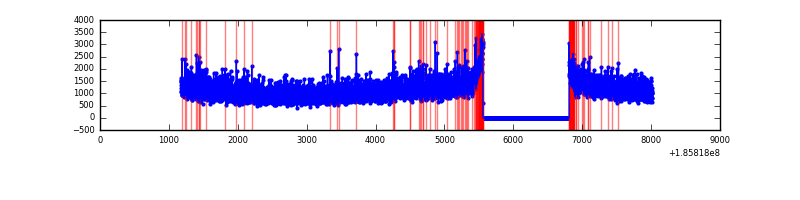 |
| B | 6837 | 5583 | 166 | 166 | 2.43% | 2.97% | 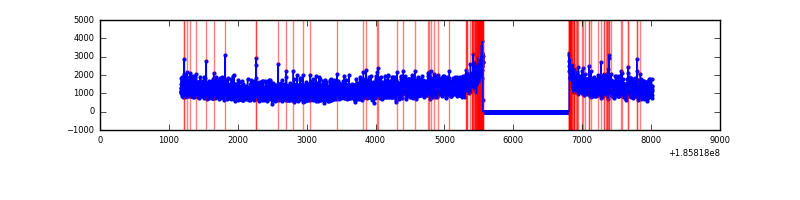 |
| C | 6837 | 5583 | 124 | 124 | 1.81% | 2.22% | 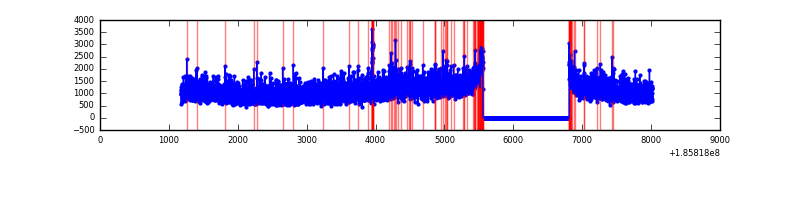 |
| D | 6837 | 5583 | 184 | 184 | 2.69% | 3.30% | 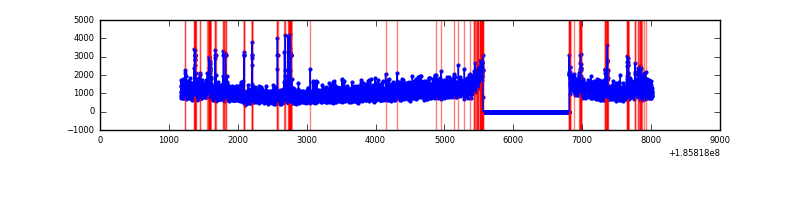 |
Top three noisy pixels from each quadrant. If the there are fewer than three noisy pixels in the level2.evt file, extra rows are filled as -1
| Pixel properties | Quadrant properties | ||||||
|---|---|---|---|---|---|---|---|
| Quadrant | DetID | PixID | Counts | Sigma | Mean | Median | Sigma |
| A | 0 | 214 | 15167 | 33.95 | 1652 | 1662 | 397.8 |
| A | 15 | 233 | 9520 | 19.75 | 1652 | 1662 | 397.8 |
| A | 11 | 79 | 6526 | 12.23 | 1652 | 1662 | 397.8 |
| B | 0 | 23 | 32242 | 75.22 | 1744 | 1750 | 405.4 |
| B | 0 | 220 | 19114 | 42.83 | 1744 | 1750 | 405.4 |
| B | 4 | 185 | 15283 | 33.38 | 1744 | 1750 | 405.4 |
| C | 15 | 241 | 30617 | 67.43 | 1553 | 1605 | 430.3 |
| C | 9 | 52 | 27701 | 60.65 | 1553 | 1605 | 430.3 |
| C | 3 | 111 | 26193 | 57.15 | 1553 | 1605 | 430.3 |
| D | 13 | 58 | 224245 | 486.22 | 1483 | 1536 | 458.0 |
| D | 13 | 25 | 155337 | 335.78 | 1483 | 1536 | 458.0 |
| D | 13 | 170 | 52281 | 110.79 | 1483 | 1536 | 458.0 |
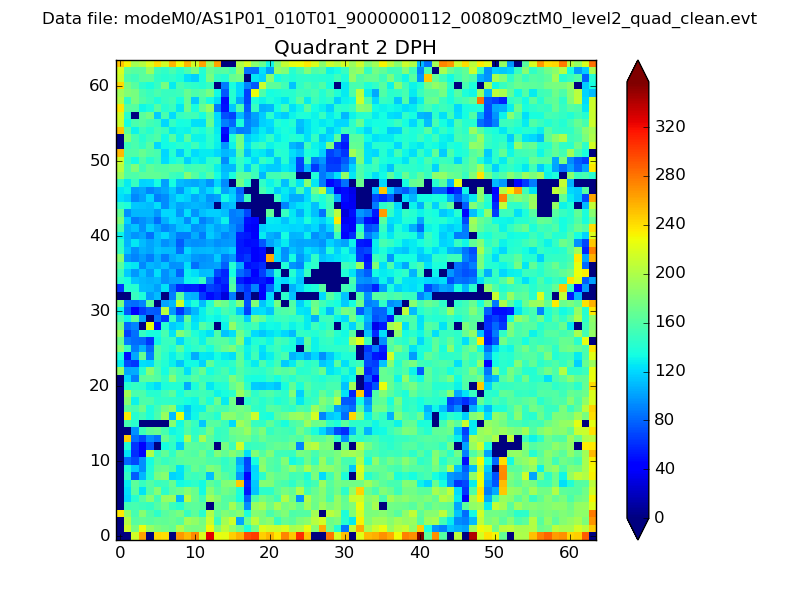
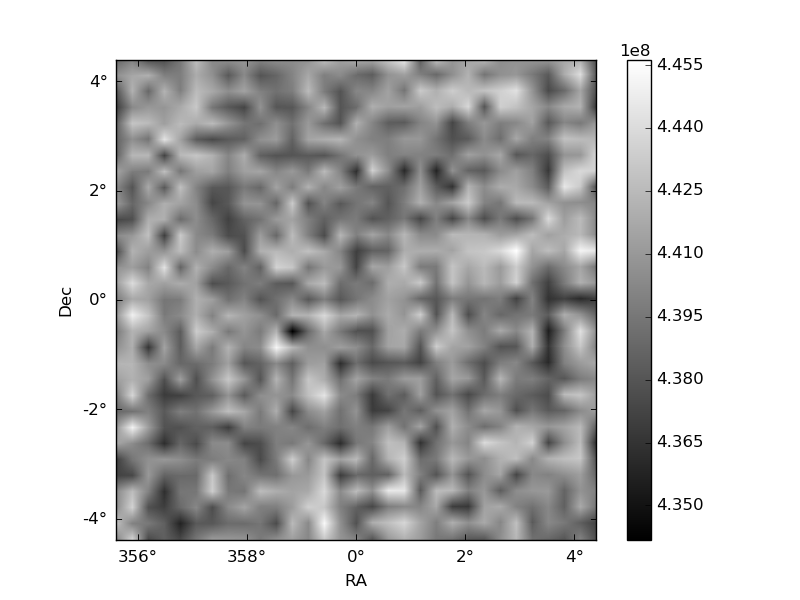
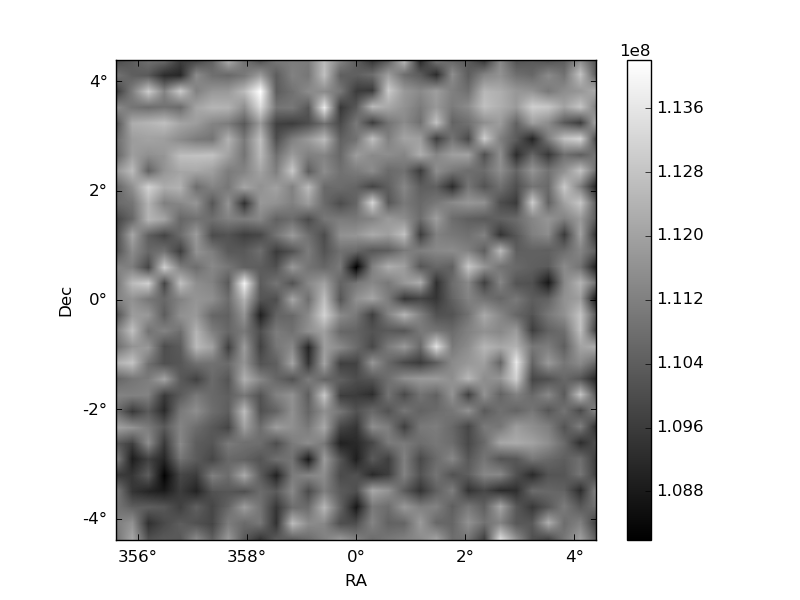
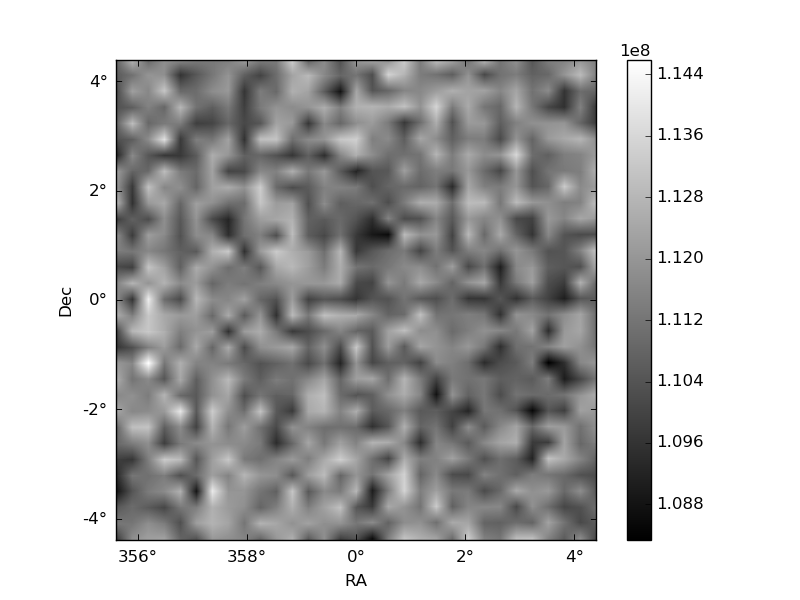
Histogram calculated using DETX and DETY for each event in the final _common_clean file
| Quadrant A | 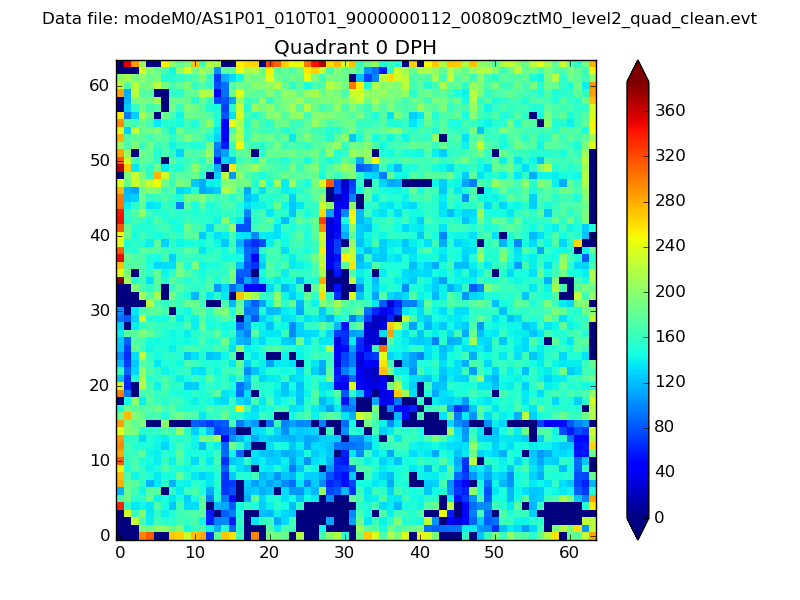 |
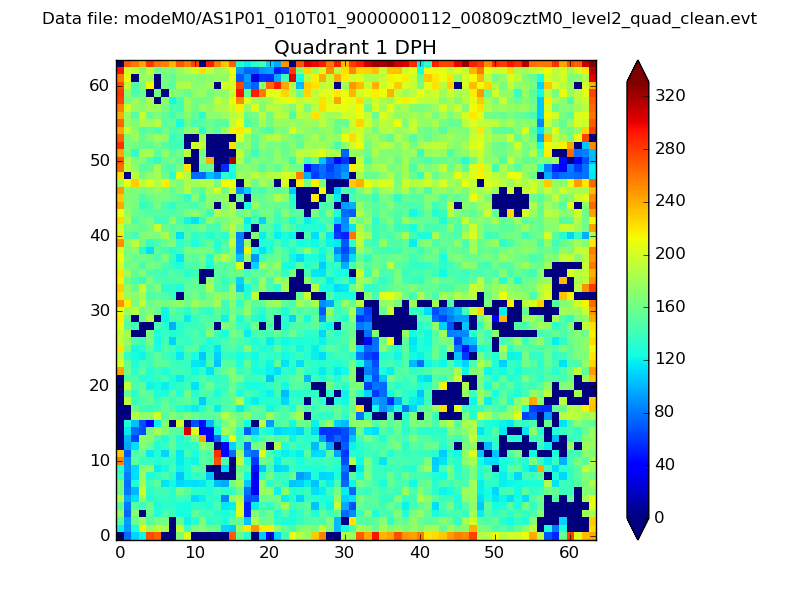 |
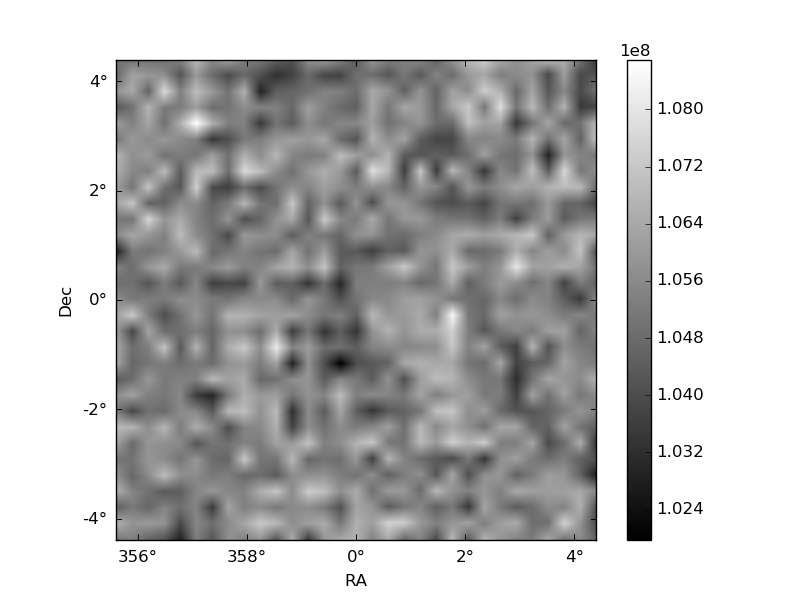
Quadrant B |
|---|---|---|---|
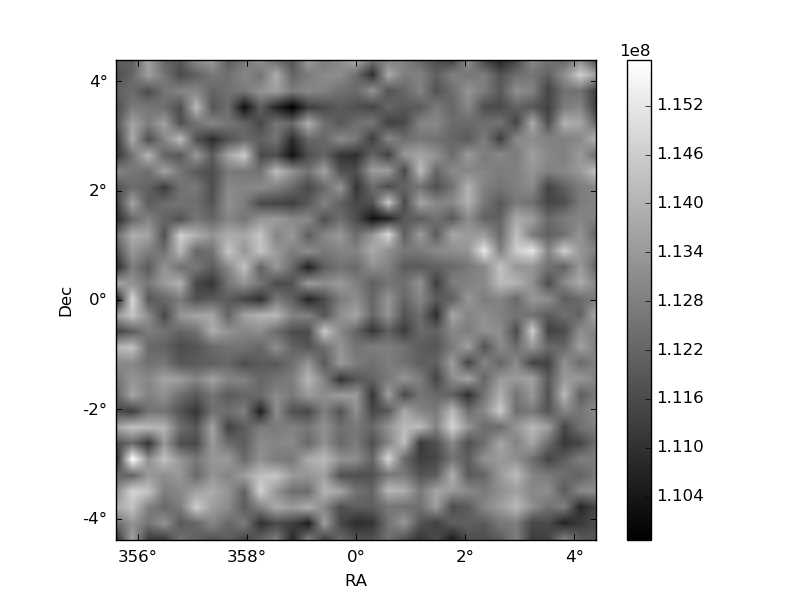
| Quadrant D | 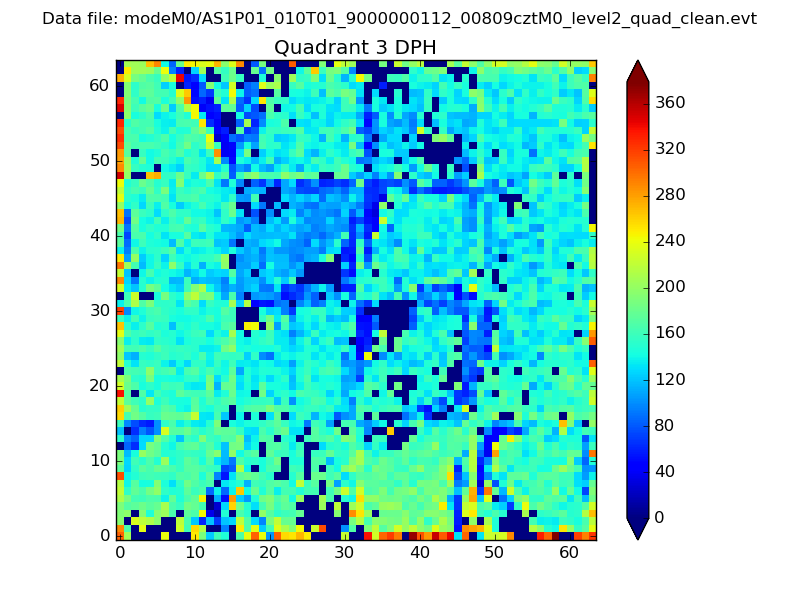 |
 |
Quadrant C |
| Plot type | Count rate plots | Images |
|---|---|---|
| Comparison with Poisson distribution Blue bars denote a histogram of data divided into 1 sec bins. Red curve is a Poisson curve with rate = median count rate of data. |
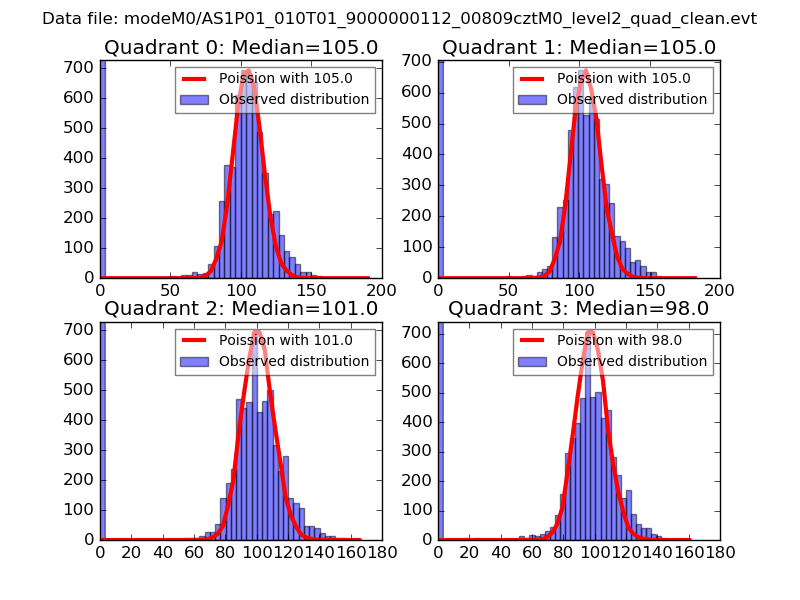 |
 |
| Quadrant-wise count rates Data is divided into 100 sec bins |
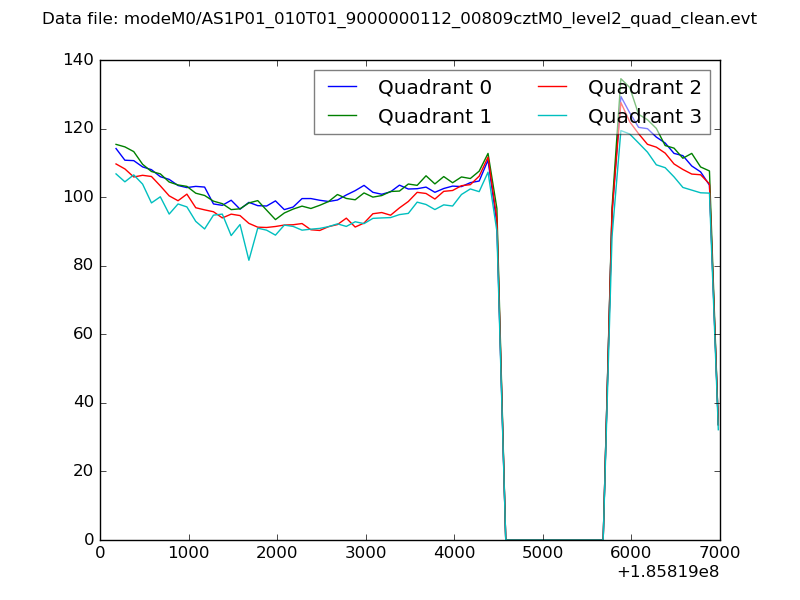 |
|
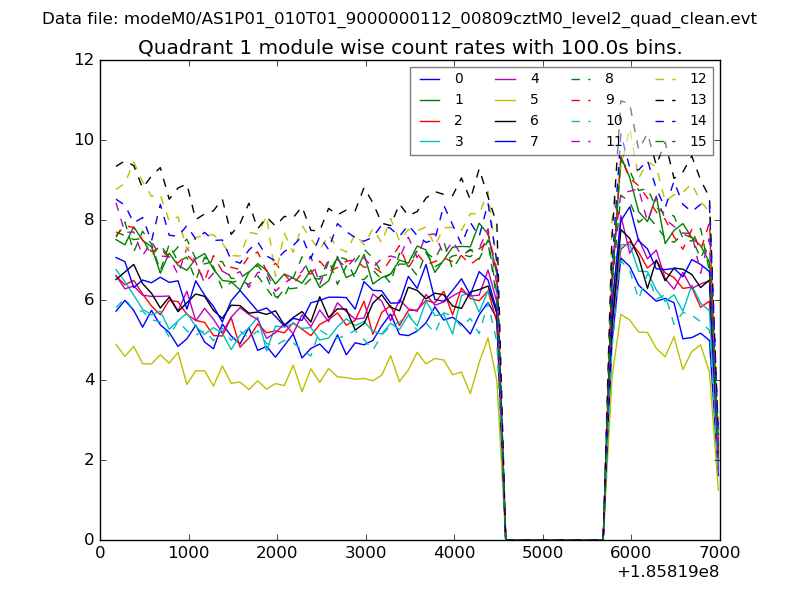
| Module-wise count rates for Quadrant A Data is divided into 100 sec bins |
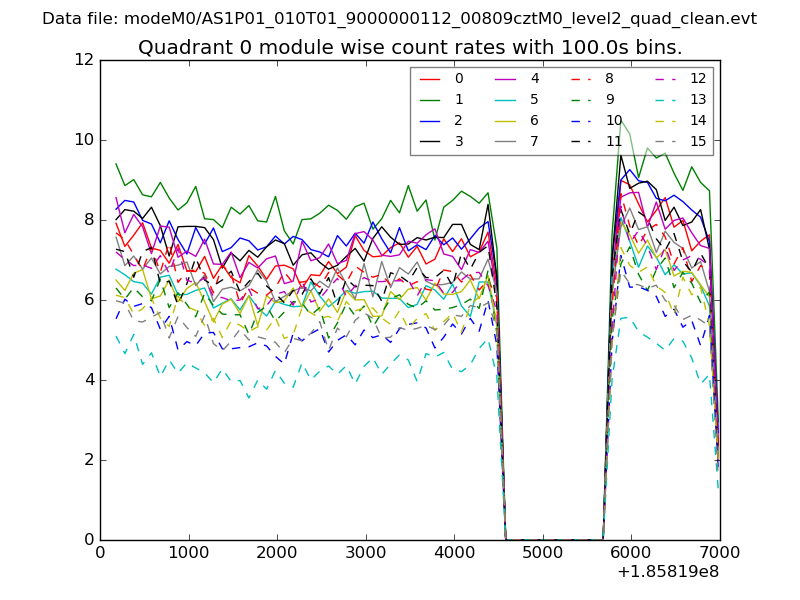 |
 |
| Module-wise count rates for Quadrant B Data is divided into 100 sec bins |
 |
 |
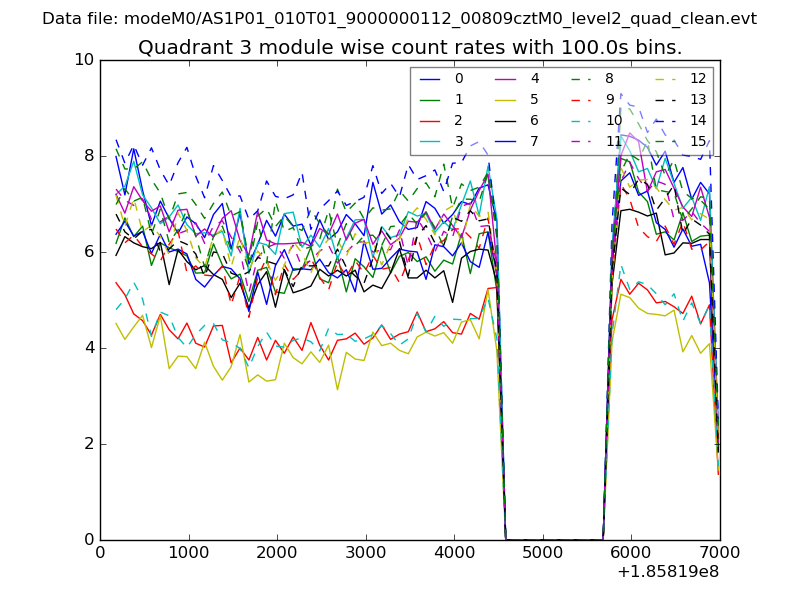
| Module-wise count rates for Quadrant C Data is divided into 100 sec bins |
 |
 |
| Module-wise count rates for Quadrant D Data is divided into 100 sec bins |
 |
 |
| Parameter | Plot |
|---|---|
| CZT HV Monitor |  |
| D_VDD | 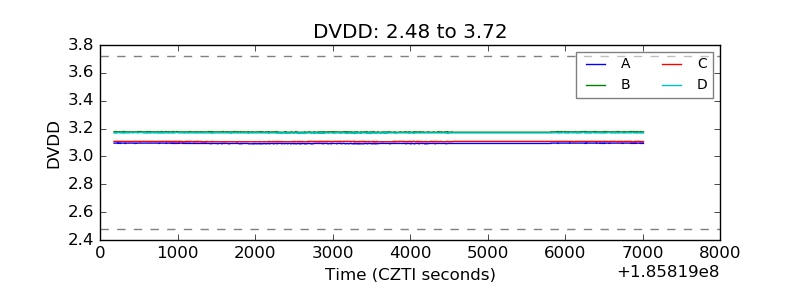 |
| Temperature 1 | 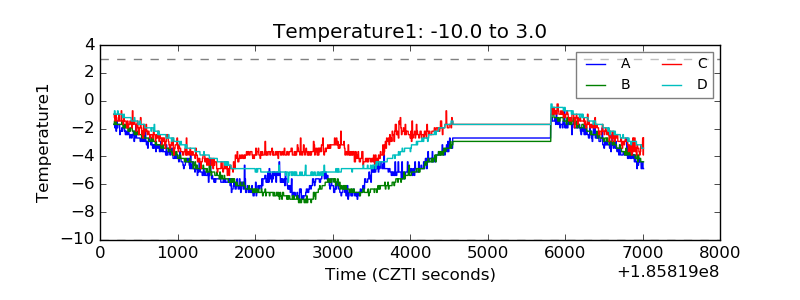 |
| Veto HV Monitor | 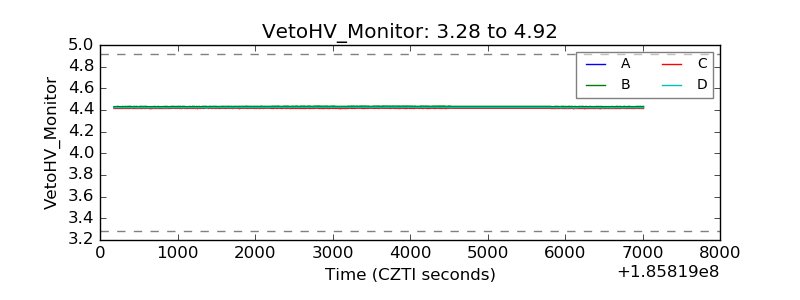 |
| Veto LLD | 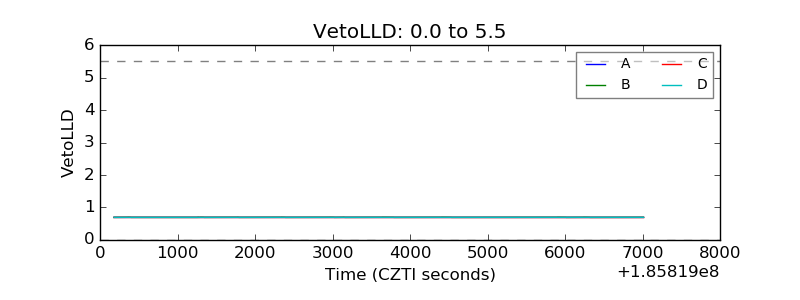 |
| Alpha Counter | 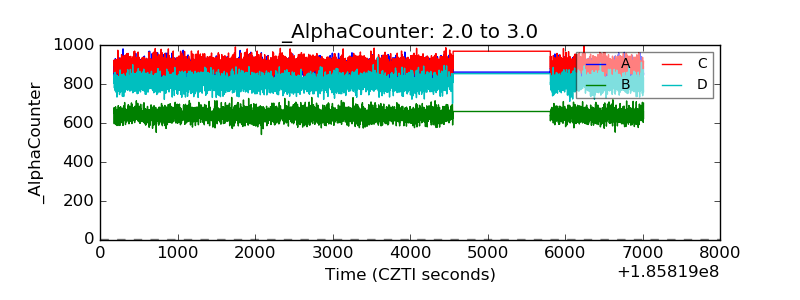 |
| _CPM_Rate | 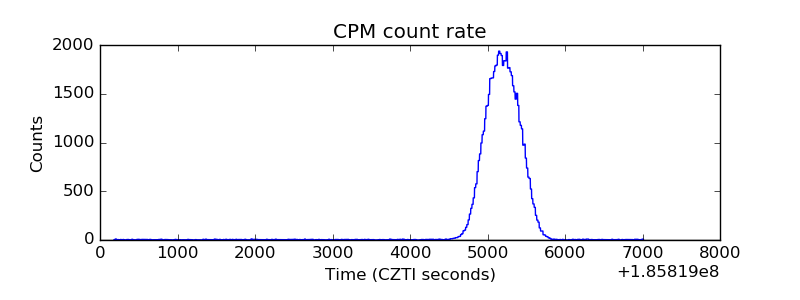 |
| CZT Counter | 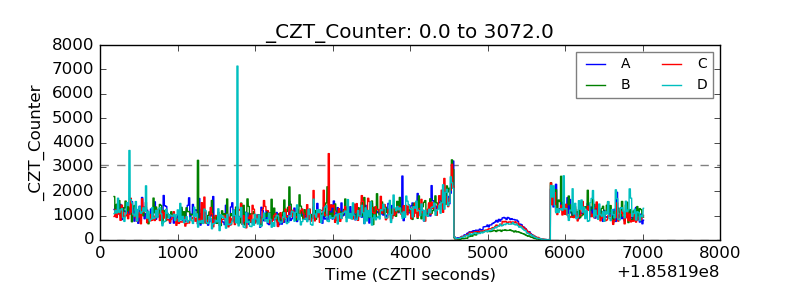 |
| +2.5 Volts monitor |  |
| +5 Volts monitor |  |
| _ROLL_ROT | 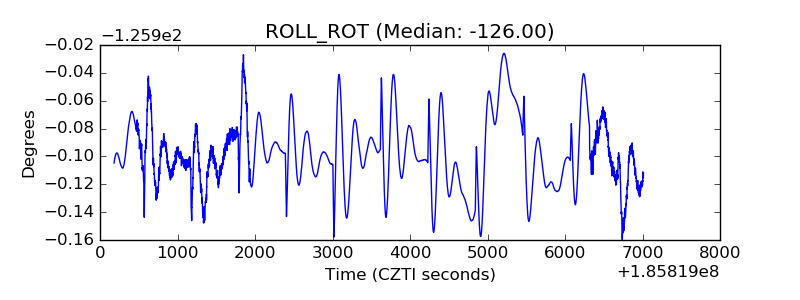 |
| _Roll_DEC | 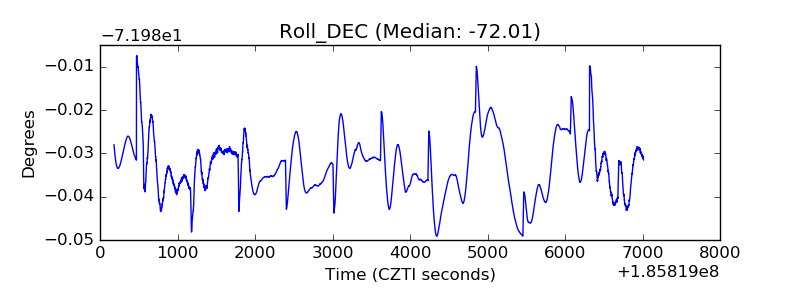 |
| _Roll_RA | 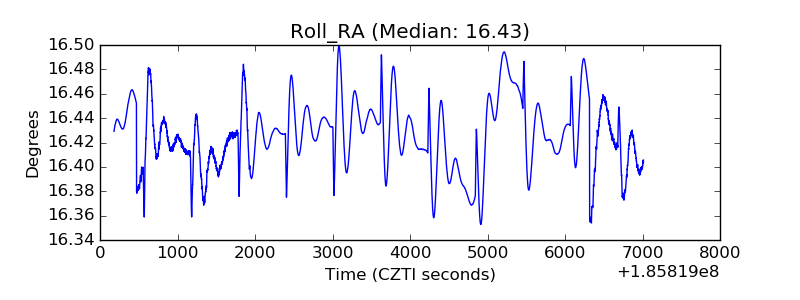 |
| Veto Counter | 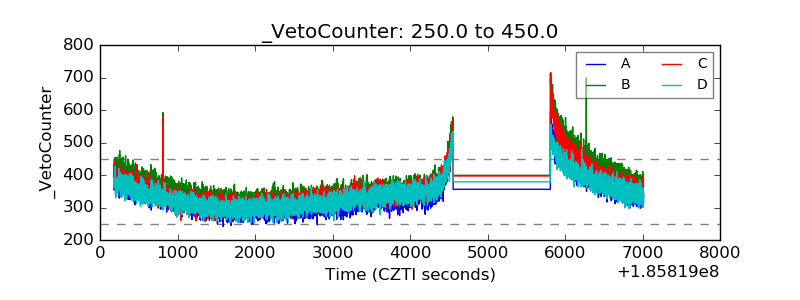 |