| Param | Original file | Final file |
|---|---|---|
| Filename | modeM0/AS1P01_010T01_9000000112_00814cztM0_level2.evt | modeM0/AS1P01_010T01_9000000112_00814cztM0_level2_quad_clean.evt |
| Size (bytes) | 1,252,238,400 | 114,814,080 |
| Size | 1.2 GB | 109.5 MB |
| Events in quadrant A | 9,268,291 | 746,089 |
| Events in quadrant B | 9,839,451 | 751,833 |
| Events in quadrant C | 9,253,605 | 726,750 |
| Events in quadrant D | 9,046,873 | 710,919 |
| Mode M9 | |||
|---|---|---|---|
| Quadrant | BADHDUFLAG | Total packets | Discarded packets |
| A | 0 | 1 | 0 |
| B | 0 | 1 | 0 |
| C | 0 | 1 | 0 |
| D | 0 | 1 | 0 |
| Mode M0 | |||
|---|---|---|---|
| Quadrant | BADHDUFLAG | Total packets | Discarded packets |
| A | 0 | 33109 | 0 |
| B | 0 | 34723 | 0 |
| C | 0 | 33048 | 0 |
| D | 0 | 32409 | 0 |
| Mode SS | |||
|---|---|---|---|
| Quadrant | BADHDUFLAG | Total packets | Discarded packets |
| A | 0 | 156 | 0 |
| B | 0 | 156 | 0 |
| C | 0 | 156 | 0 |
| D | 0 | 156 | 0 |
| Quadrant | Total seconds | Saturated seconds | Saturation percentage |
|---|---|---|---|
| A | 7799 | 31 | 0.397487% |
| B | 7798 | 44 | 0.564247% |
| C | 7799 | 64 | 0.820618% |
| D | 7799 | 65 | 0.833440% |
Noise dominated data is calculated using 1-second bins in cleaned event files. If a bin has >2000 counts, and if more than 50% of those come from <1% of pixels, then it is considered to be noise-dominated and hence unusable.
| Quadrant | # 1 sec bins | Bins with >0 counts | Bins with >2000 counts | High rate bins dominated by noise | Noise dominated (total time) | Noise dominated (detector-on time) | Marked lightcurve |
|---|---|---|---|---|---|---|---|
| A | 7849 | 7800 | 378 | 378 | 4.82% | 4.85% | 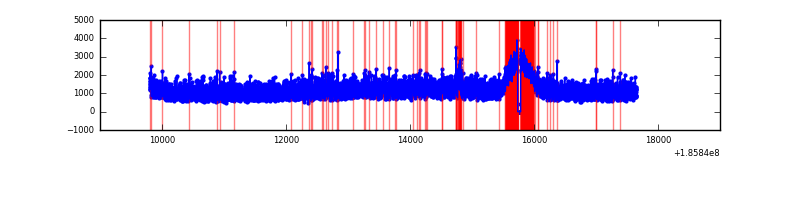 |
| B | 7848 | 7799 | 474 | 474 | 6.04% | 6.08% | 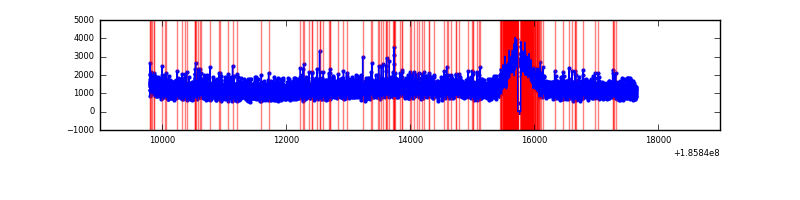 |
| C | 7849 | 7800 | 386 | 386 | 4.92% | 4.95% | 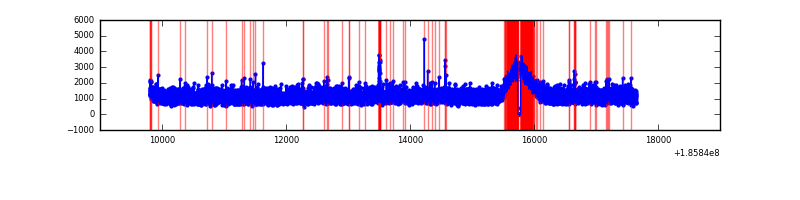 |
| D | 7849 | 7800 | 484 | 484 | 6.17% | 6.21% |  |
Top three noisy pixels from each quadrant. If the there are fewer than three noisy pixels in the level2.evt file, extra rows are filled as -1
| Pixel properties | Quadrant properties | ||||||
|---|---|---|---|---|---|---|---|
| Quadrant | DetID | PixID | Counts | Sigma | Mean | Median | Sigma |
| A | 15 | 17 | 60830 | 100.41 | 2397 | 2408 | 581.8 |
| A | 11 | 79 | 12061 | 16.59 | 2397 | 2408 | 581.8 |
| A | 10 | 133 | 7494 | 8.74 | 2397 | 2408 | 581.8 |
| B | 5 | 191 | 54091 | 86.0 | 2545 | 2549 | 599.3 |
| B | 0 | 23 | 37784 | 58.79 | 2545 | 2549 | 599.3 |
| B | 2 | 2 | 22405 | 33.13 | 2545 | 2549 | 599.3 |
| C | 9 | 52 | 90393 | 135.82 | 2319 | 2397 | 647.9 |
| C | 3 | 111 | 42109 | 61.29 | 2319 | 2397 | 647.9 |
| C | 3 | 79 | 32903 | 47.09 | 2319 | 2397 | 647.9 |
| D | 2 | 216 | 422625 | 611.13 | 2219 | 2296 | 687.8 |
| D | 1 | 4 | 203459 | 292.48 | 2219 | 2296 | 687.8 |
| D | 10 | 157 | 38513 | 52.66 | 2219 | 2296 | 687.8 |
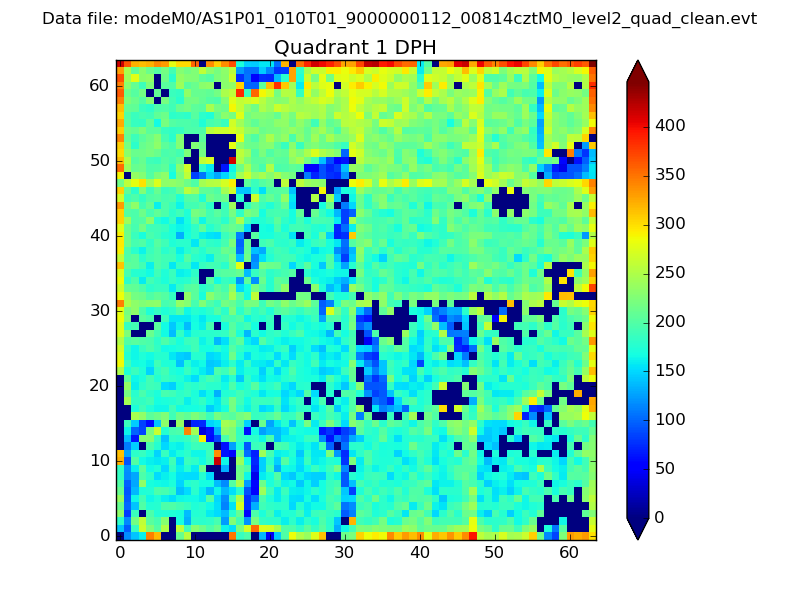
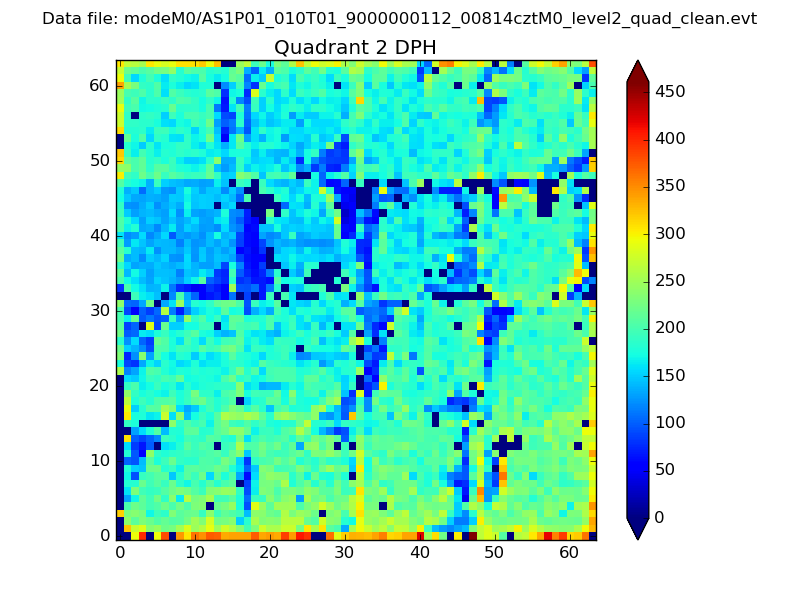
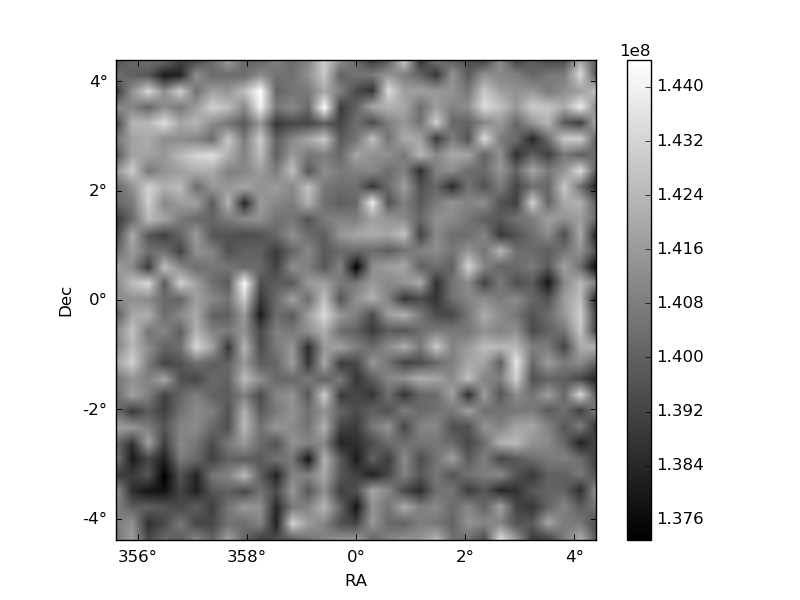
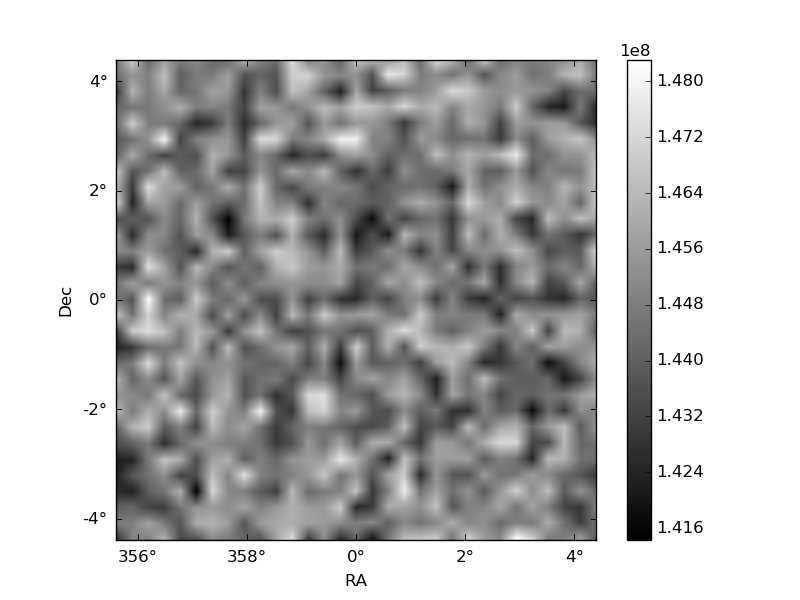
Histogram calculated using DETX and DETY for each event in the final _common_clean file
| Quadrant A | 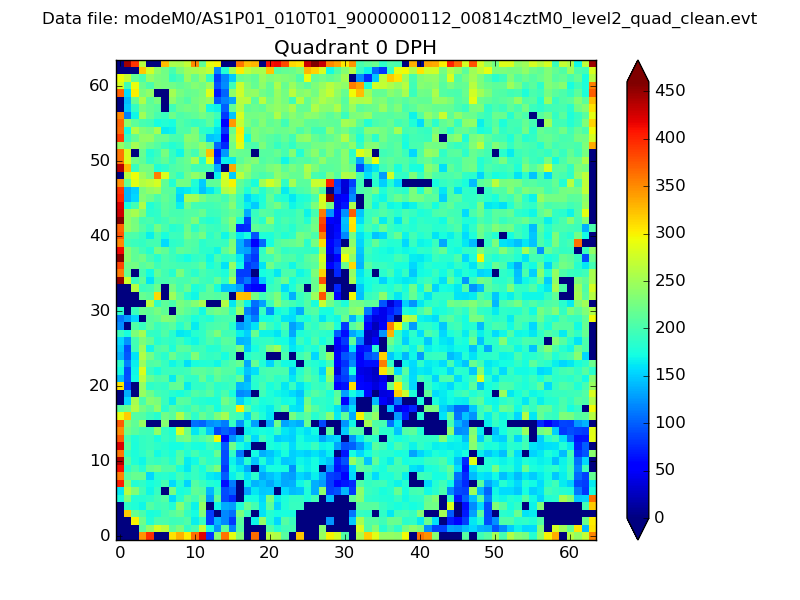 |
 |
Quadrant B |
|---|---|---|---|
| Quadrant D | 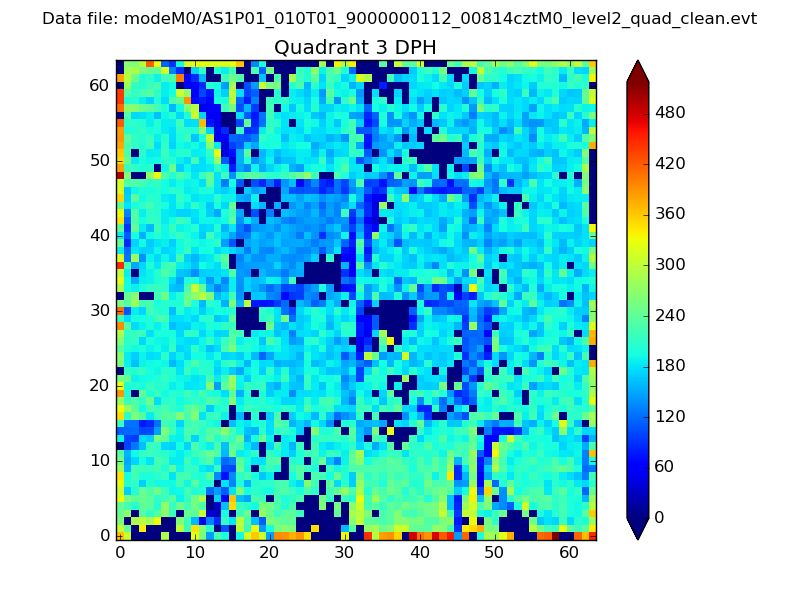 |
 |
Quadrant C |
| Plot type | Count rate plots | Images |
|---|---|---|
| Comparison with Poisson distribution Blue bars denote a histogram of data divided into 1 sec bins. Red curve is a Poisson curve with rate = median count rate of data. |
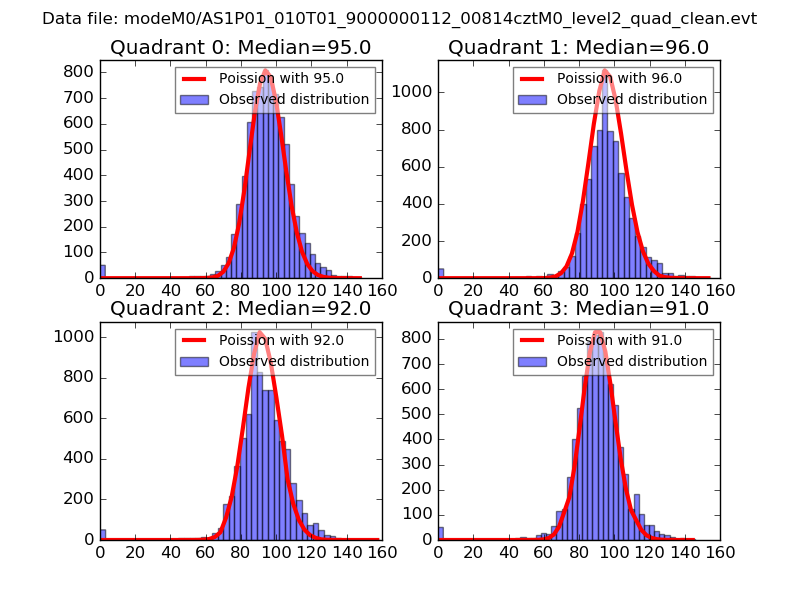 |
 |
| Quadrant-wise count rates Data is divided into 100 sec bins |
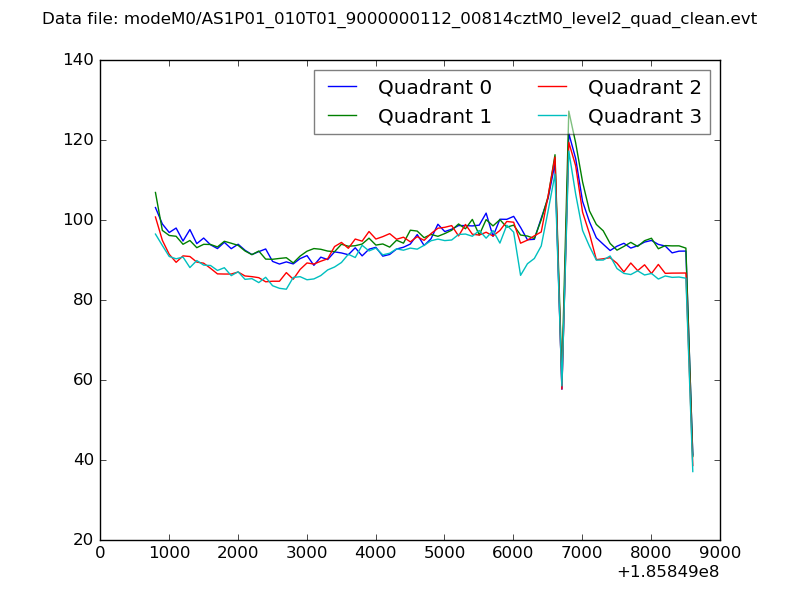 |
|
| Module-wise count rates for Quadrant A Data is divided into 100 sec bins |
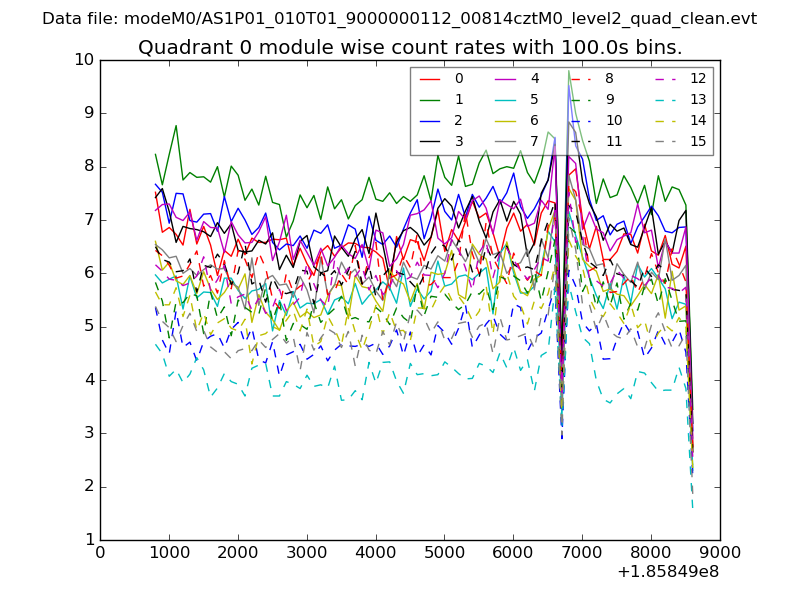 |
 |
| Module-wise count rates for Quadrant B Data is divided into 100 sec bins |
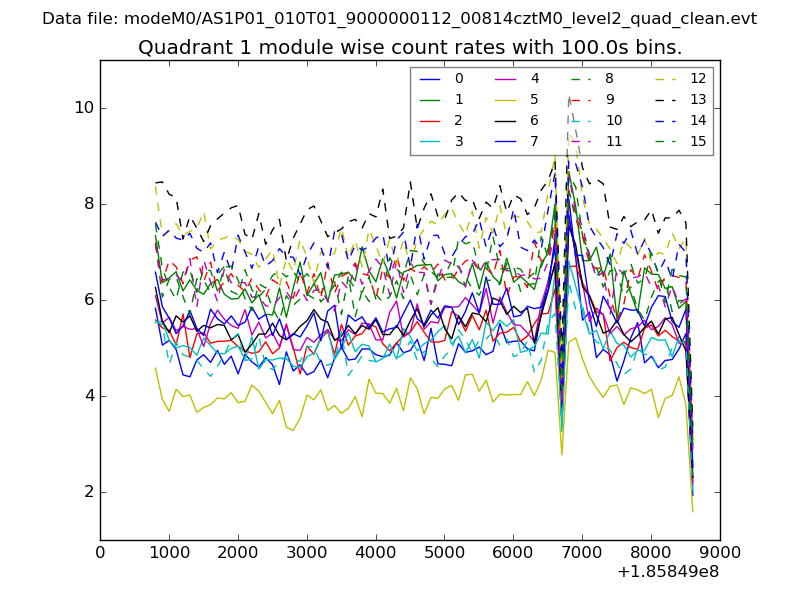 |
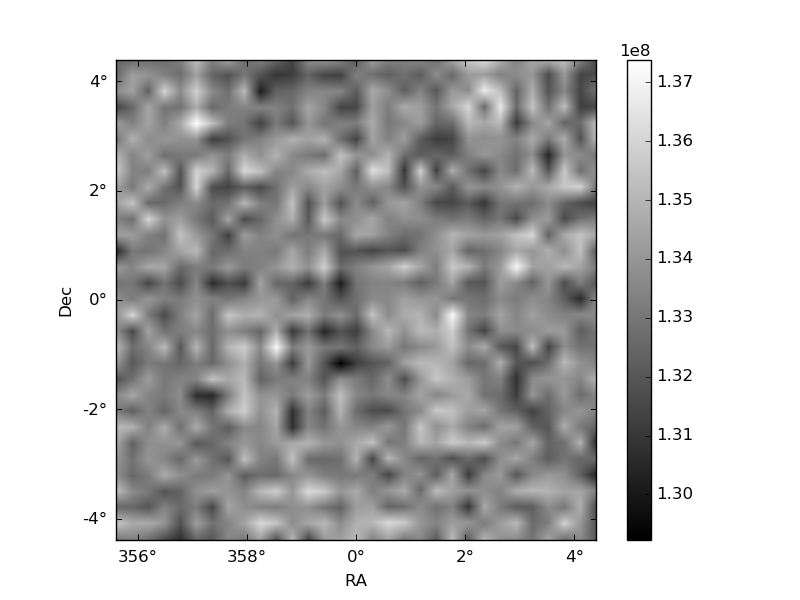 |
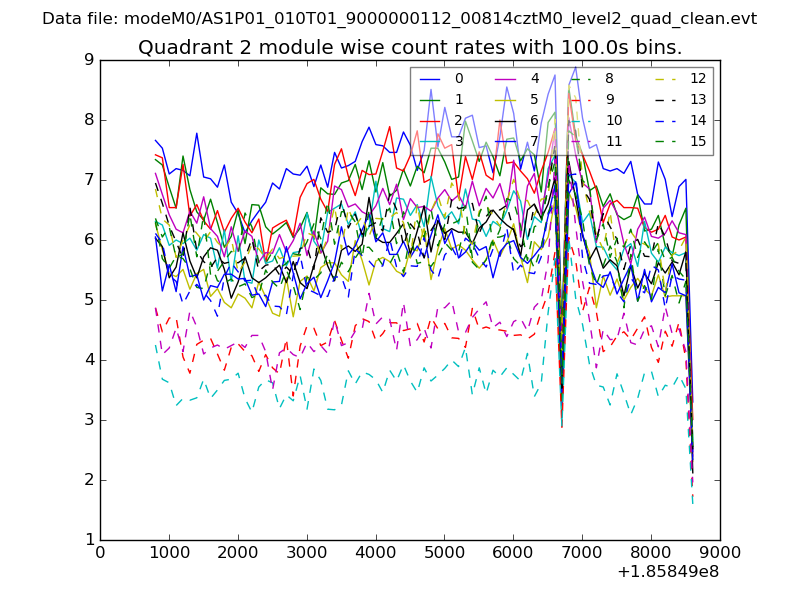
| Module-wise count rates for Quadrant C Data is divided into 100 sec bins |
 |
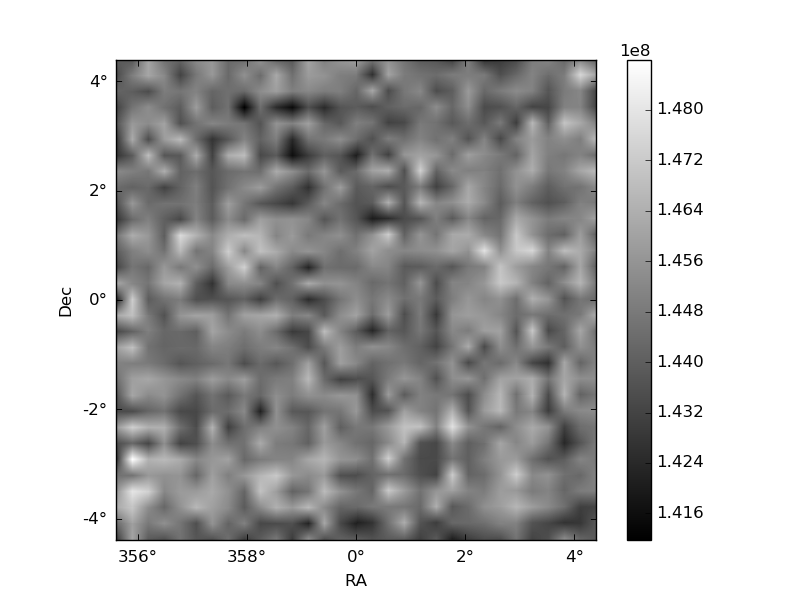 |
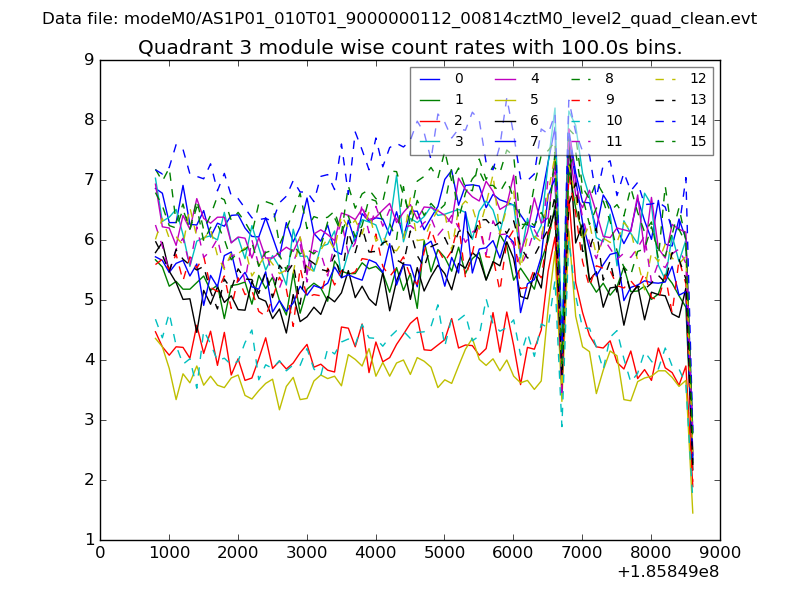
| Module-wise count rates for Quadrant D Data is divided into 100 sec bins |
 |
 |
| Parameter | Plot |
|---|---|
| CZT HV Monitor | 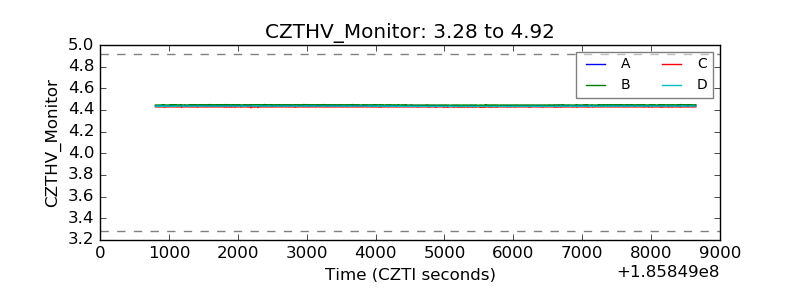 |
| D_VDD |  |
| Temperature 1 | 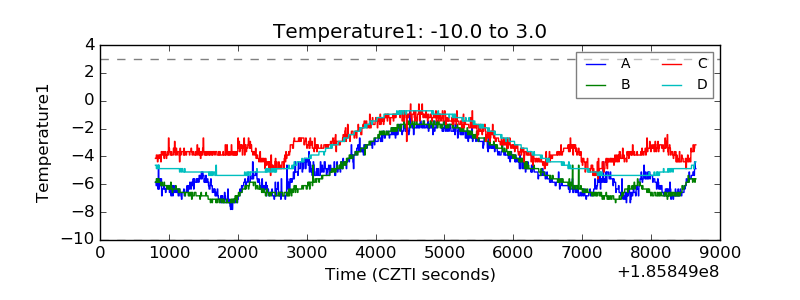 |
| Veto HV Monitor |  |
| Veto LLD | 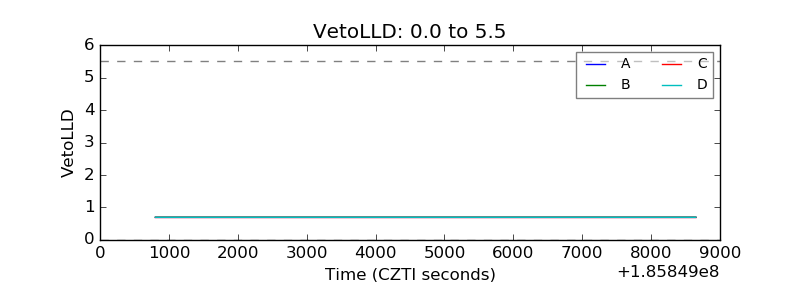 |
| Alpha Counter | 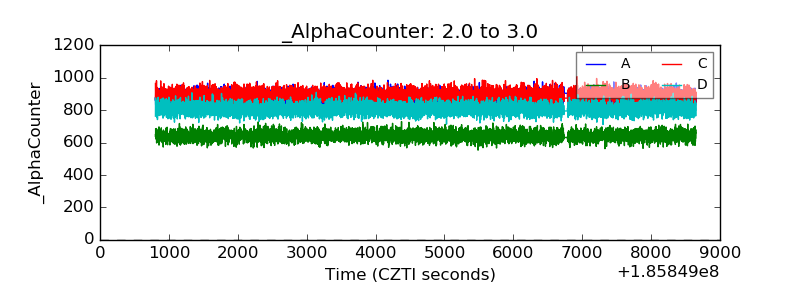 |
| _CPM_Rate |  |
| CZT Counter | 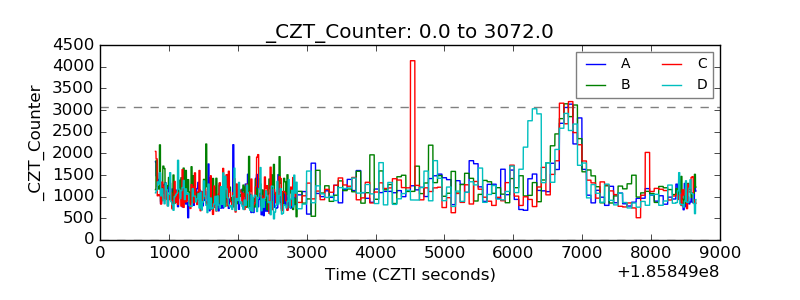 |
| +2.5 Volts monitor |  |
| +5 Volts monitor |  |
| _ROLL_ROT | 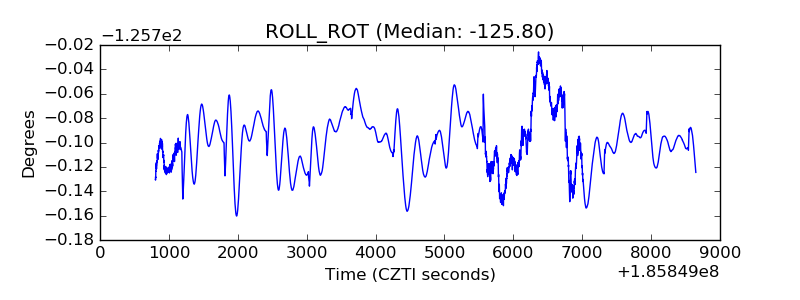 |
| _Roll_DEC | 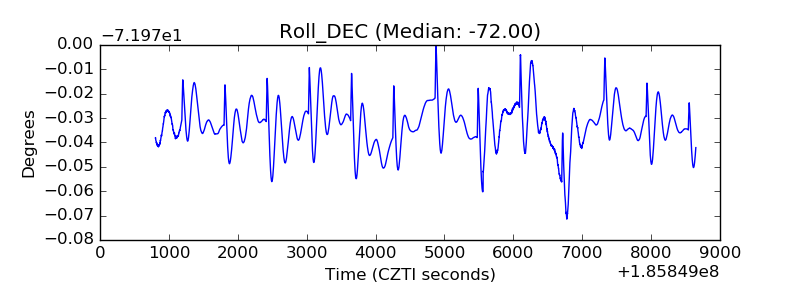 |
| _Roll_RA |  |
| Veto Counter | 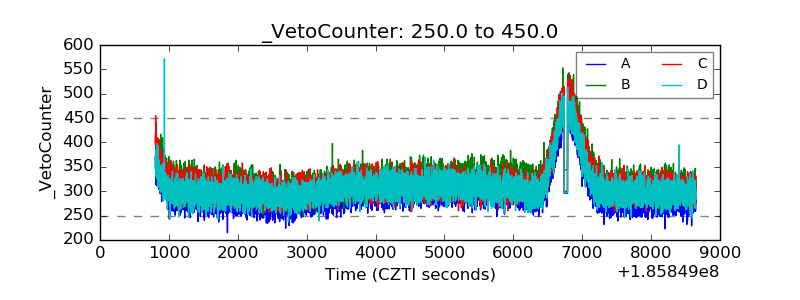 |