| Param | Original file | Final file |
|---|---|---|
| Filename | modeM0/AS1P01_010T01_9000000112_00815cztM0_level2.evt | modeM0/AS1P01_010T01_9000000112_00815cztM0_level2_quad_clean.evt |
| Size (bytes) | 571,991,040 | 53,968,320 |
| Size | 545.5 MB | 51.5 MB |
| Events in quadrant A | 4,192,025 | 344,961 |
| Events in quadrant B | 4,394,883 | 351,634 |
| Events in quadrant C | 4,362,500 | 340,583 |
| Events in quadrant D | 4,122,151 | 331,210 |
| Mode M0 | |||
|---|---|---|---|
| Quadrant | BADHDUFLAG | Total packets | Discarded packets |
| A | 0 | 15096 | 0 |
| B | 0 | 15727 | 0 |
| C | 0 | 15620 | 0 |
| D | 0 | 14915 | 0 |
| Mode SS | |||
|---|---|---|---|
| Quadrant | BADHDUFLAG | Total packets | Discarded packets |
| A | 0 | 76 | 0 |
| B | 0 | 76 | 0 |
| C | 0 | 76 | 0 |
| D | 0 | 76 | 0 |
| Quadrant | Total seconds | Saturated seconds | Saturation percentage |
|---|---|---|---|
| A | 3753 | 0 | 0.000000% |
| B | 3753 | 0 | 0.000000% |
| C | 3754 | 17 | 0.452850% |
| D | 3754 | 23 | 0.612680% |
Noise dominated data is calculated using 1-second bins in cleaned event files. If a bin has >2000 counts, and if more than 50% of those come from <1% of pixels, then it is considered to be noise-dominated and hence unusable.
| Quadrant | # 1 sec bins | Bins with >0 counts | Bins with >2000 counts | High rate bins dominated by noise | Noise dominated (total time) | Noise dominated (detector-on time) | Marked lightcurve |
|---|---|---|---|---|---|---|---|
| A | 3753 | 3753 | 29 | 29 | 0.77% | 0.77% | 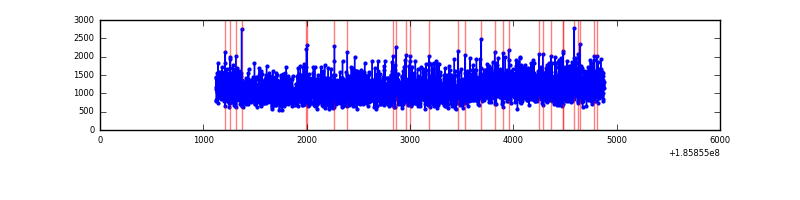 |
| B | 3753 | 3753 | 44 | 44 | 1.17% | 1.17% |  |
| C | 3754 | 3754 | 89 | 89 | 2.37% | 2.37% | 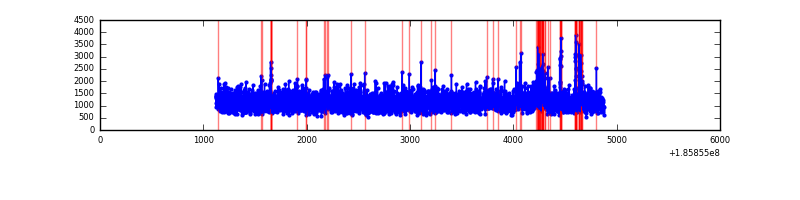 |
| D | 3754 | 3754 | 70 | 70 | 1.86% | 1.86% | 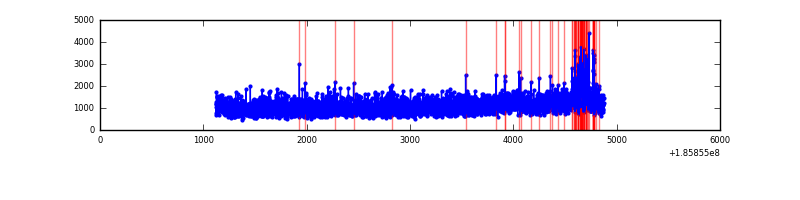 |
Top three noisy pixels from each quadrant. If the there are fewer than three noisy pixels in the level2.evt file, extra rows are filled as -1
| Pixel properties | Quadrant properties | ||||||
|---|---|---|---|---|---|---|---|
| Quadrant | DetID | PixID | Counts | Sigma | Mean | Median | Sigma |
| A | 14 | 79 | 11493 | 39.26 | 1089 | 1094 | 264.8 |
| A | 11 | 79 | 4557 | 13.08 | 1089 | 1094 | 264.8 |
| A | 15 | 233 | 3624 | 9.55 | 1089 | 1094 | 264.8 |
| B | 0 | 220 | 71277 | 261.75 | 1131 | 1134 | 268.0 |
| B | 15 | 85 | 11030 | 36.93 | 1131 | 1134 | 268.0 |
| B | 7 | 221 | 10310 | 34.24 | 1131 | 1134 | 268.0 |
| C | 9 | 160 | 149733 | 503.31 | 1058 | 1098 | 295.3 |
| C | 3 | 111 | 18750 | 59.77 | 1058 | 1098 | 295.3 |
| C | 3 | 79 | 15897 | 50.11 | 1058 | 1098 | 295.3 |
| D | 2 | 216 | 113945 | 358.5 | 1027 | 1063 | 314.9 |
| D | 1 | 4 | 101758 | 319.8 | 1027 | 1063 | 314.9 |
| D | 13 | 170 | 14742 | 43.44 | 1027 | 1063 | 314.9 |
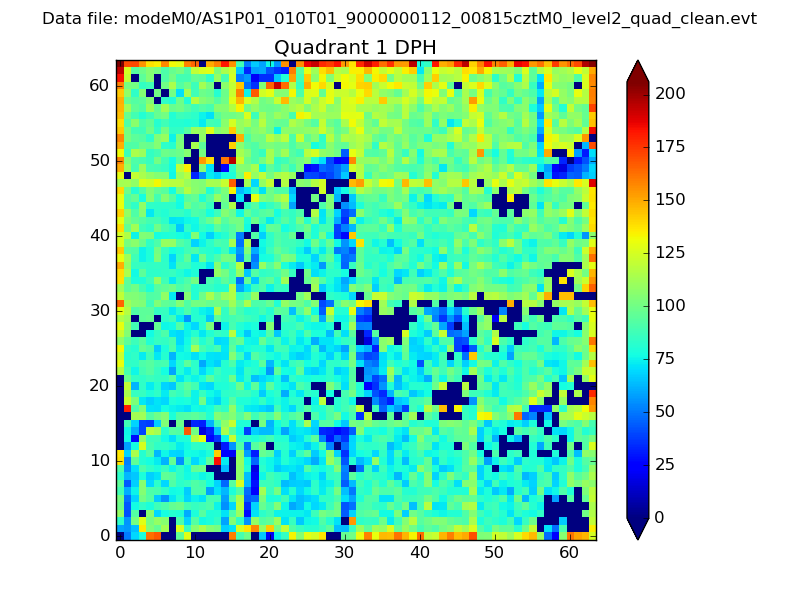
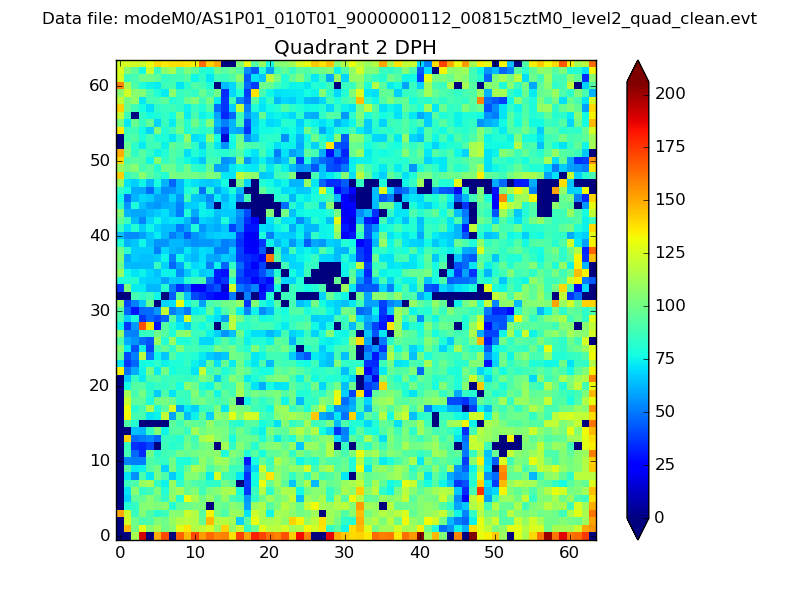
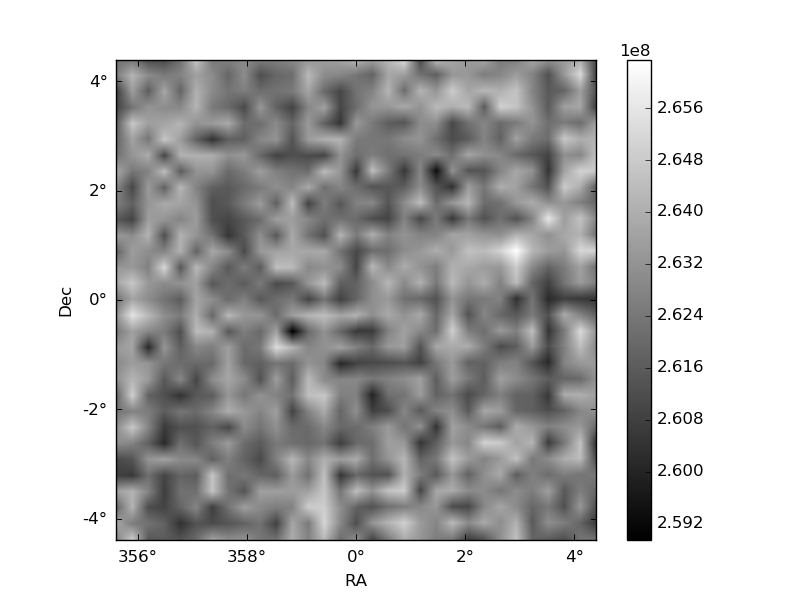
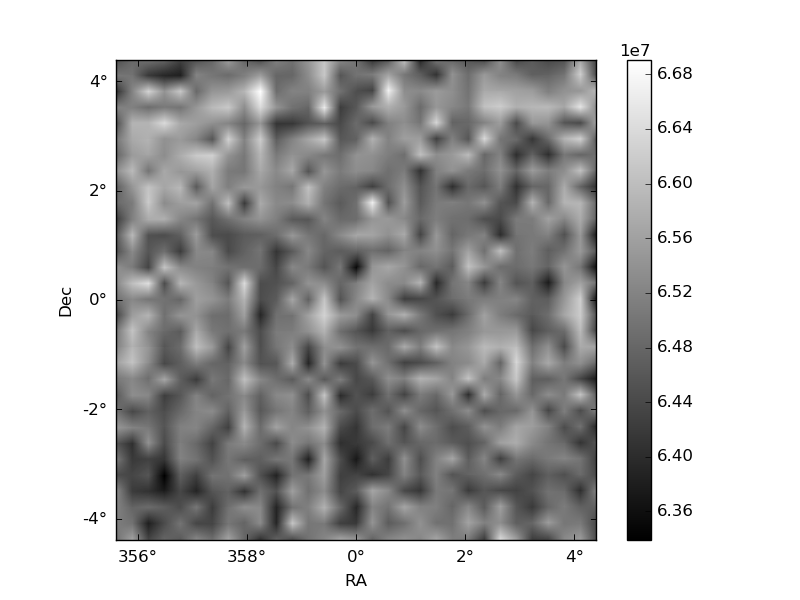
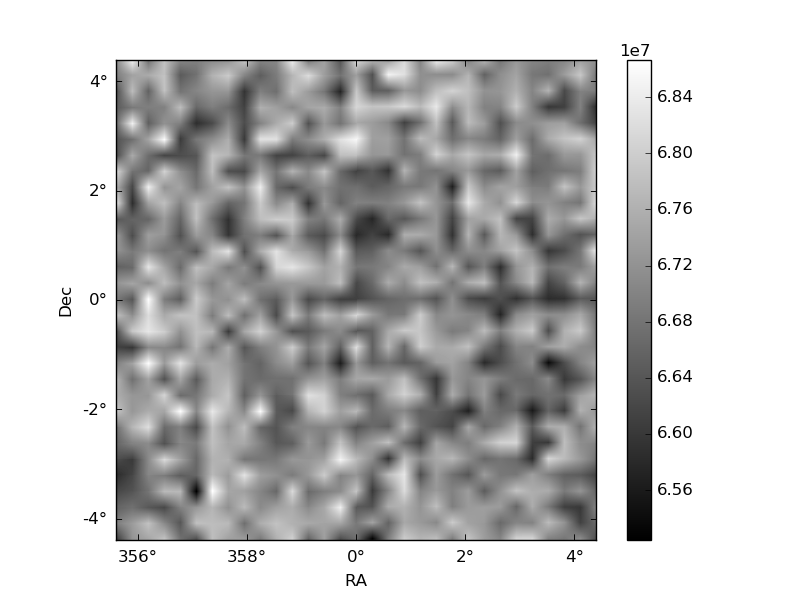
Histogram calculated using DETX and DETY for each event in the final _common_clean file
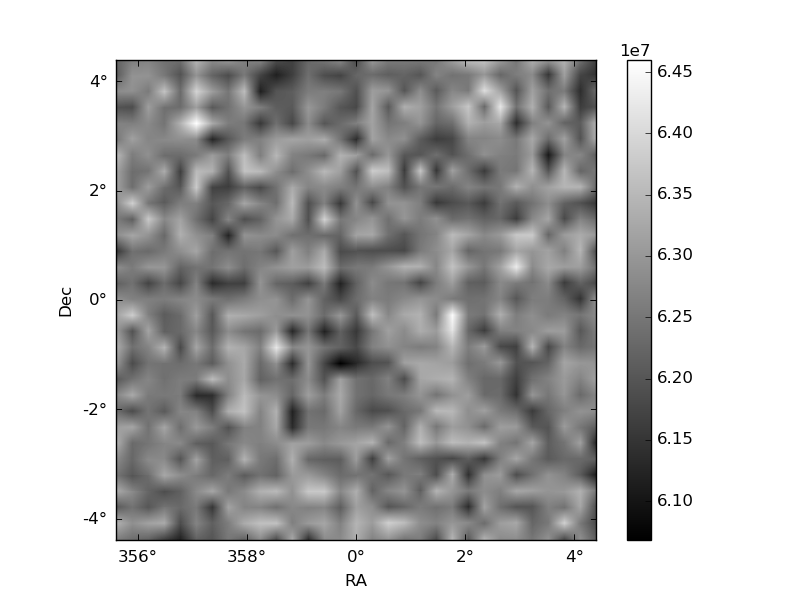
| Quadrant A | 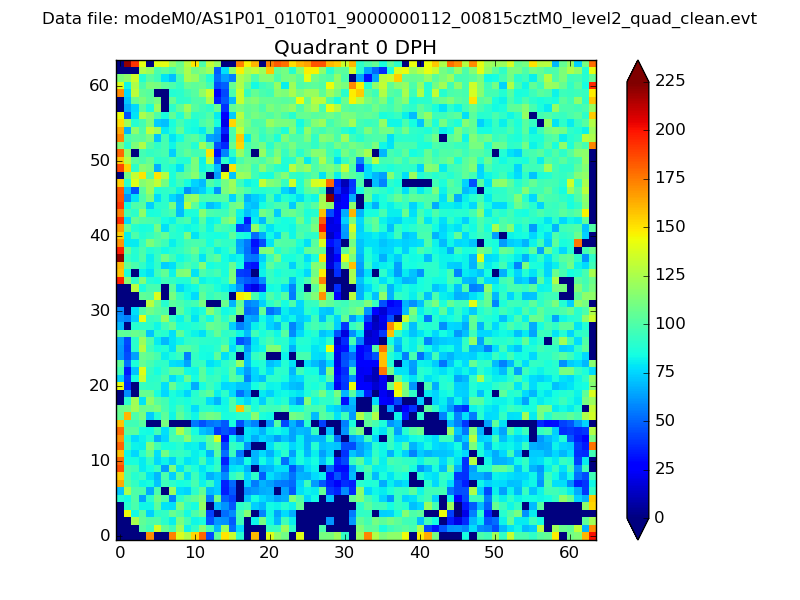 |
 |
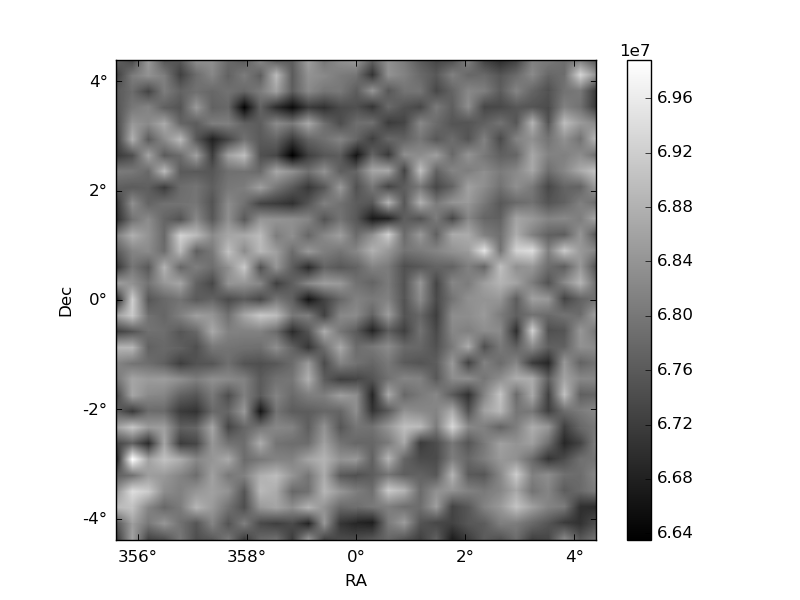
Quadrant B |
|---|---|---|---|
| Quadrant D | 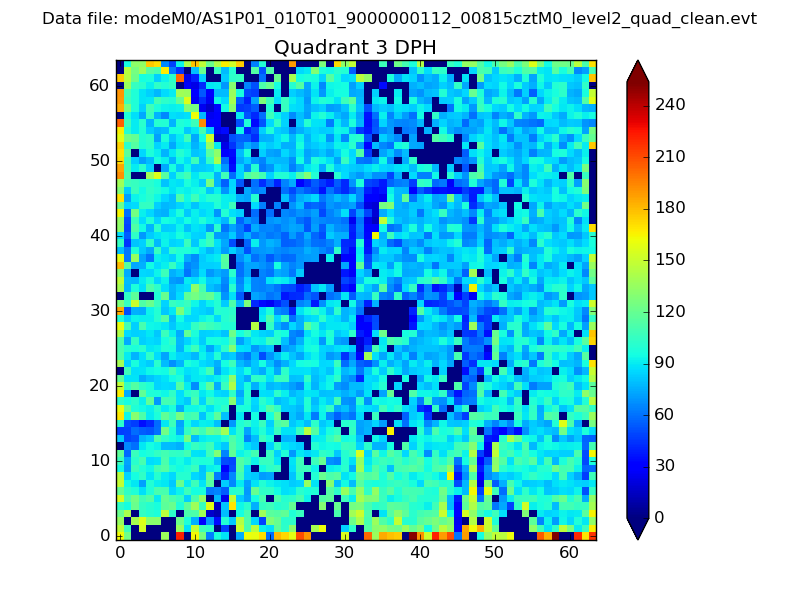 |
 |
Quadrant C |
| Plot type | Count rate plots | Images |
|---|---|---|
| Comparison with Poisson distribution Blue bars denote a histogram of data divided into 1 sec bins. Red curve is a Poisson curve with rate = median count rate of data. |
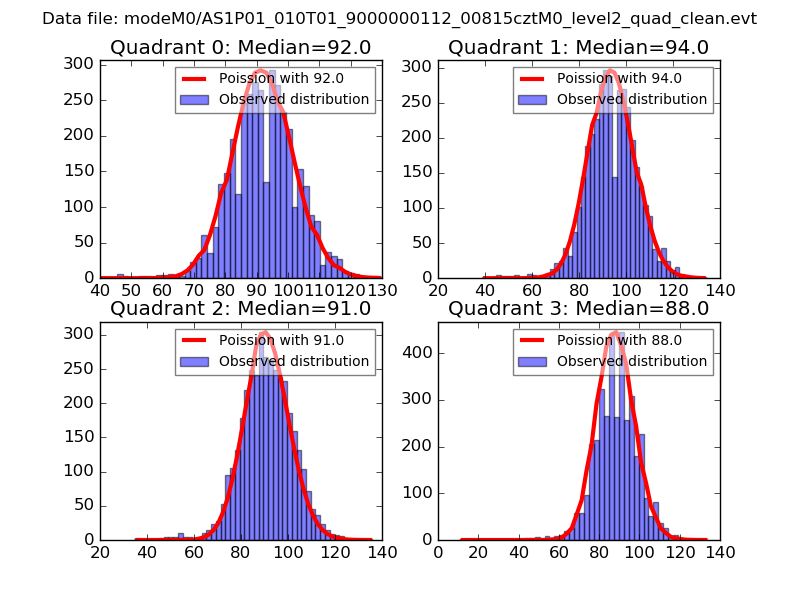 |
 |
| Quadrant-wise count rates Data is divided into 100 sec bins |
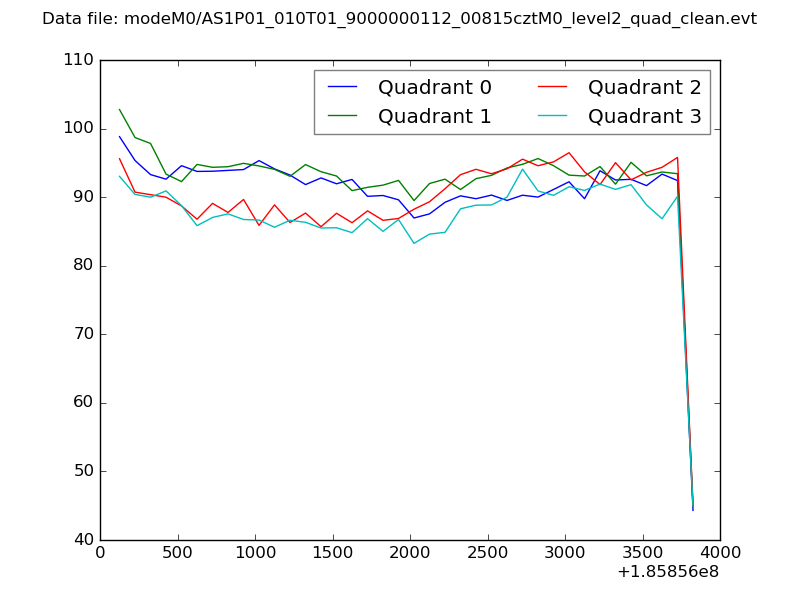 |
|
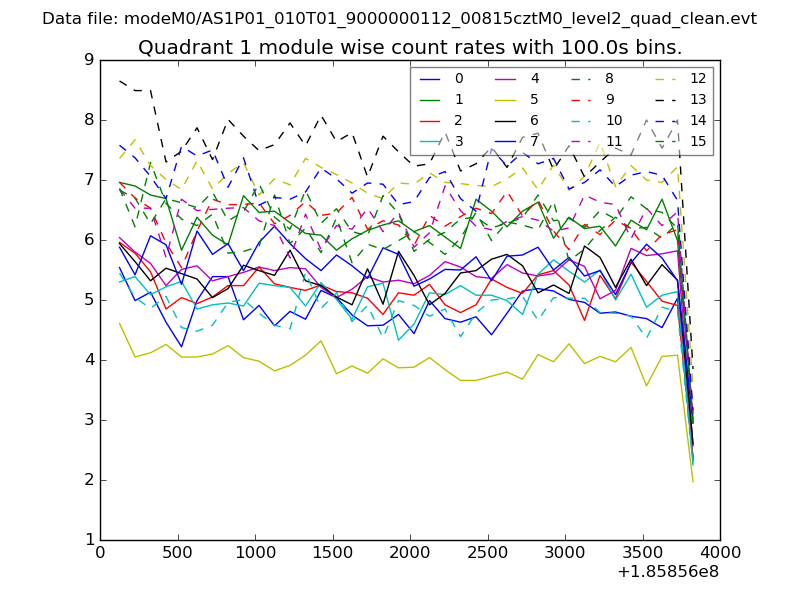
| Module-wise count rates for Quadrant A Data is divided into 100 sec bins |
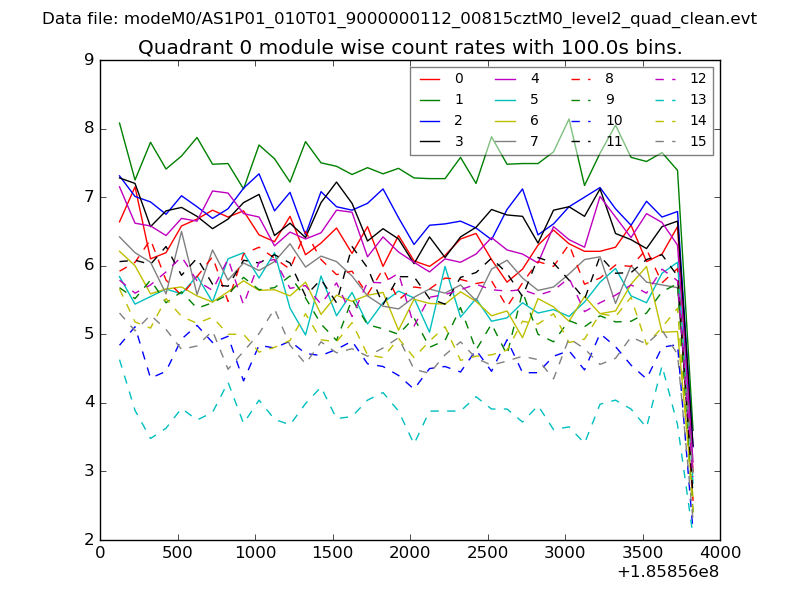 |
 |
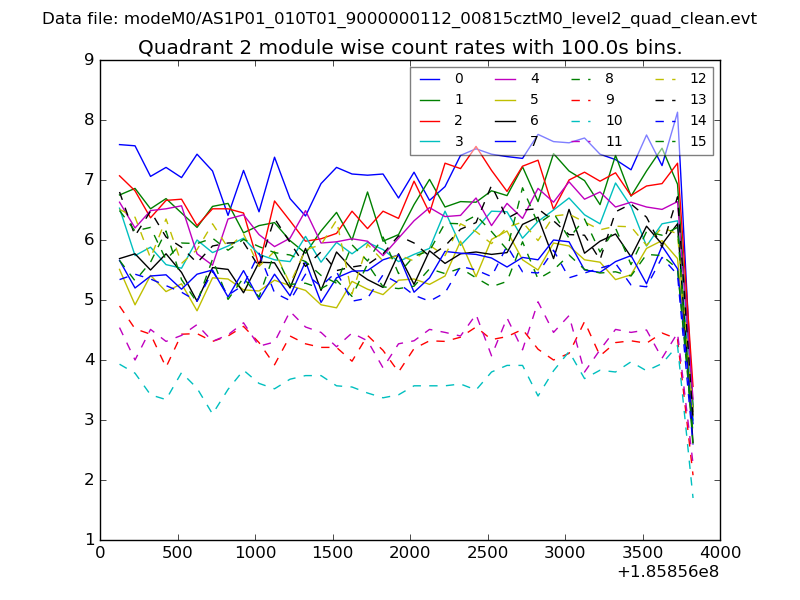
| Module-wise count rates for Quadrant B Data is divided into 100 sec bins |
 |
 |
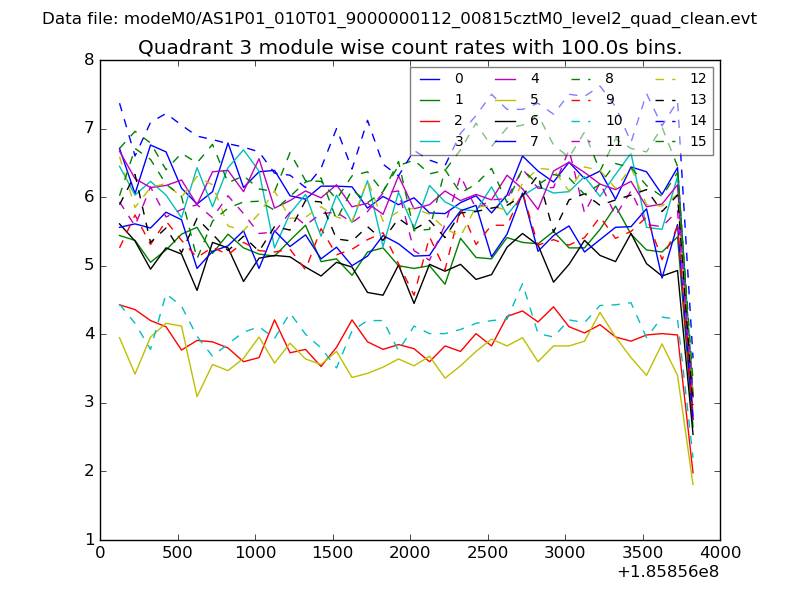
| Module-wise count rates for Quadrant C Data is divided into 100 sec bins |
 |
 |
| Module-wise count rates for Quadrant D Data is divided into 100 sec bins |
 |
 |
| Parameter | Plot |
|---|---|
| CZT HV Monitor | 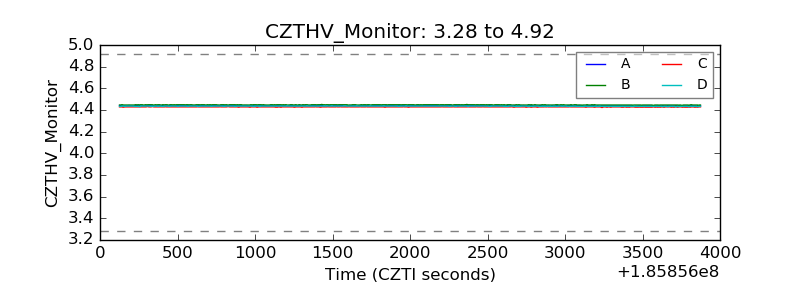 |
| D_VDD |  |
| Temperature 1 | 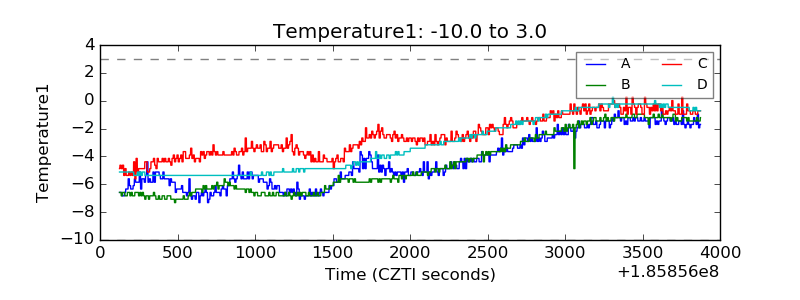 |
| Veto HV Monitor | 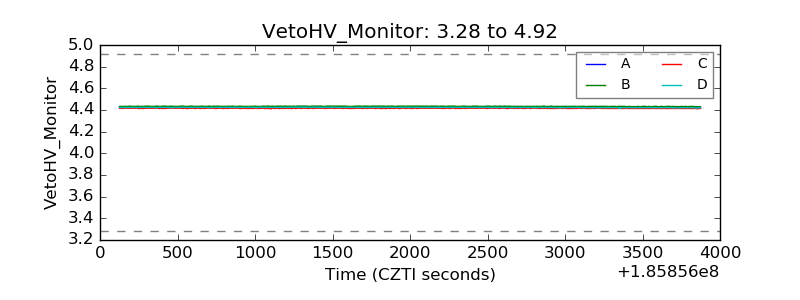 |
| Veto LLD | 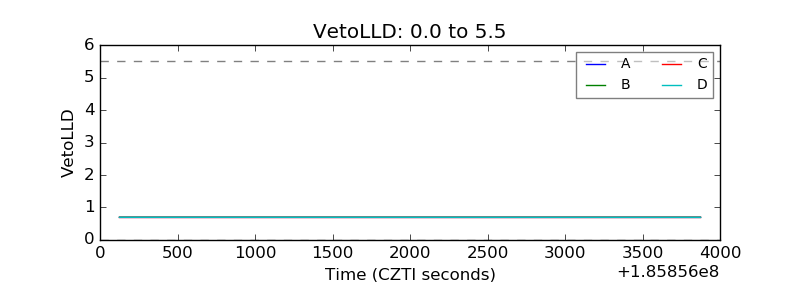 |
| Alpha Counter | 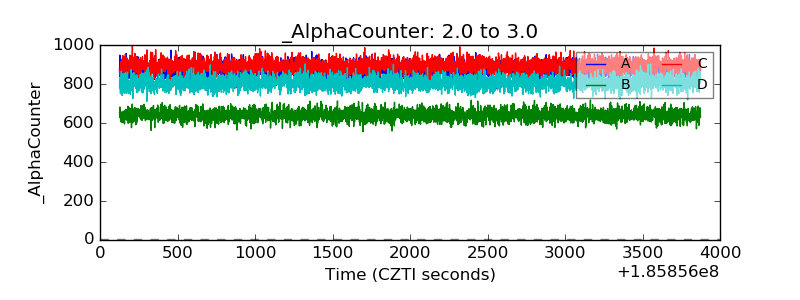 |
| _CPM_Rate | 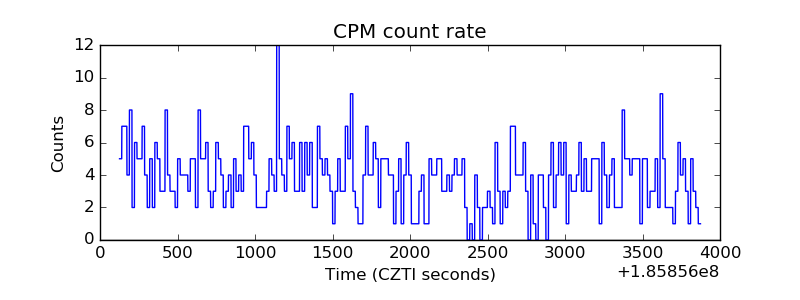 |
| CZT Counter | 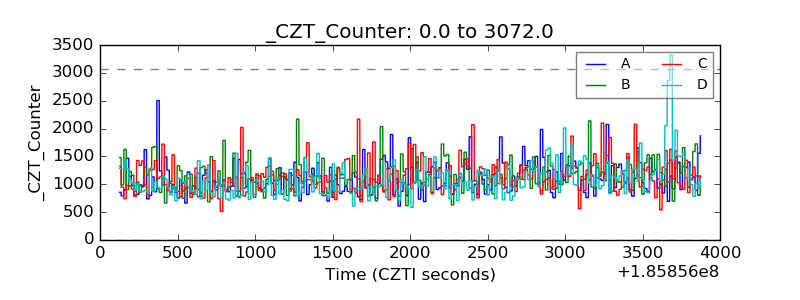 |
| +2.5 Volts monitor |  |
| +5 Volts monitor |  |
| _ROLL_ROT | 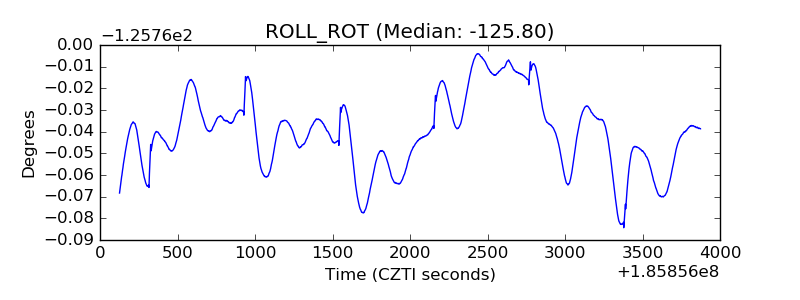 |
| _Roll_DEC | 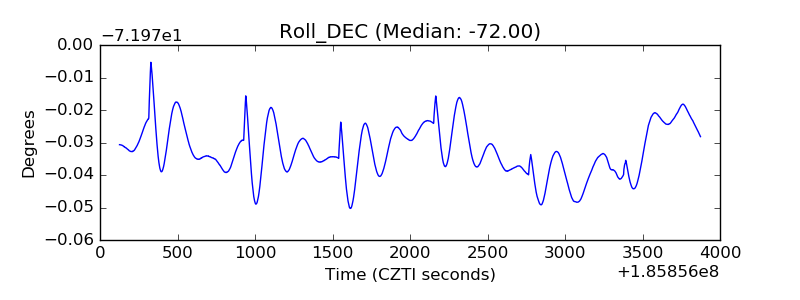 |
| _Roll_RA | 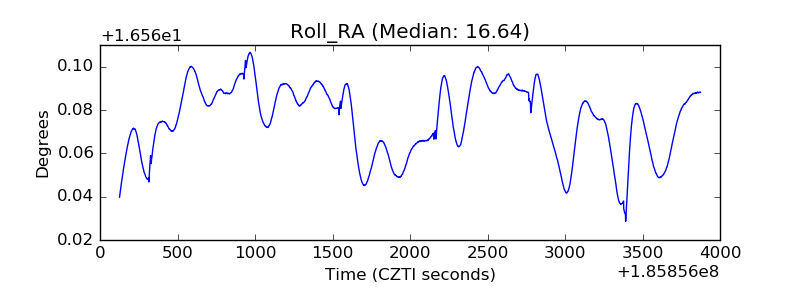 |
| Veto Counter | 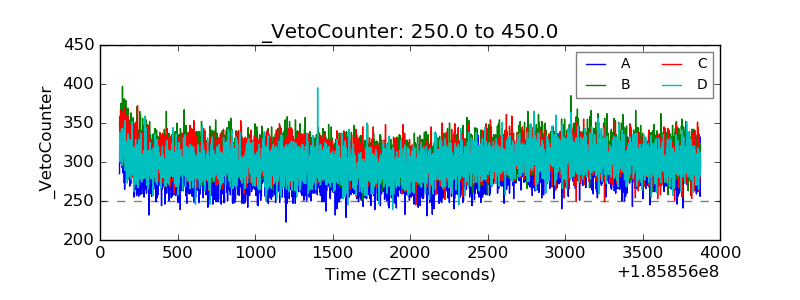 |