| Param | Original file | Final file |
|---|---|---|
| Filename | modeM0/AS1P01_010T01_9000000112_00816cztM0_level2.evt | modeM0/AS1P01_010T01_9000000112_00816cztM0_level2_quad_clean.evt |
| Size (bytes) | 1,128,985,920 | 100,719,360 |
| Size | 1.1 GB | 96.1 MB |
| Events in quadrant A | 8,635,819 | 643,661 |
| Events in quadrant B | 8,740,630 | 656,403 |
| Events in quadrant C | 8,224,453 | 642,238 |
| Events in quadrant D | 8,135,131 | 628,971 |
| Mode M9 | |||
|---|---|---|---|
| Quadrant | BADHDUFLAG | Total packets | Discarded packets |
| A | 0 | 1 | 0 |
| B | 0 | 1 | 0 |
| C | 0 | 1 | 0 |
| D | 0 | 1 | 0 |
| Mode M0 | |||
|---|---|---|---|
| Quadrant | BADHDUFLAG | Total packets | Discarded packets |
| A | 0 | 30562 | 0 |
| B | 0 | 30808 | 0 |
| C | 0 | 29345 | 0 |
| D | 0 | 29081 | 0 |
| Mode SS | |||
|---|---|---|---|
| Quadrant | BADHDUFLAG | Total packets | Discarded packets |
| A | 0 | 140 | 0 |
| B | 0 | 140 | 0 |
| C | 0 | 140 | 0 |
| D | 0 | 140 | 0 |
| Quadrant | Total seconds | Saturated seconds | Saturation percentage |
|---|---|---|---|
| A | 6867 | 183 | 2.664919% |
| B | 6867 | 101 | 1.470802% |
| C | 6866 | 109 | 1.587533% |
| D | 6866 | 103 | 1.500146% |
Noise dominated data is calculated using 1-second bins in cleaned event files. If a bin has >2000 counts, and if more than 50% of those come from <1% of pixels, then it is considered to be noise-dominated and hence unusable.
| Quadrant | # 1 sec bins | Bins with >0 counts | Bins with >2000 counts | High rate bins dominated by noise | Noise dominated (total time) | Noise dominated (detector-on time) | Marked lightcurve |
|---|---|---|---|---|---|---|---|
| A | 7017 | 6869 | 424 | 424 | 6.04% | 6.17% | 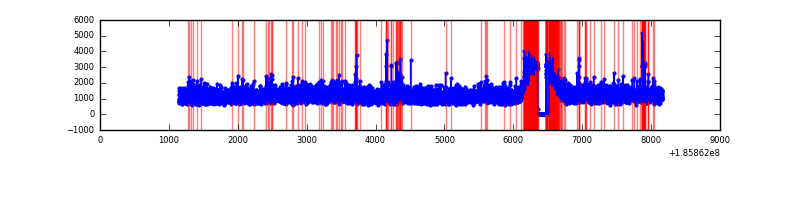 |
| B | 7017 | 6868 | 378 | 378 | 5.39% | 5.50% |  |
| C | 7016 | 6868 | 331 | 331 | 4.72% | 4.82% | 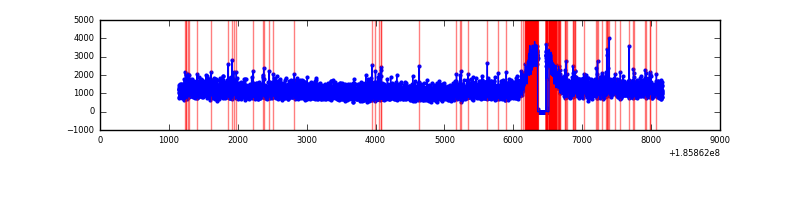 |
| D | 7016 | 6867 | 390 | 390 | 5.56% | 5.68% |  |
Top three noisy pixels from each quadrant. If the there are fewer than three noisy pixels in the level2.evt file, extra rows are filled as -1
| Pixel properties | Quadrant properties | ||||||
|---|---|---|---|---|---|---|---|
| Quadrant | DetID | PixID | Counts | Sigma | Mean | Median | Sigma |
| A | 15 | 233 | 362119 | 696.03 | 2144 | 2160 | 517.2 |
| A | 15 | 17 | 33035 | 59.7 | 2144 | 2160 | 517.2 |
| A | 14 | 79 | 13972 | 22.84 | 2144 | 2160 | 517.2 |
| B | 0 | 220 | 100694 | 182.32 | 2254 | 2261 | 539.9 |
| B | 5 | 191 | 23760 | 39.82 | 2254 | 2261 | 539.9 |
| B | 7 | 221 | 20669 | 34.1 | 2254 | 2261 | 539.9 |
| C | 15 | 241 | 50069 | 82.44 | 2068 | 2138 | 581.4 |
| C | 3 | 111 | 34913 | 56.38 | 2068 | 2138 | 581.4 |
| C | 3 | 79 | 30346 | 48.52 | 2068 | 2138 | 581.4 |
| D | 13 | 25 | 161942 | 255.22 | 2013 | 2084 | 626.3 |
| D | 1 | 4 | 149172 | 234.84 | 2013 | 2084 | 626.3 |
| D | 13 | 200 | 98981 | 154.7 | 2013 | 2084 | 626.3 |
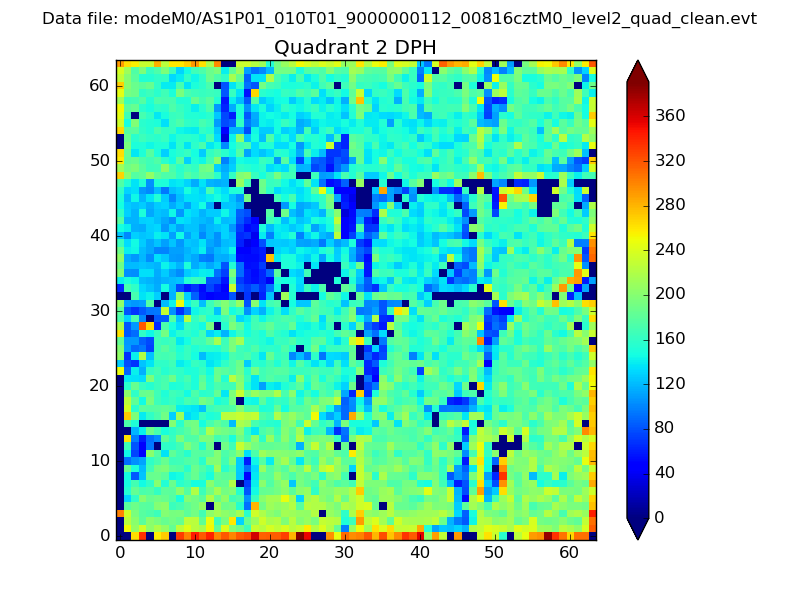
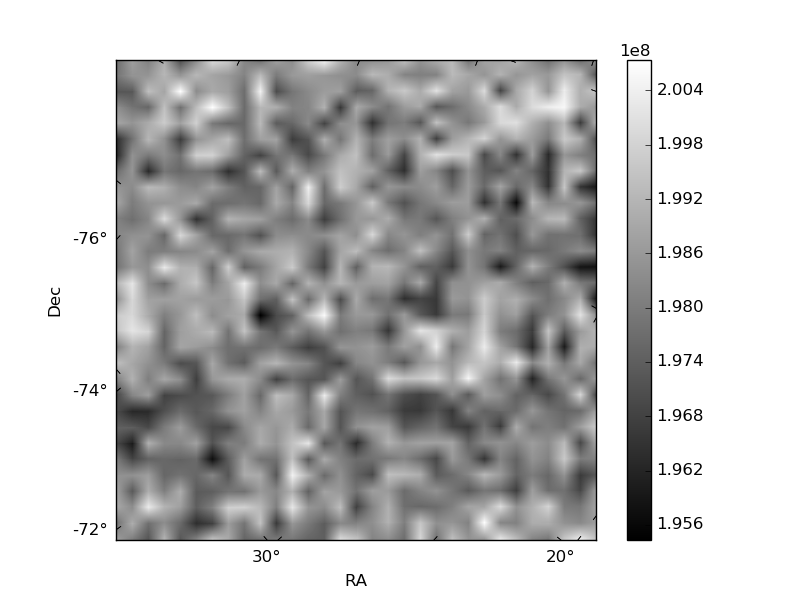
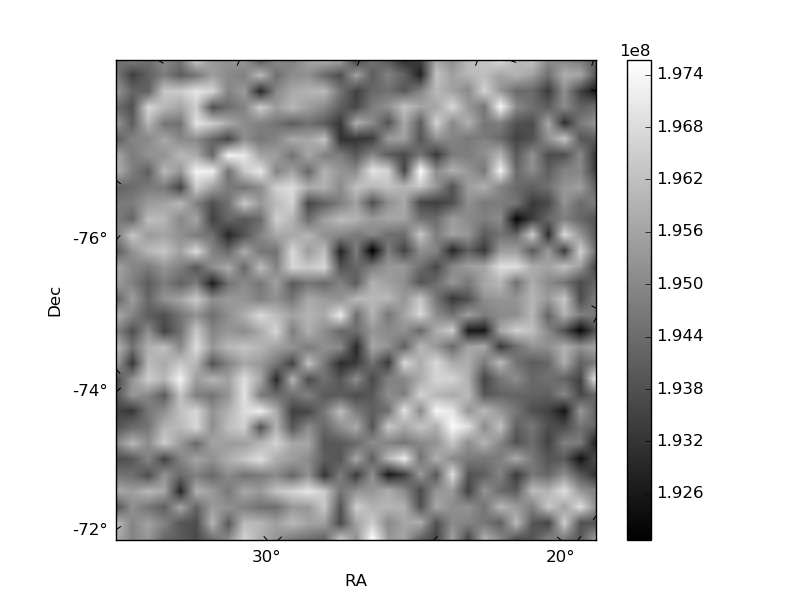
Histogram calculated using DETX and DETY for each event in the final _common_clean file
| Quadrant A | 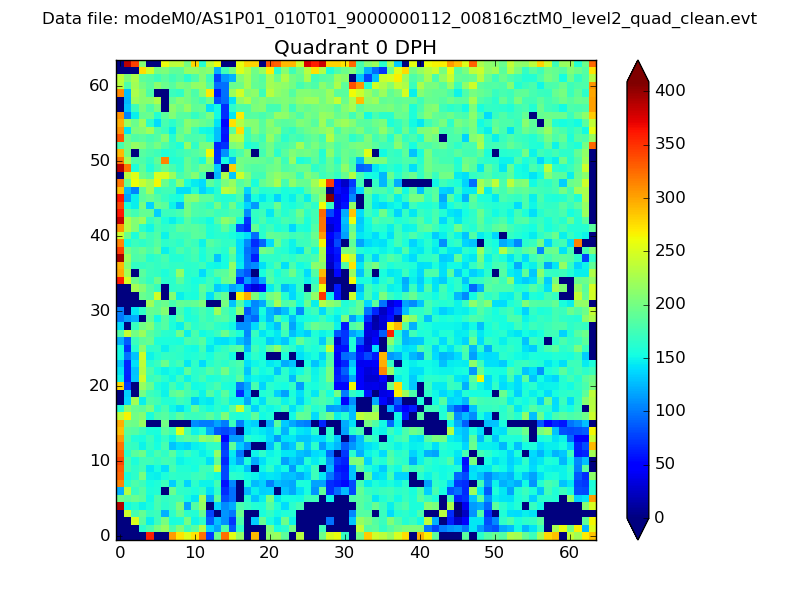 |
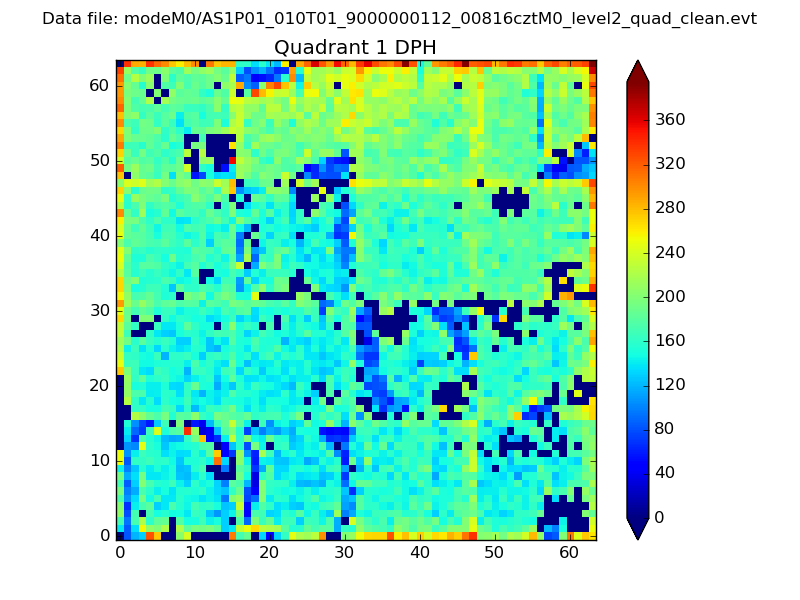 |
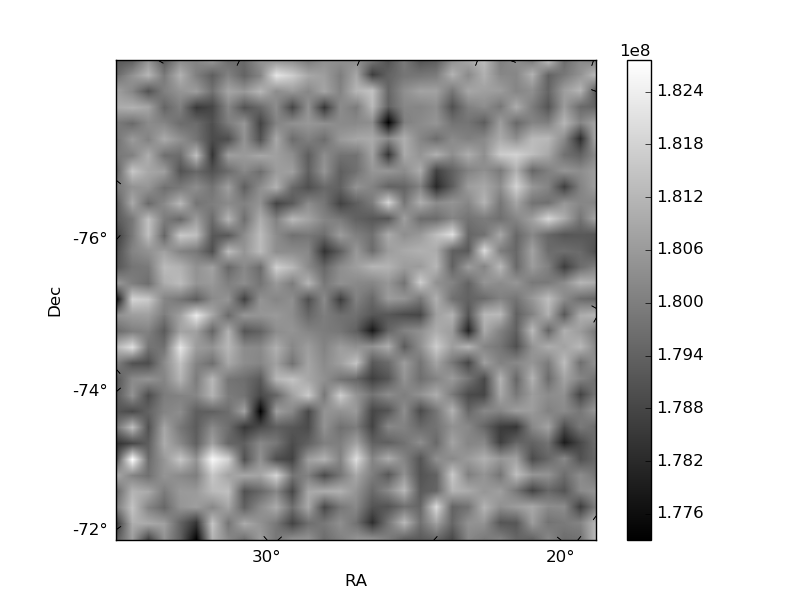
Quadrant B |
|---|---|---|---|
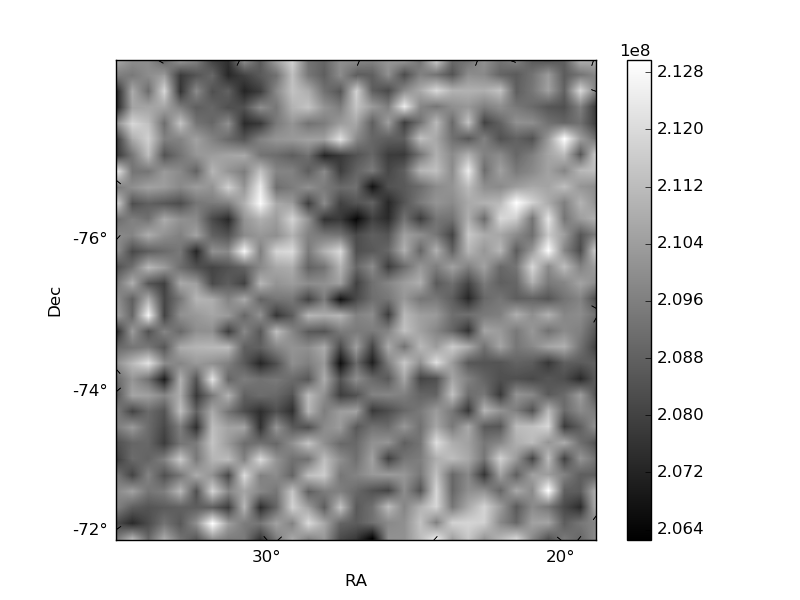
| Quadrant D | 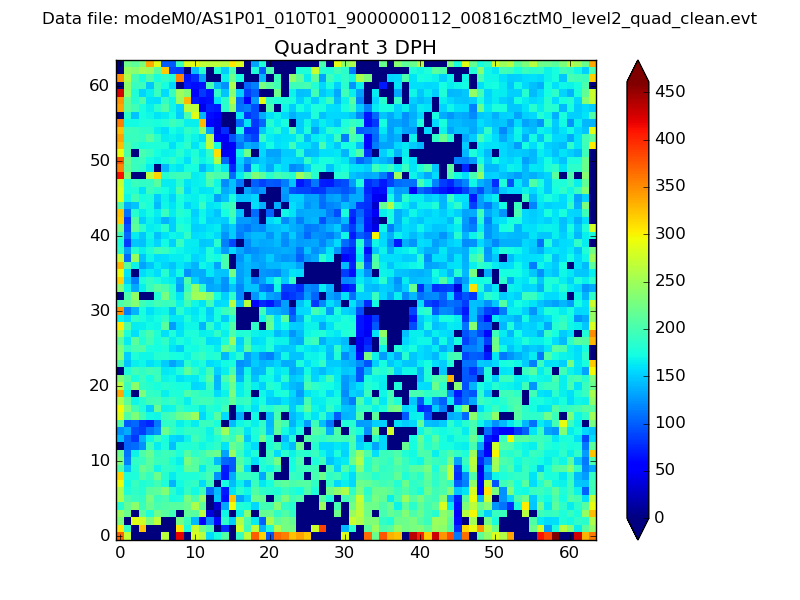 |
 |
Quadrant C |
| Plot type | Count rate plots | Images |
|---|---|---|
| Comparison with Poisson distribution Blue bars denote a histogram of data divided into 1 sec bins. Red curve is a Poisson curve with rate = median count rate of data. |
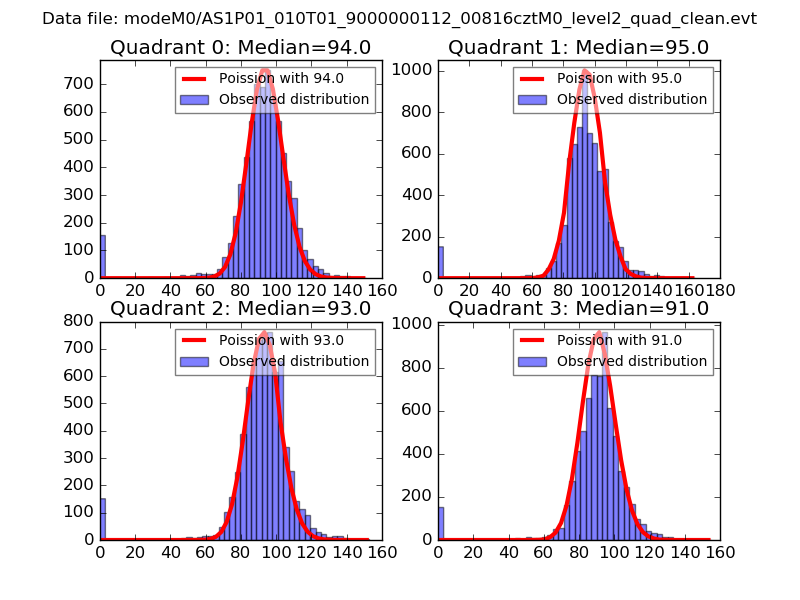 |
 |
| Quadrant-wise count rates Data is divided into 100 sec bins |
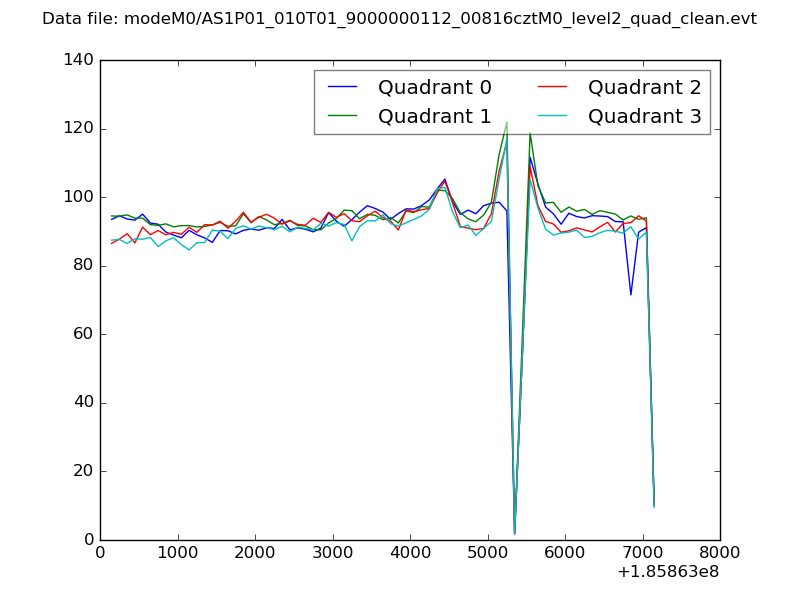 |
|
| Module-wise count rates for Quadrant A Data is divided into 100 sec bins |
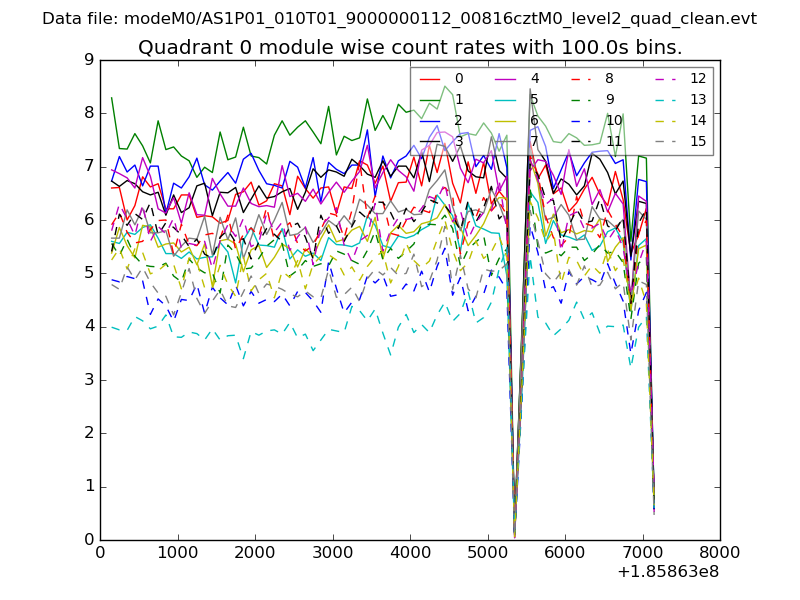 |
 |
| Module-wise count rates for Quadrant B Data is divided into 100 sec bins |
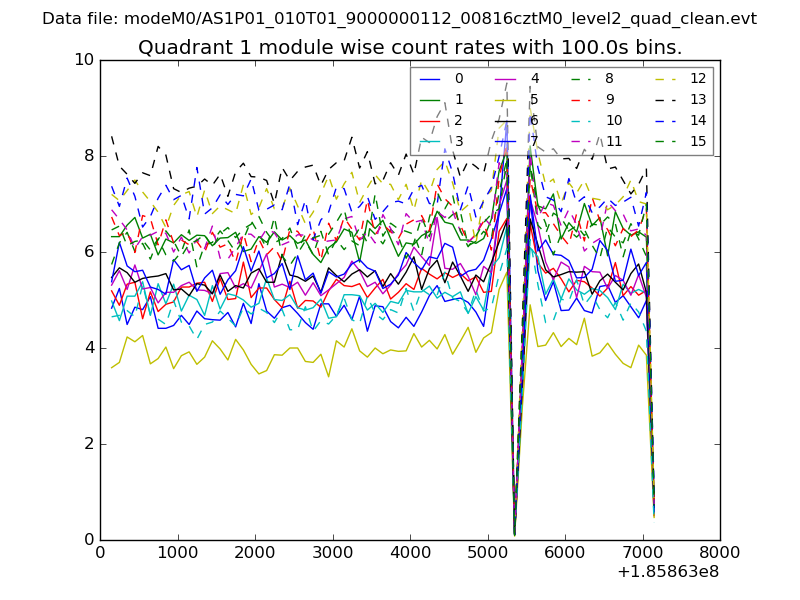 |
 |
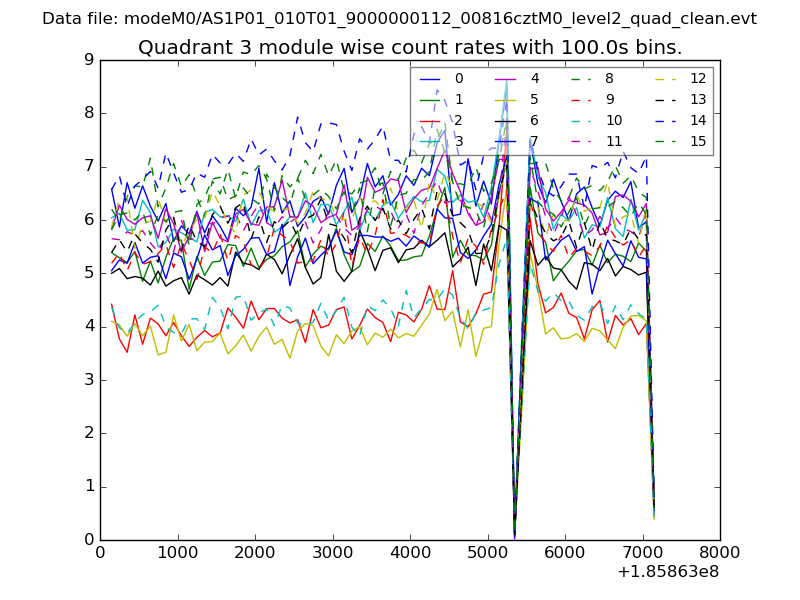
| Module-wise count rates for Quadrant C Data is divided into 100 sec bins |
 |
 |
| Module-wise count rates for Quadrant D Data is divided into 100 sec bins |
 |
 |
| Parameter | Plot |
|---|---|
| CZT HV Monitor | 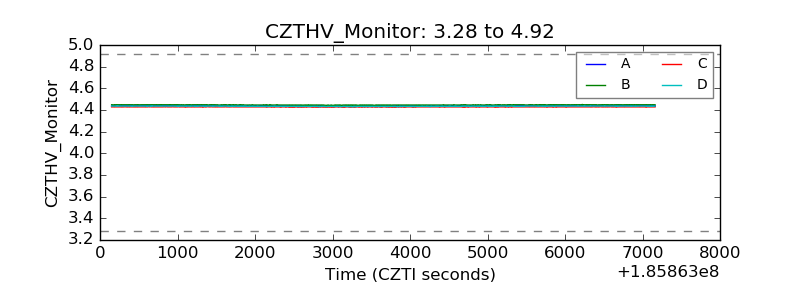 |
| D_VDD | 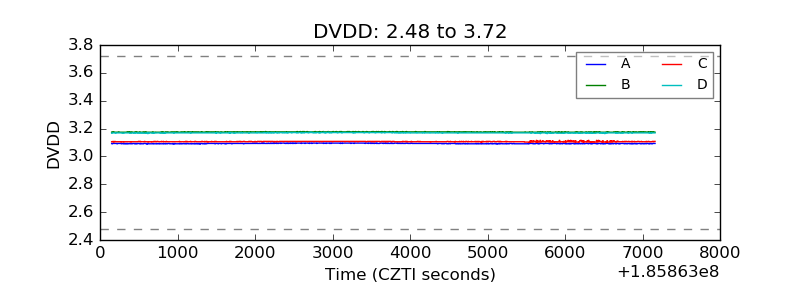 |
| Temperature 1 | 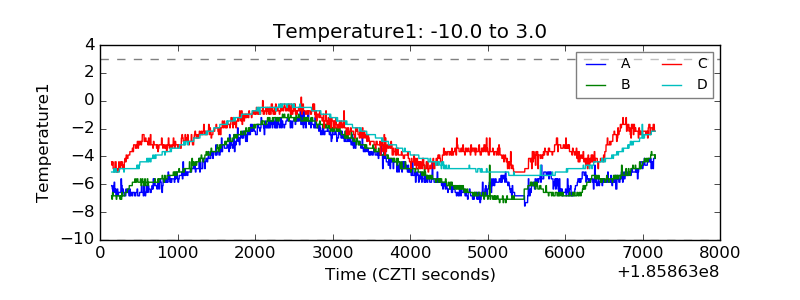 |
| Veto HV Monitor | 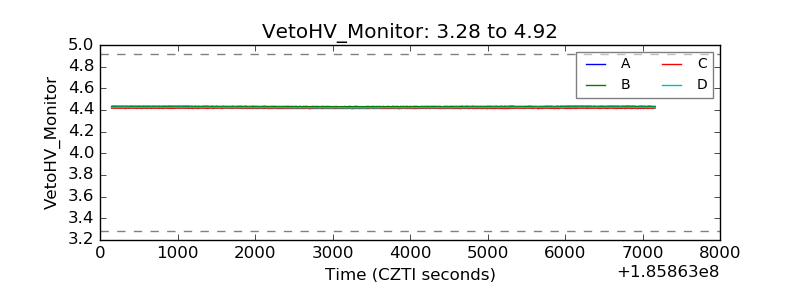 |
| Veto LLD | 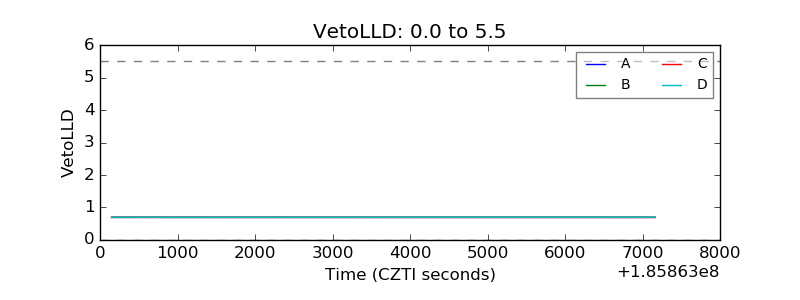 |
| Alpha Counter | 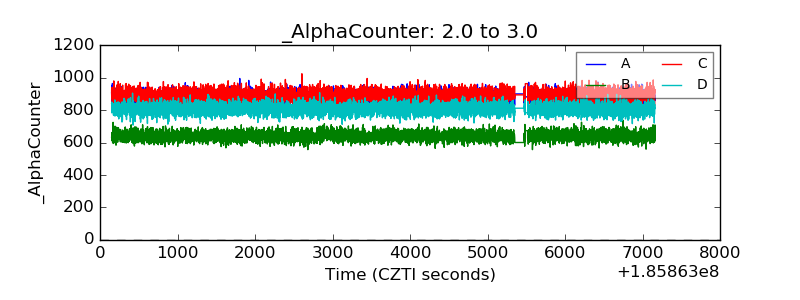 |
| _CPM_Rate | 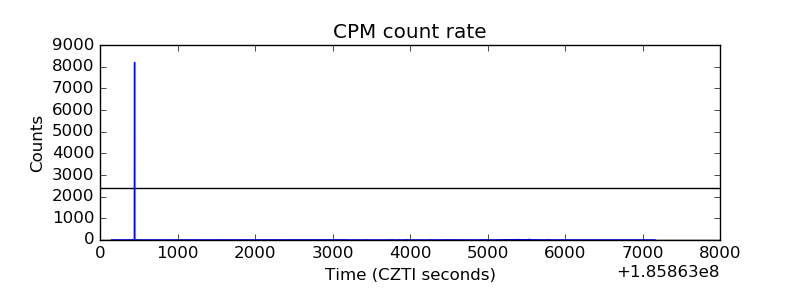 |
| CZT Counter | 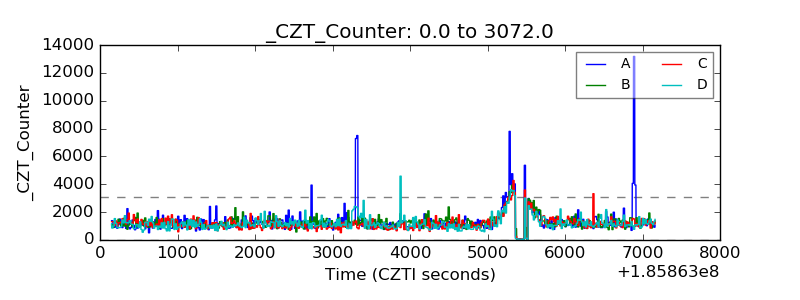 |
| +2.5 Volts monitor | 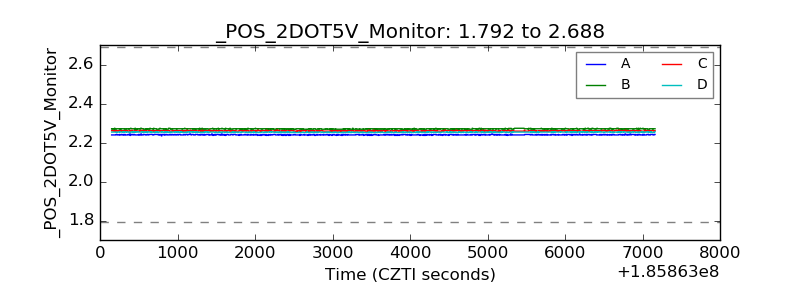 |
| +5 Volts monitor |  |
| _ROLL_ROT | 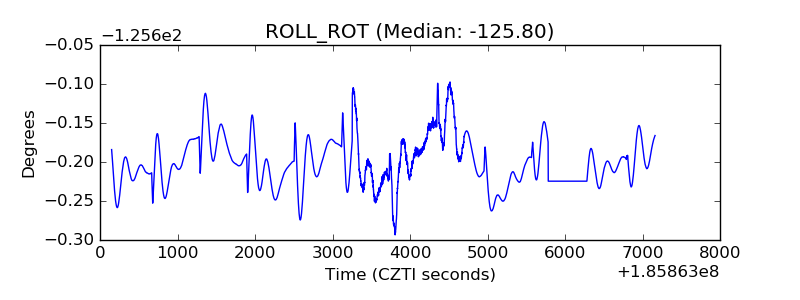 |
| _Roll_DEC | 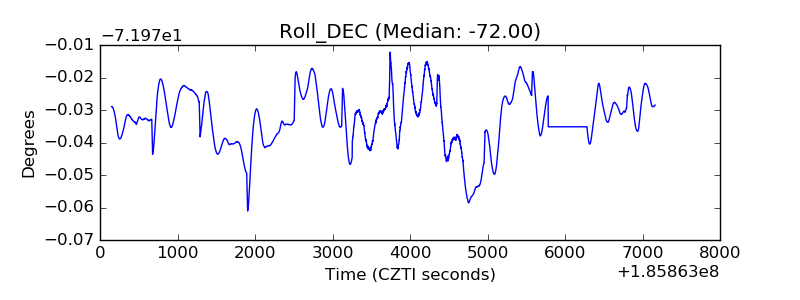 |
| _Roll_RA | 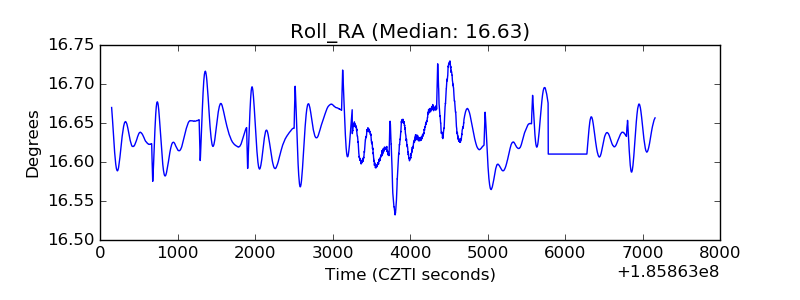 |
| Veto Counter | 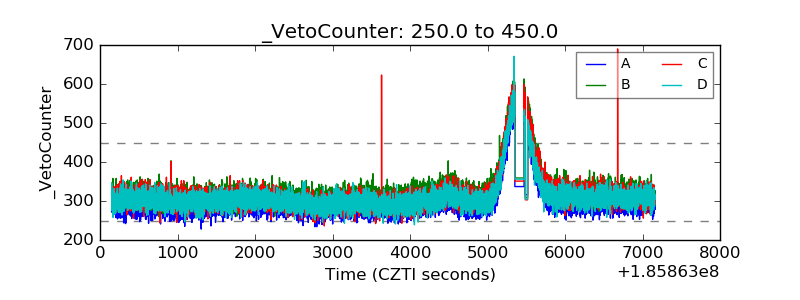 |