| Param | Original file | Final file |
|---|---|---|
| Filename | modeM0/AS1P01_010T01_9000000112_00818cztM0_level2.evt | modeM0/AS1P01_010T01_9000000112_00818cztM0_level2_quad_clean.evt |
| Size (bytes) | 272,828,160 | 24,289,920 |
| Size | 260.2 MB | 23.2 MB |
| Events in quadrant A | 2,170,638 | 152,188 |
| Events in quadrant B | 2,033,862 | 155,734 |
| Events in quadrant C | 1,977,901 | 155,587 |
| Events in quadrant D | 1,968,256 | 150,234 |
| Mode M0 | |||
|---|---|---|---|
| Quadrant | BADHDUFLAG | Total packets | Discarded packets |
| A | 0 | 7611 | 0 |
| B | 0 | 7218 | 0 |
| C | 0 | 7043 | 0 |
| D | 0 | 7032 | 0 |
| Mode SS | |||
|---|---|---|---|
| Quadrant | BADHDUFLAG | Total packets | Discarded packets |
| A | 0 | 32 | 0 |
| B | 0 | 32 | 0 |
| C | 0 | 32 | 0 |
| D | 0 | 32 | 0 |
| Quadrant | Total seconds | Saturated seconds | Saturation percentage |
|---|---|---|---|
| A | 1652 | 1 | 0.060533% |
| B | 1652 | 1 | 0.060533% |
| C | 1652 | 0 | 0.000000% |
| D | 1653 | 5 | 0.302480% |
Noise dominated data is calculated using 1-second bins in cleaned event files. If a bin has >2000 counts, and if more than 50% of those come from <1% of pixels, then it is considered to be noise-dominated and hence unusable.
| Quadrant | # 1 sec bins | Bins with >0 counts | Bins with >2000 counts | High rate bins dominated by noise | Noise dominated (total time) | Noise dominated (detector-on time) | Marked lightcurve |
|---|---|---|---|---|---|---|---|
| A | 1652 | 1652 | 51 | 51 | 3.09% | 3.09% | 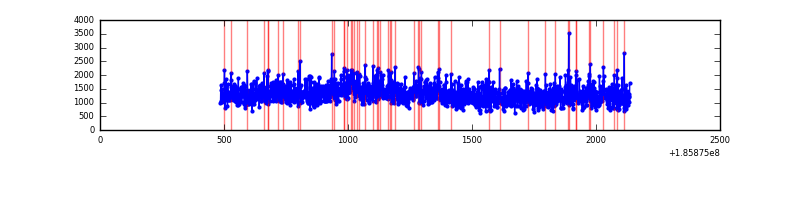 |
| B | 1652 | 1652 | 20 | 20 | 1.21% | 1.21% | 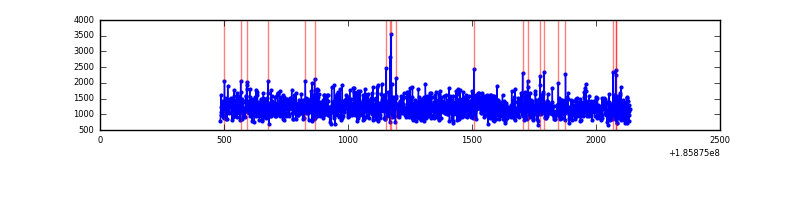 |
| C | 1652 | 1652 | 20 | 20 | 1.21% | 1.21% | 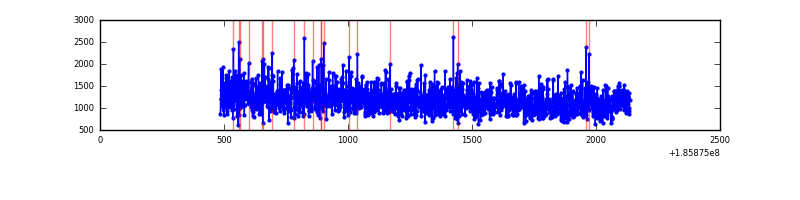 |
| D | 1653 | 1653 | 33 | 33 | 2.00% | 2.00% | 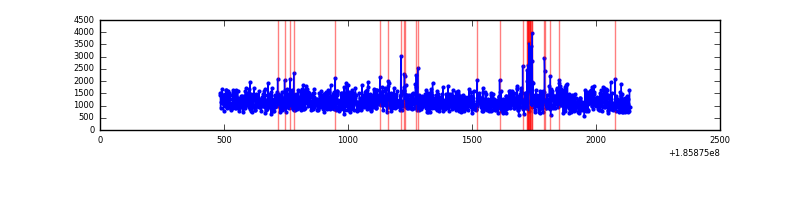 |
Top three noisy pixels from each quadrant. If the there are fewer than three noisy pixels in the level2.evt file, extra rows are filled as -1
| Pixel properties | Quadrant properties | ||||||
|---|---|---|---|---|---|---|---|
| Quadrant | DetID | PixID | Counts | Sigma | Mean | Median | Sigma |
| A | 15 | 233 | 171043 | 1332.14 | 521 | 525 | 128.0 |
| A | 3 | 111 | 1533 | 7.87 | 521 | 525 | 128.0 |
| A | 11 | 79 | 1526 | 7.82 | 521 | 525 | 128.0 |
| B | 0 | 220 | 16523 | 128.73 | 520 | 525 | 124.3 |
| B | 2 | 2 | 15100 | 117.28 | 520 | 525 | 124.3 |
| B | 0 | 245 | 10668 | 81.62 | 520 | 525 | 124.3 |
| C | 15 | 241 | 41678 | 297.4 | 490 | 508 | 138.4 |
| C | 3 | 111 | 10493 | 72.13 | 490 | 508 | 138.4 |
| C | 3 | 79 | 9033 | 61.58 | 490 | 508 | 138.4 |
| D | 13 | 200 | 46146 | 293.92 | 499 | 516 | 155.2 |
| D | 10 | 157 | 13666 | 84.7 | 499 | 516 | 155.2 |
| D | 13 | 37 | 11044 | 67.81 | 499 | 516 | 155.2 |
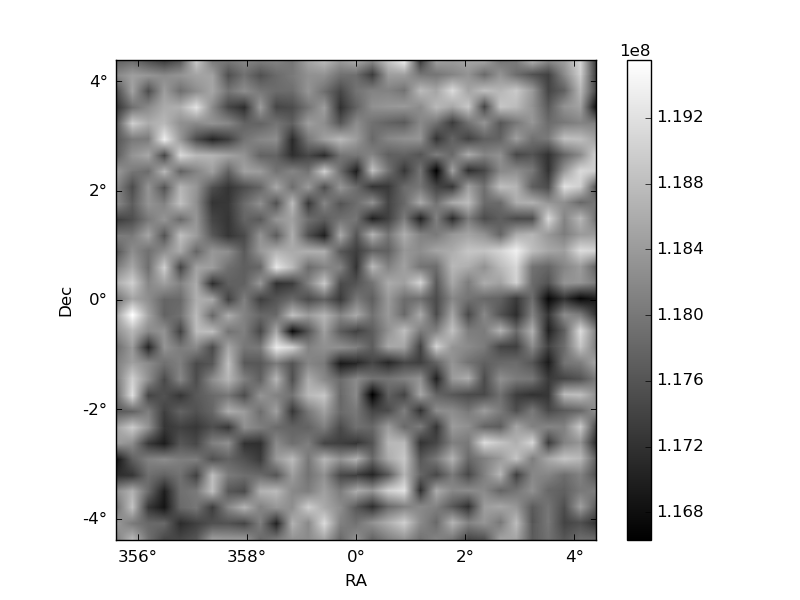
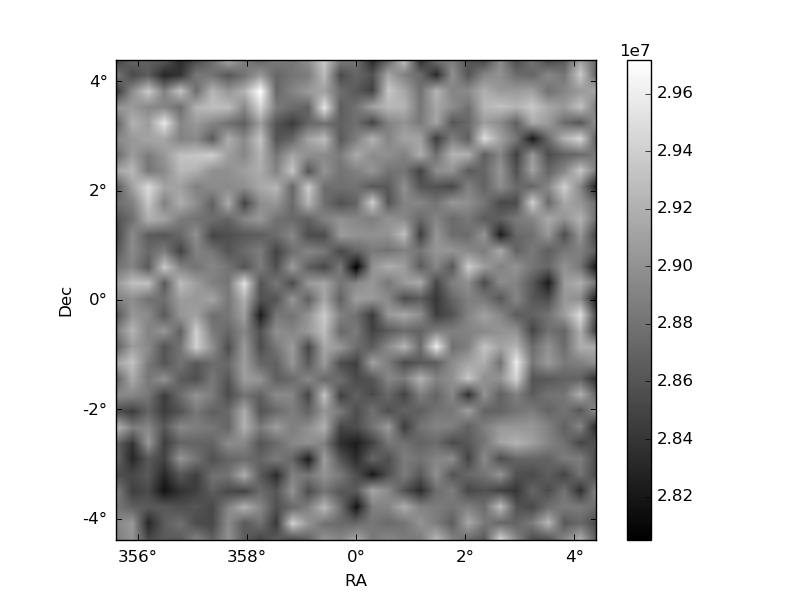
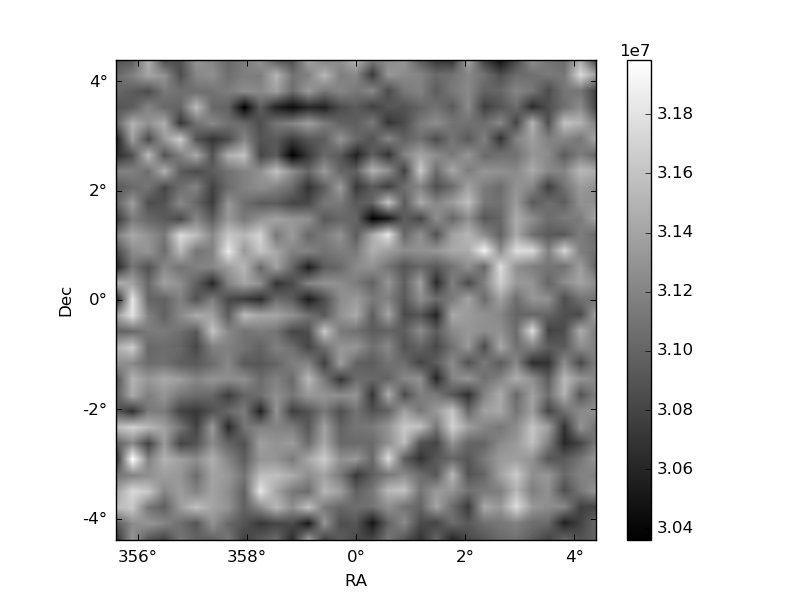
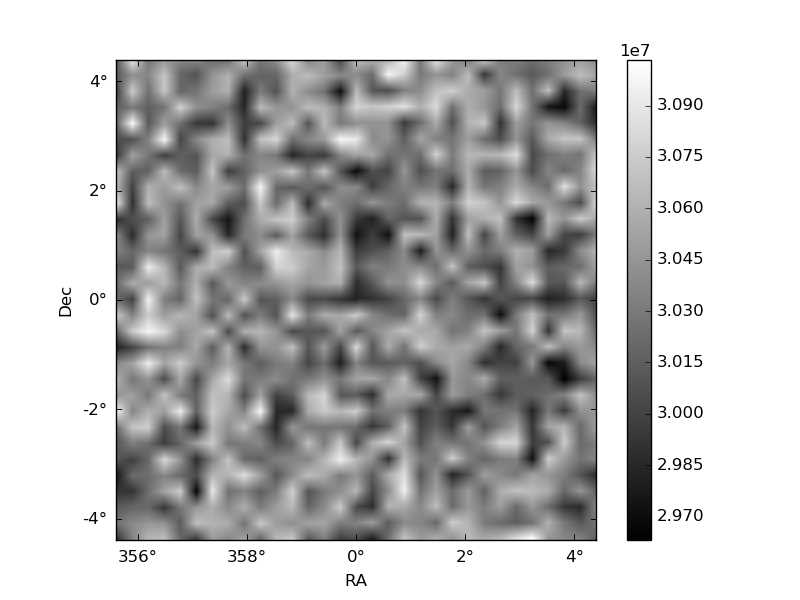
Histogram calculated using DETX and DETY for each event in the final _common_clean file
| Quadrant A | 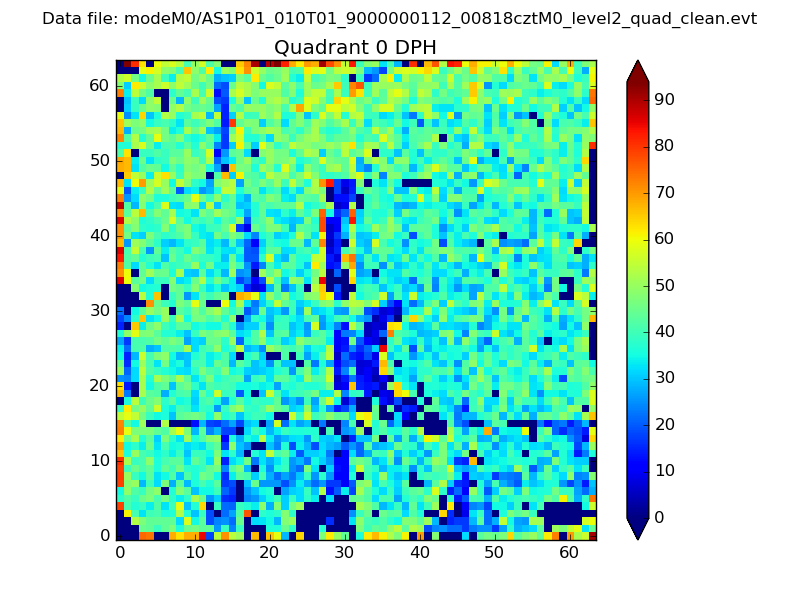 |
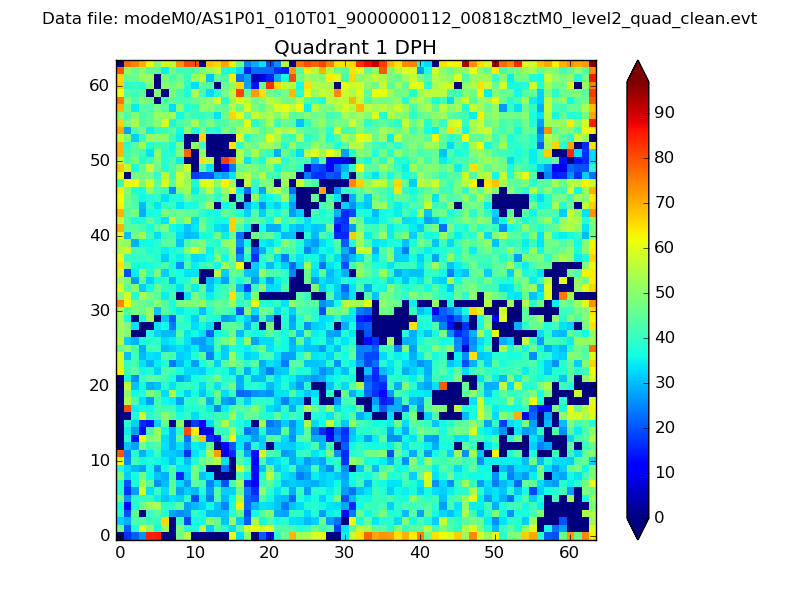 |
Quadrant B |
|---|---|---|---|
| Quadrant D | 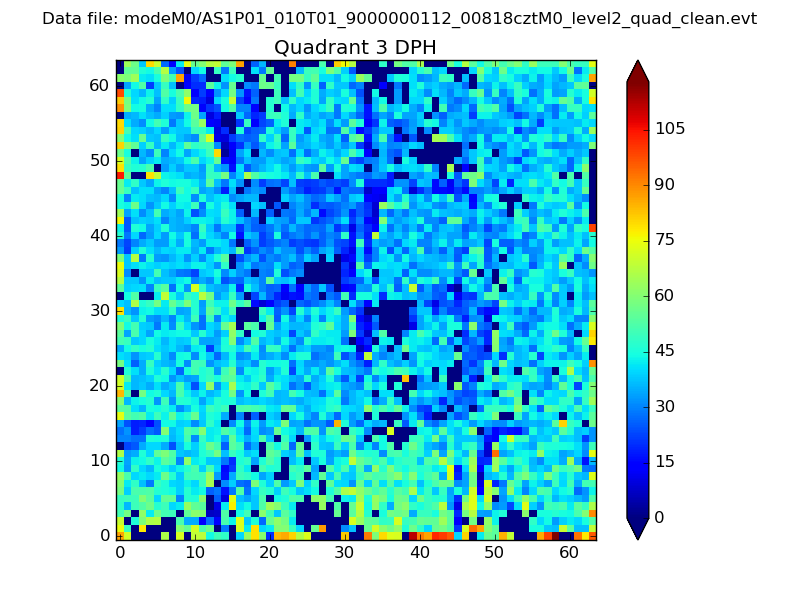 |
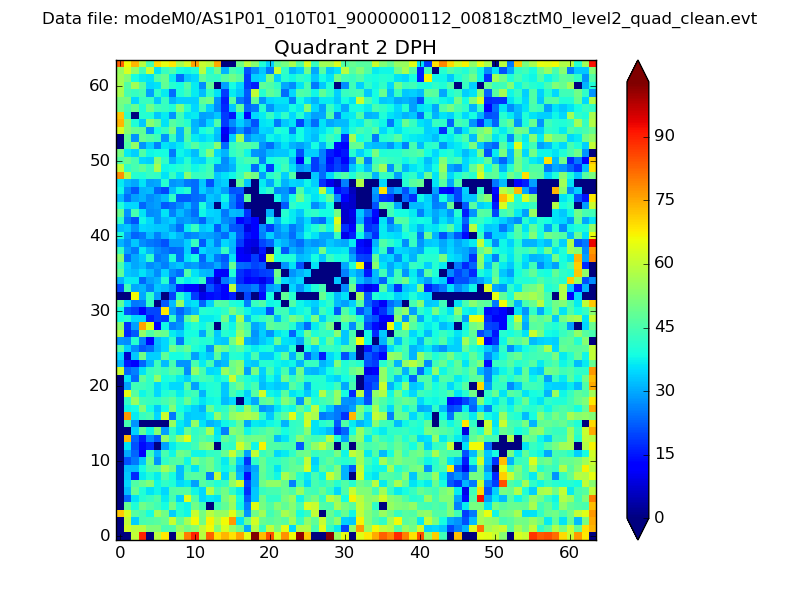 |
Quadrant C |
| Plot type | Count rate plots | Images |
|---|---|---|
| Comparison with Poisson distribution Blue bars denote a histogram of data divided into 1 sec bins. Red curve is a Poisson curve with rate = median count rate of data. |
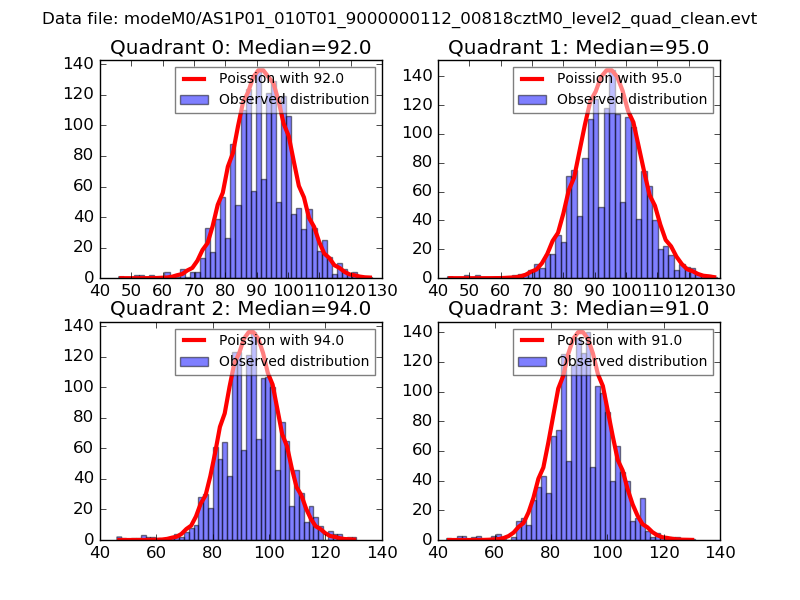 |
 |
| Quadrant-wise count rates Data is divided into 100 sec bins |
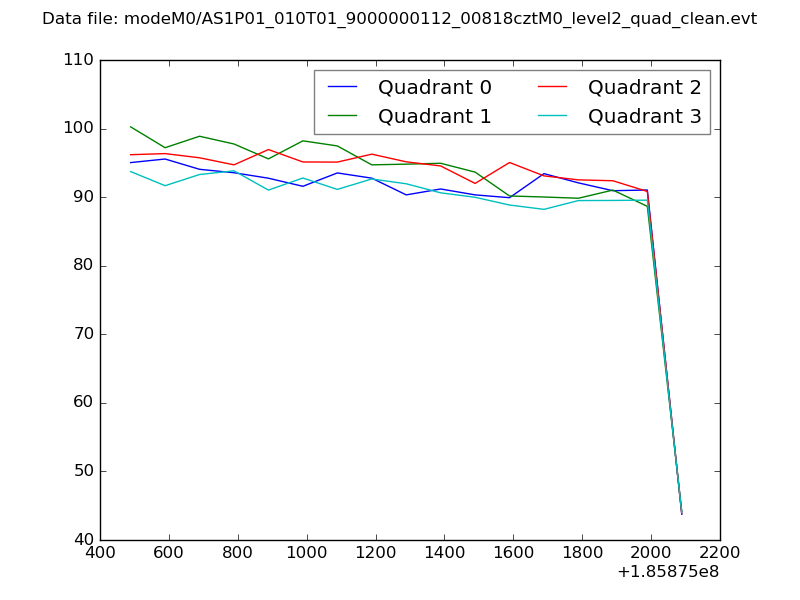 |
|
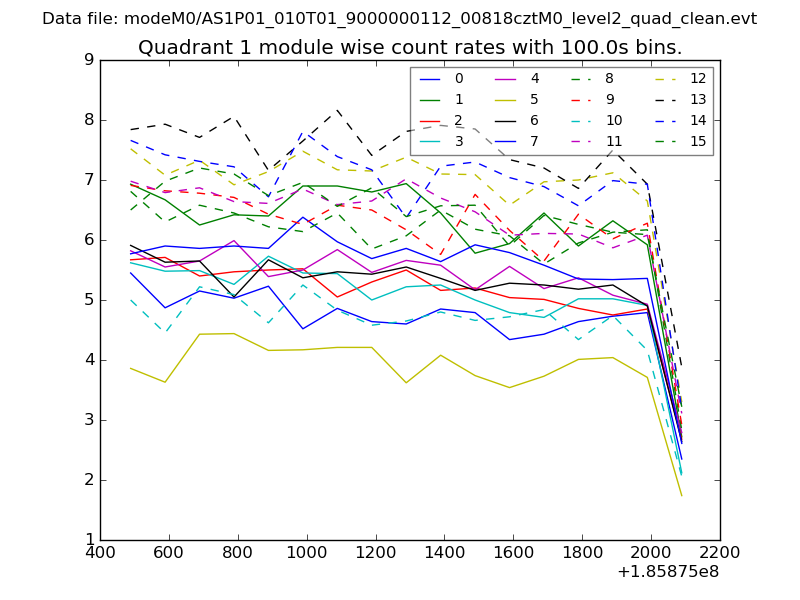
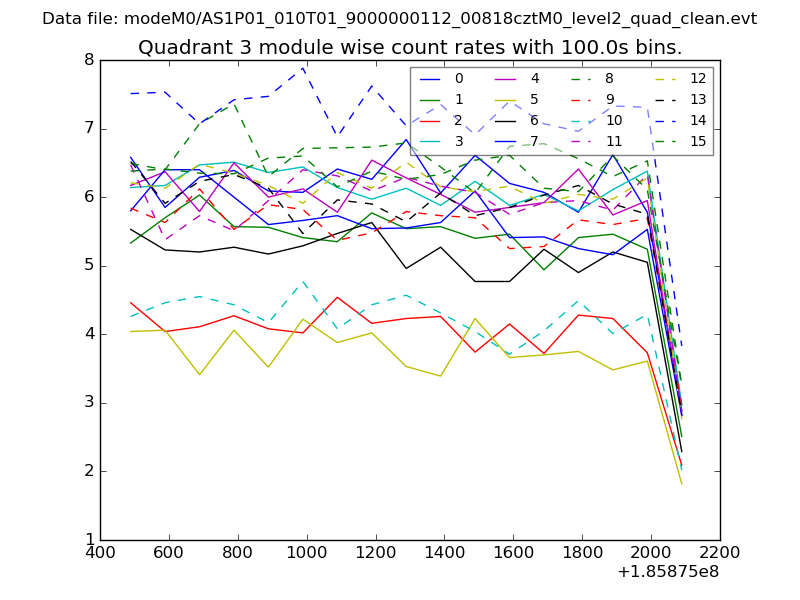
| Module-wise count rates for Quadrant A Data is divided into 100 sec bins |
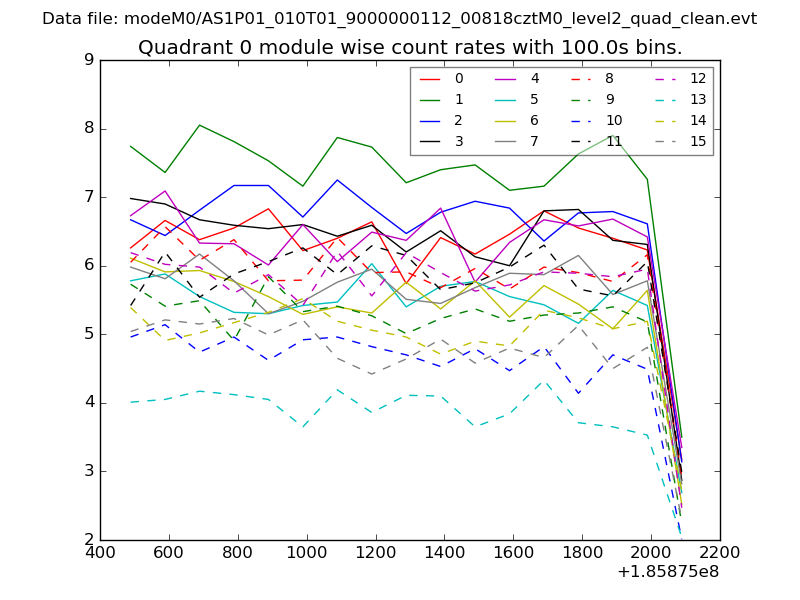 |
 |
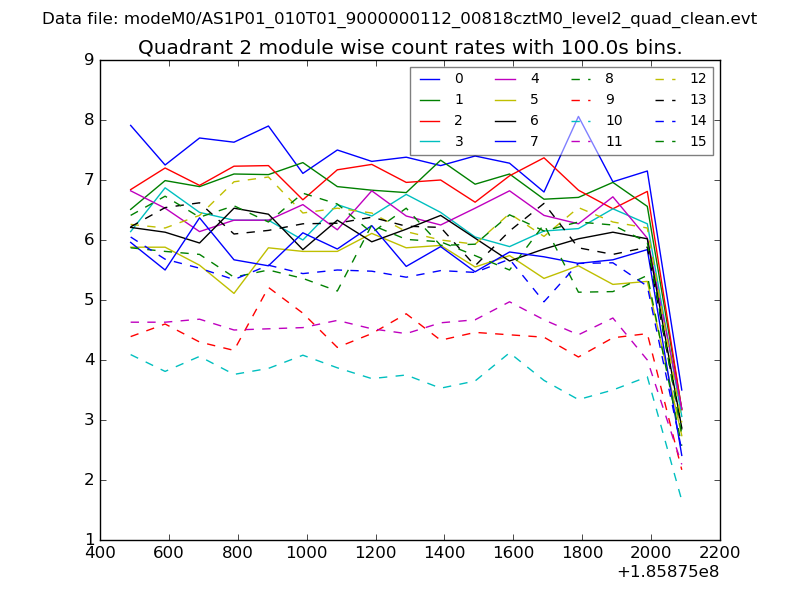
| Module-wise count rates for Quadrant B Data is divided into 100 sec bins |
 |
 |
| Module-wise count rates for Quadrant C Data is divided into 100 sec bins |
 |
 |
| Module-wise count rates for Quadrant D Data is divided into 100 sec bins |
 |
 |
| Parameter | Plot |
|---|---|
| CZT HV Monitor | 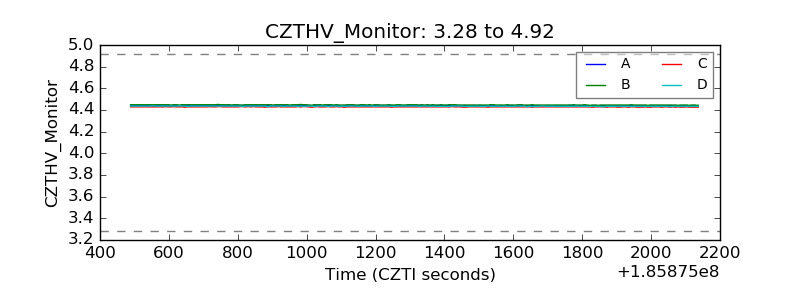 |
| D_VDD |  |
| Temperature 1 | 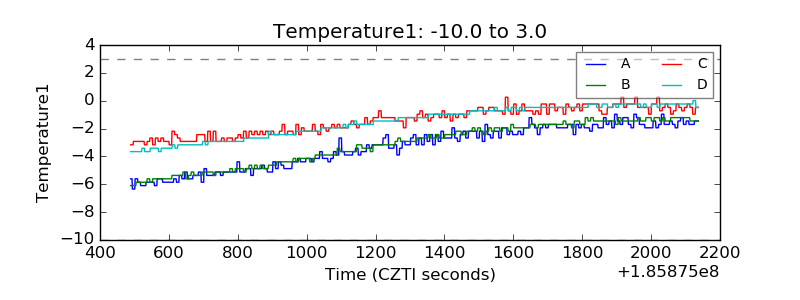 |
| Veto HV Monitor | 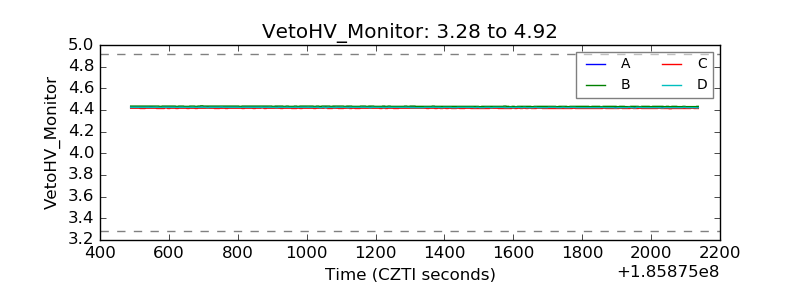 |
| Veto LLD | 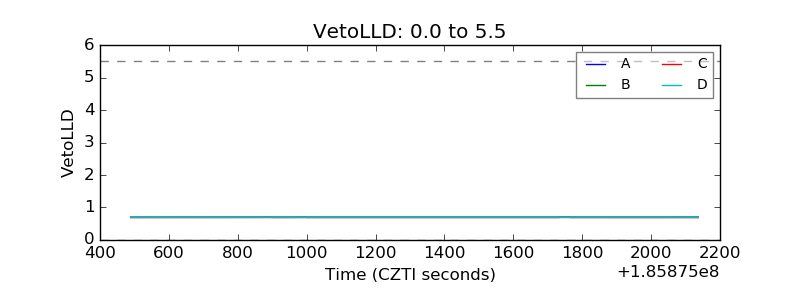 |
| Alpha Counter |  |
| _CPM_Rate |  |
| CZT Counter | 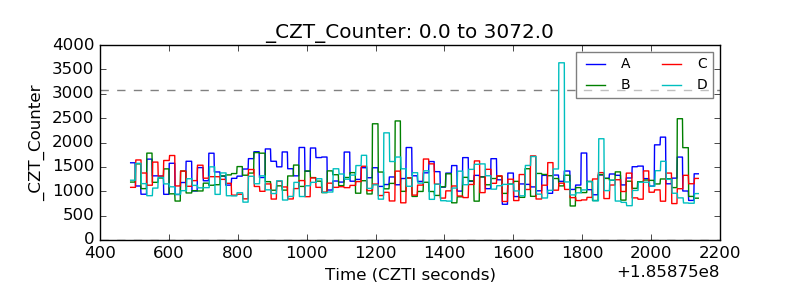 |
| +2.5 Volts monitor |  |
| +5 Volts monitor |  |
| _ROLL_ROT | 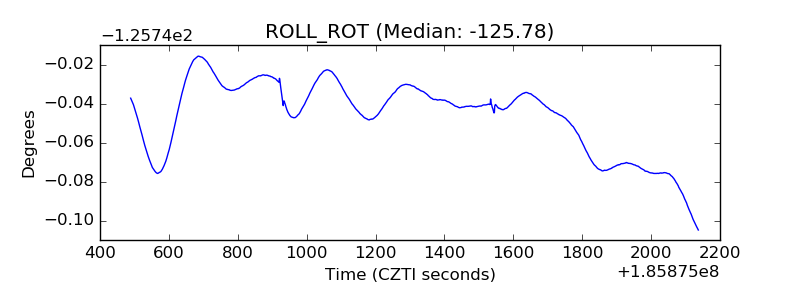 |
| _Roll_DEC | 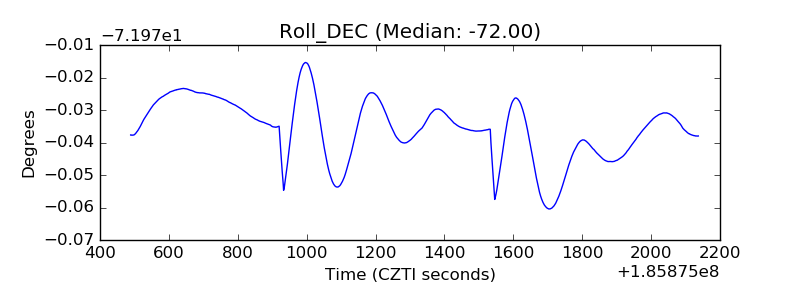 |
| _Roll_RA | 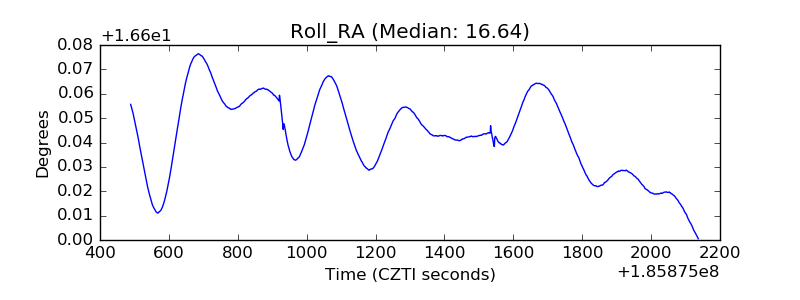 |
| Veto Counter | 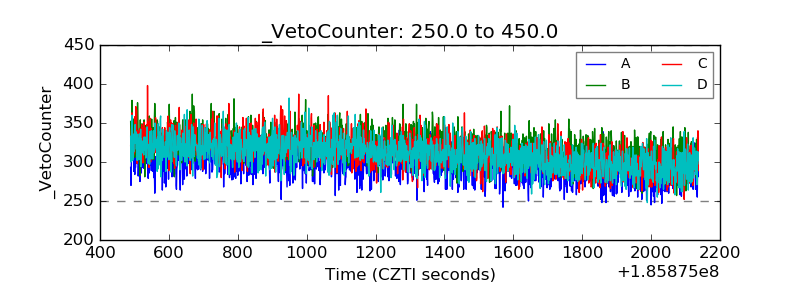 |