| Param | Original file | Final file |
|---|---|---|
| Filename | modeM0/AS1P01_010T01_9000000112_00819cztM0_level2.evt | modeM0/AS1P01_010T01_9000000112_00819cztM0_level2_quad_clean.evt |
| Size (bytes) | 1,736,470,080 | 161,789,760 |
| Size | 1.6 GB | 154.3 MB |
| Events in quadrant A | 13,154,055 | 1,044,764 |
| Events in quadrant B | 13,704,118 | 1,045,810 |
| Events in quadrant C | 12,879,459 | 1,035,451 |
| Events in quadrant D | 12,128,845 | 1,017,559 |
| Mode M9 | |||
|---|---|---|---|
| Quadrant | BADHDUFLAG | Total packets | Discarded packets |
| A | 0 | 14 | 0 |
| B | 0 | 14 | 0 |
| C | 0 | 14 | 0 |
| D | 0 | 14 | 0 |
| Mode M0 | |||
|---|---|---|---|
| Quadrant | BADHDUFLAG | Total packets | Discarded packets |
| A | 0 | 46889 | 0 |
| B | 0 | 48463 | 0 |
| C | 0 | 46033 | 0 |
| D | 0 | 43881 | 0 |
| Mode SS | |||
|---|---|---|---|
| Quadrant | BADHDUFLAG | Total packets | Discarded packets |
| A | 0 | 226 | 0 |
| B | 0 | 226 | 0 |
| C | 0 | 226 | 0 |
| D | 0 | 226 | 0 |
| Quadrant | Total seconds | Saturated seconds | Saturation percentage |
|---|---|---|---|
| A | 10915 | 98 | 0.897847% |
| B | 10915 | 105 | 0.961979% |
| C | 10915 | 111 | 1.016949% |
| D | 10915 | 98 | 0.897847% |
Noise dominated data is calculated using 1-second bins in cleaned event files. If a bin has >2000 counts, and if more than 50% of those come from <1% of pixels, then it is considered to be noise-dominated and hence unusable.
| Quadrant | # 1 sec bins | Bins with >0 counts | Bins with >2000 counts | High rate bins dominated by noise | Noise dominated (total time) | Noise dominated (detector-on time) | Marked lightcurve |
|---|---|---|---|---|---|---|---|
| A | 12415 | 10915 | 386 | 386 | 3.11% | 3.54% | 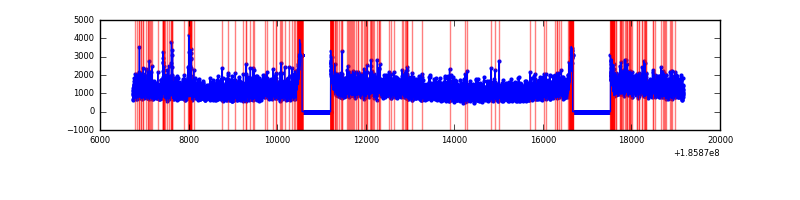 |
| B | 12415 | 10915 | 416 | 416 | 3.35% | 3.81% | 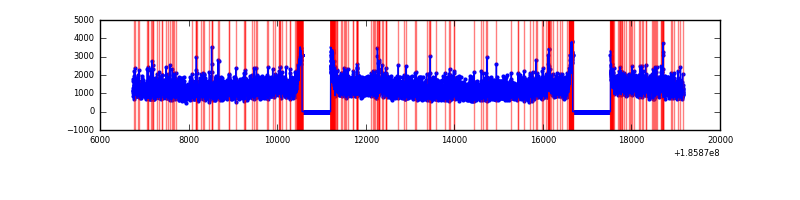 |
| C | 12415 | 10915 | 411 | 411 | 3.31% | 3.77% | 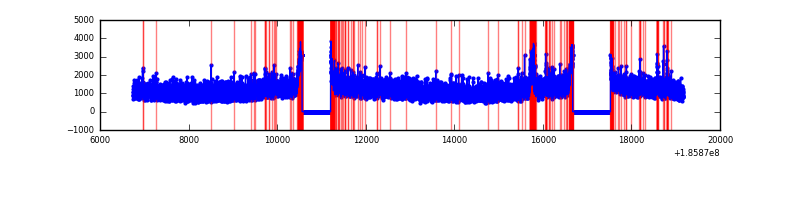 |
| D | 12415 | 10915 | 309 | 309 | 2.49% | 2.83% |  |
Top three noisy pixels from each quadrant. If the there are fewer than three noisy pixels in the level2.evt file, extra rows are filled as -1
| Pixel properties | Quadrant properties | ||||||
|---|---|---|---|---|---|---|---|
| Quadrant | DetID | PixID | Counts | Sigma | Mean | Median | Sigma |
| A | 15 | 233 | 247849 | 297.75 | 3362 | 3377 | 821.1 |
| A | 11 | 79 | 14542 | 13.6 | 3362 | 3377 | 821.1 |
| A | 3 | 111 | 9722 | 7.73 | 3362 | 3377 | 821.1 |
| B | 0 | 220 | 104634 | 122.81 | 3502 | 3519 | 823.4 |
| B | 2 | 2 | 48402 | 54.51 | 3502 | 3519 | 823.4 |
| B | 15 | 255 | 47901 | 53.9 | 3502 | 3519 | 823.4 |
| C | 15 | 241 | 223270 | 250.3 | 3139 | 3245 | 879.0 |
| C | 9 | 52 | 220462 | 247.11 | 3139 | 3245 | 879.0 |
| C | 3 | 79 | 69943 | 75.88 | 3139 | 3245 | 879.0 |
| D | 13 | 200 | 147846 | 152.68 | 3066 | 3187 | 947.5 |
| D | 13 | 169 | 98094 | 100.17 | 3066 | 3187 | 947.5 |
| D | 1 | 4 | 96411 | 98.39 | 3066 | 3187 | 947.5 |
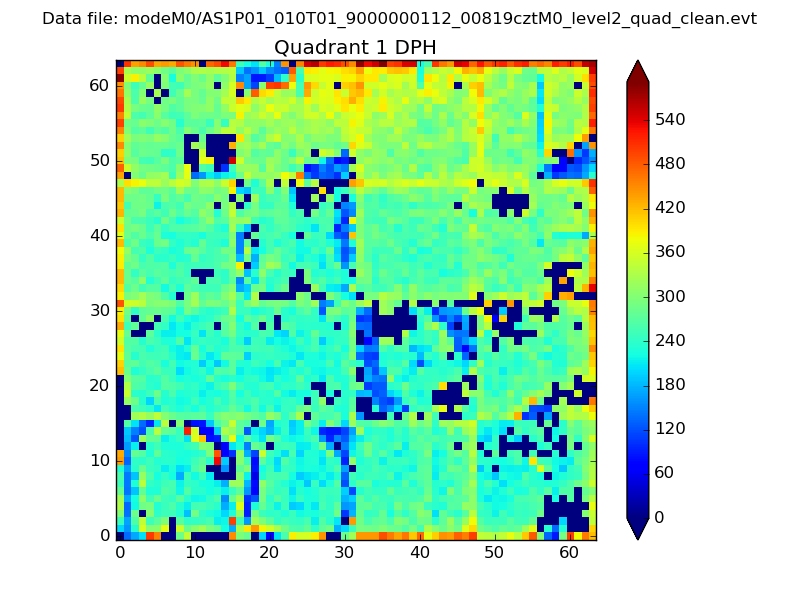
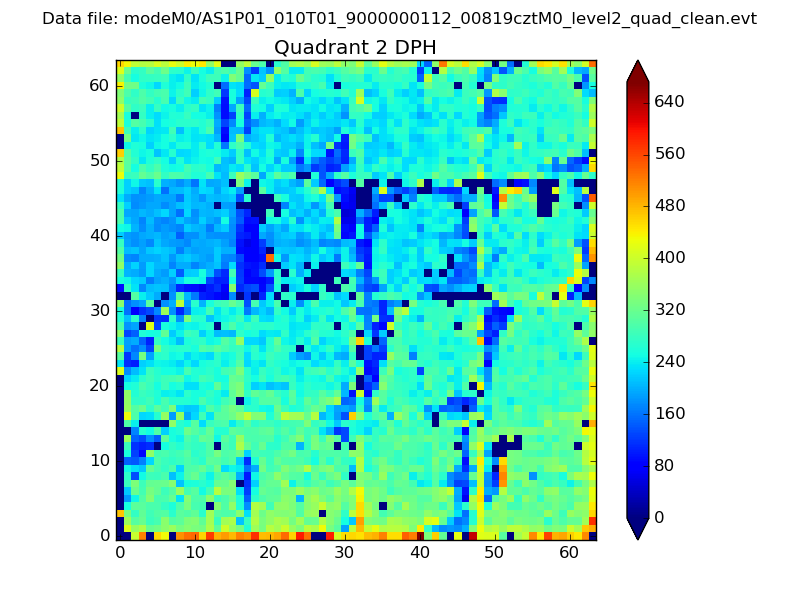
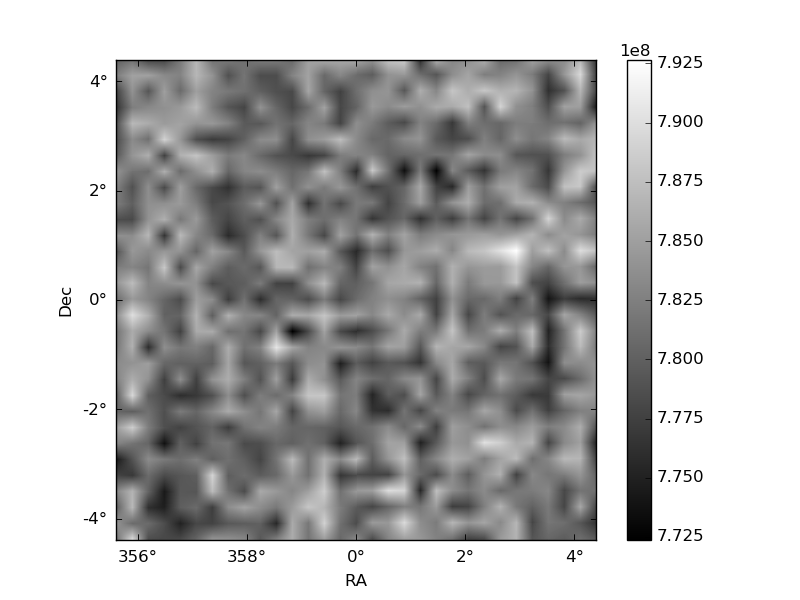
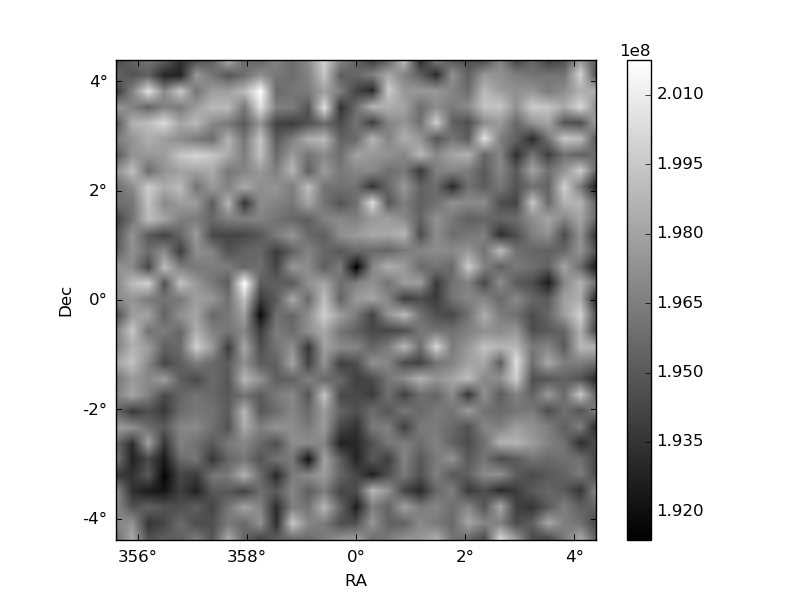
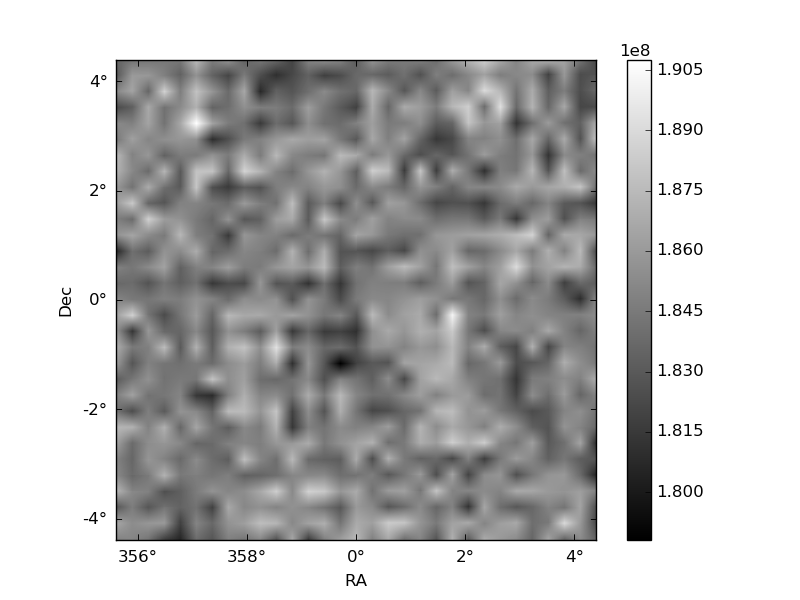
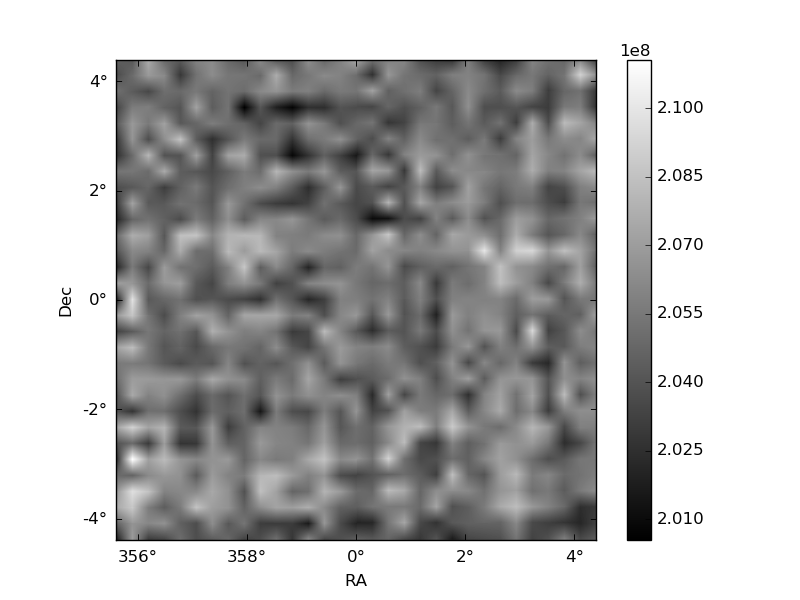
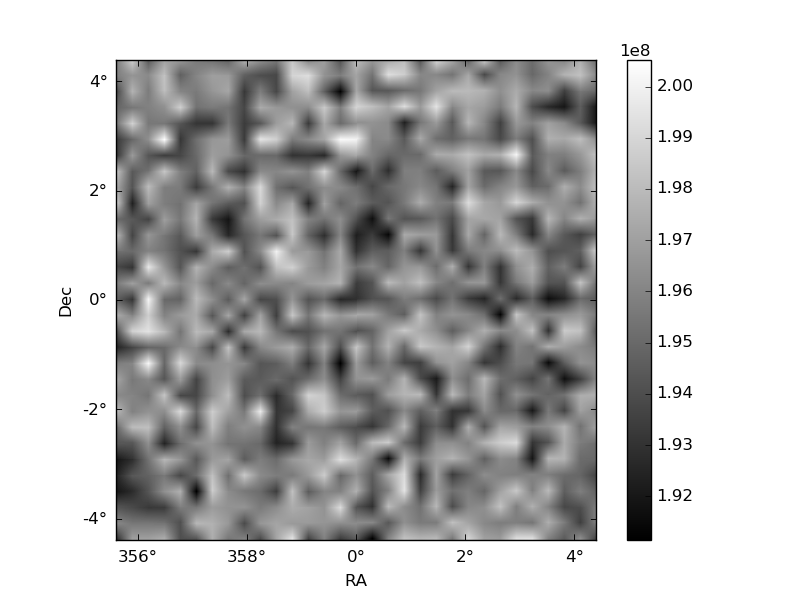
Histogram calculated using DETX and DETY for each event in the final _common_clean file
| Quadrant A | 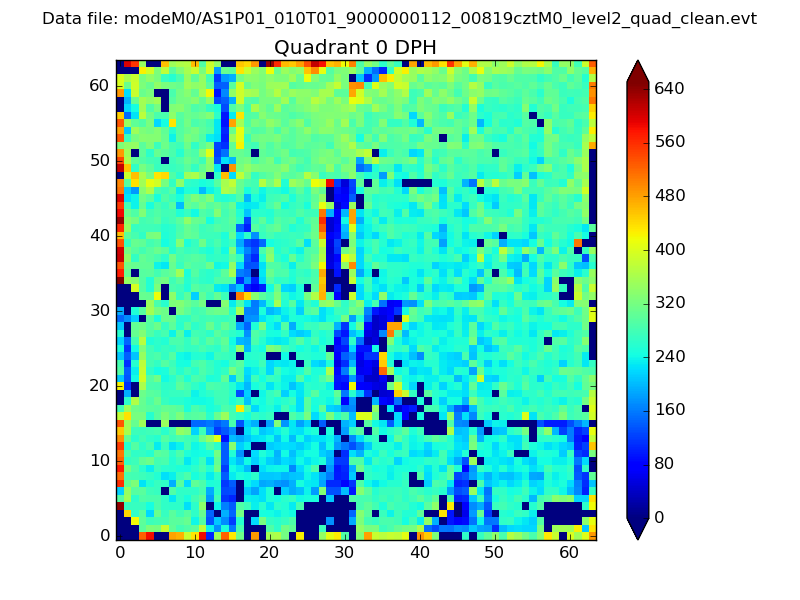 |
 |
Quadrant B |
|---|---|---|---|
| Quadrant D | 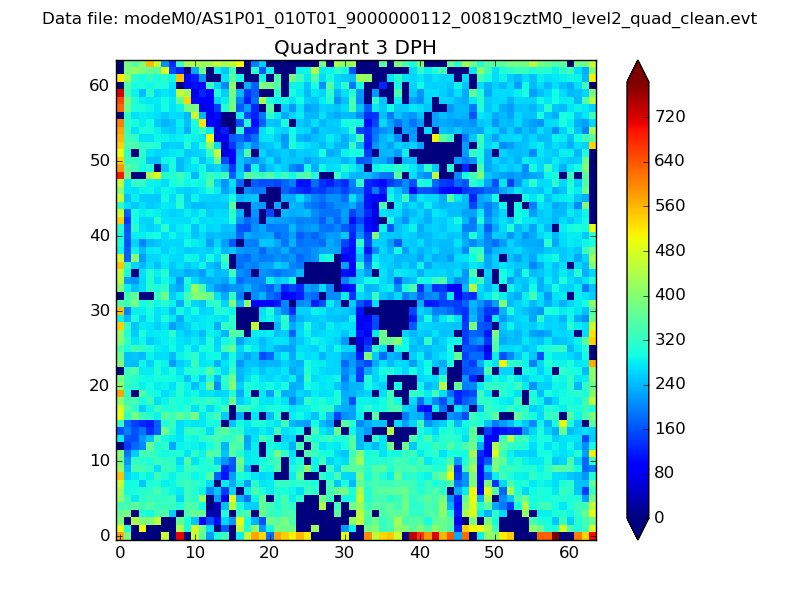 |
 |
Quadrant C |
| Plot type | Count rate plots | Images |
|---|---|---|
| Comparison with Poisson distribution Blue bars denote a histogram of data divided into 1 sec bins. Red curve is a Poisson curve with rate = median count rate of data. |
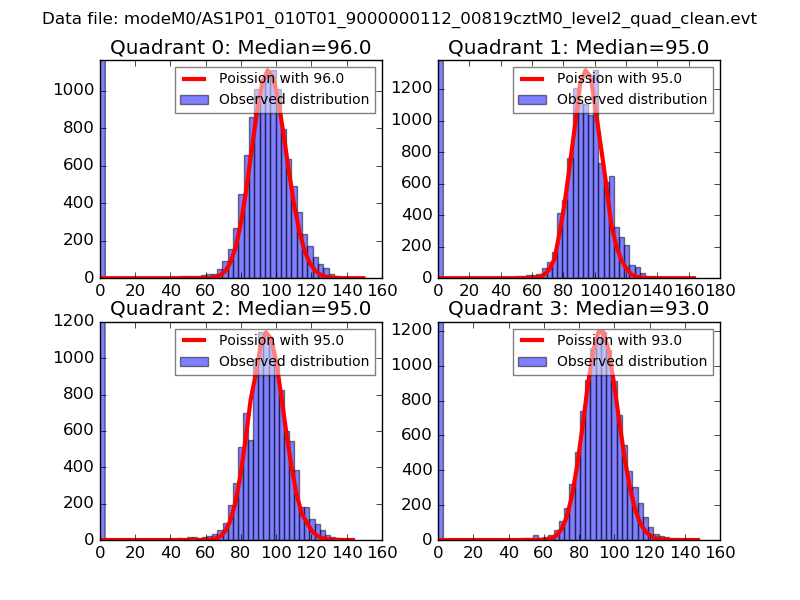 |
 |
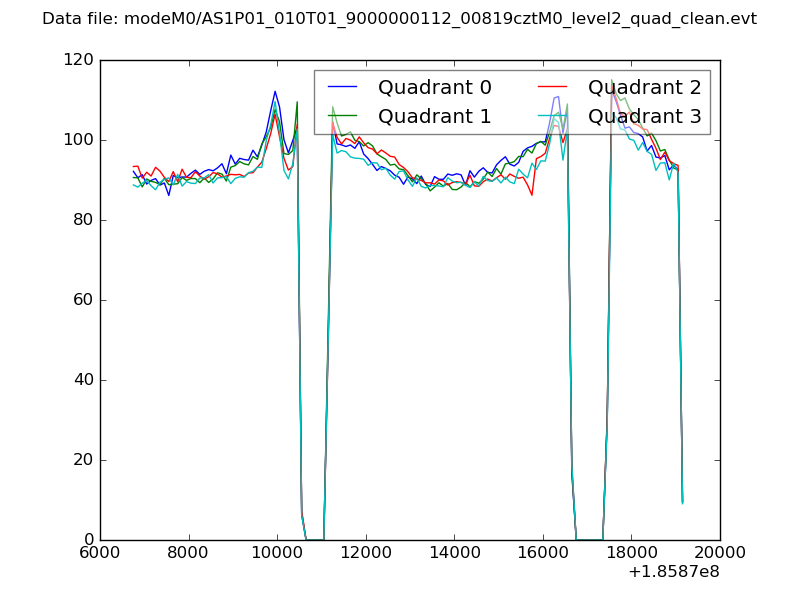
| Quadrant-wise count rates Data is divided into 100 sec bins |
 |
|
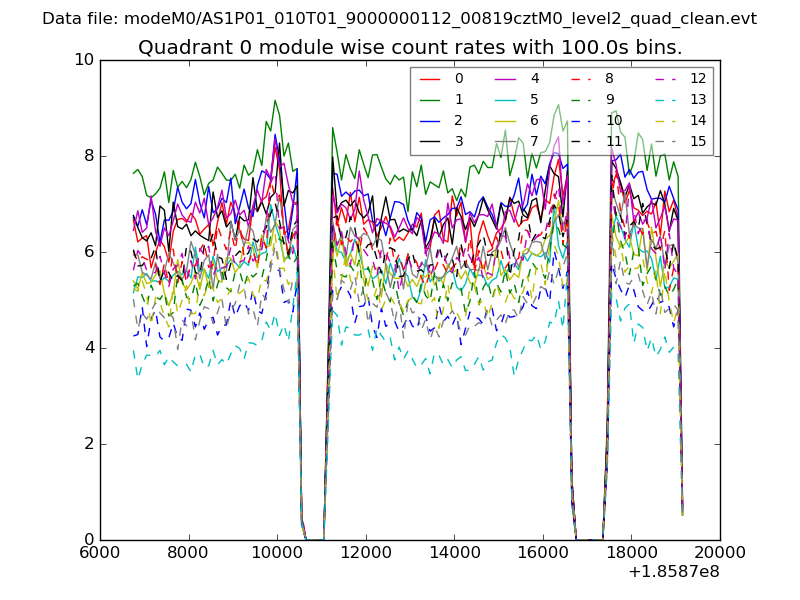
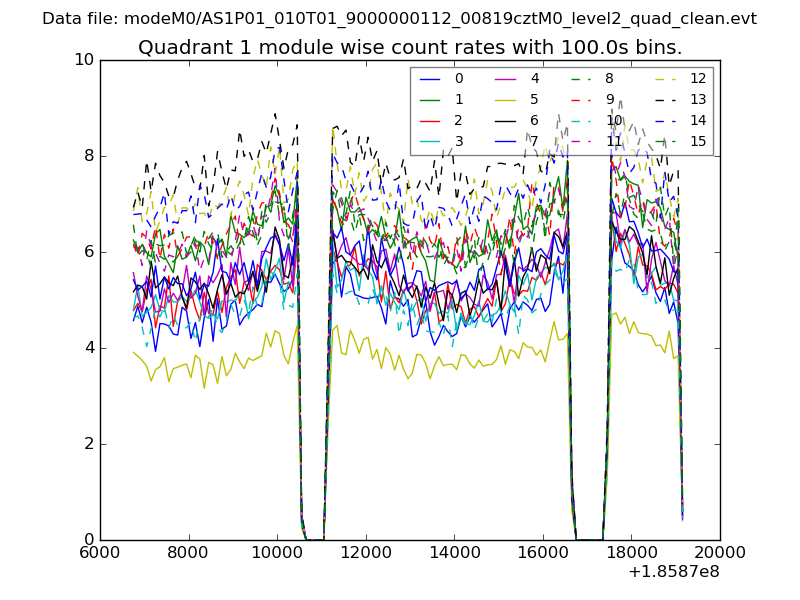
| Module-wise count rates for Quadrant A Data is divided into 100 sec bins |
 |
 |
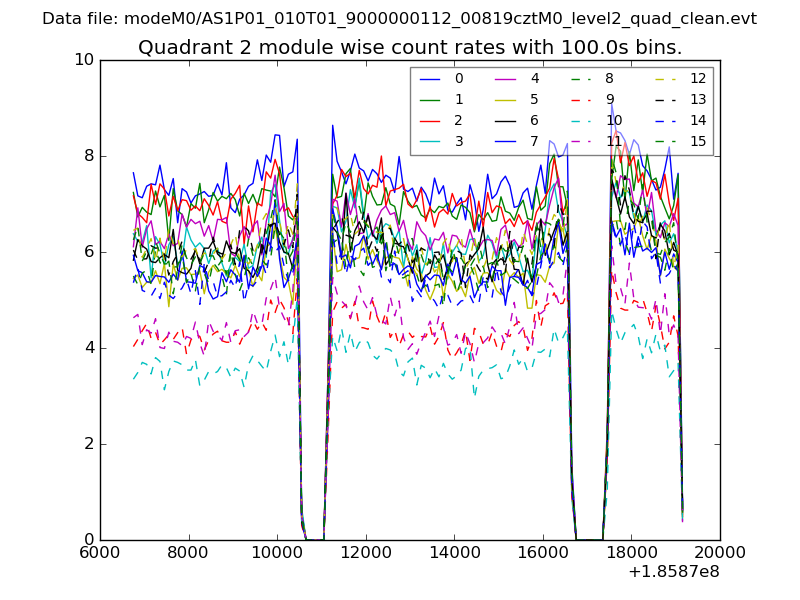
| Module-wise count rates for Quadrant B Data is divided into 100 sec bins |
 |
 |
| Module-wise count rates for Quadrant C Data is divided into 100 sec bins |
 |
 |
| Module-wise count rates for Quadrant D Data is divided into 100 sec bins |
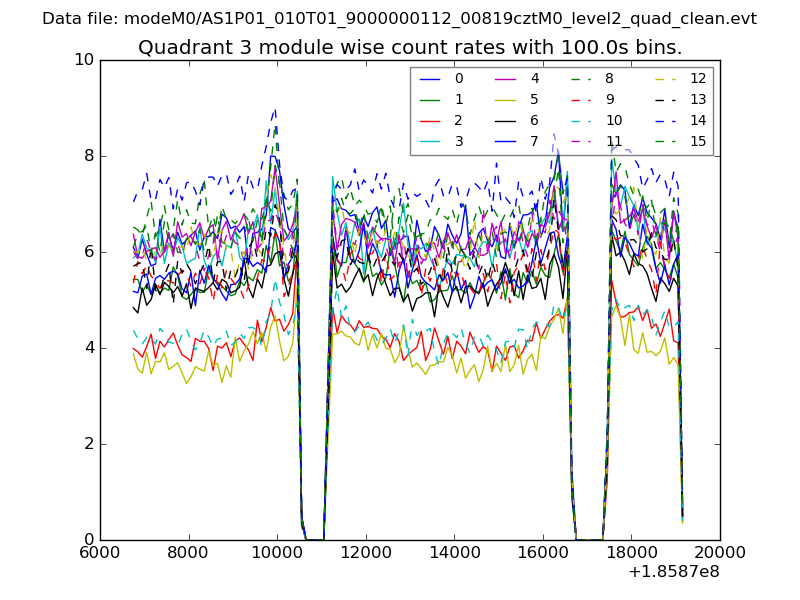 |
 |
| Parameter | Plot |
|---|---|
| CZT HV Monitor | 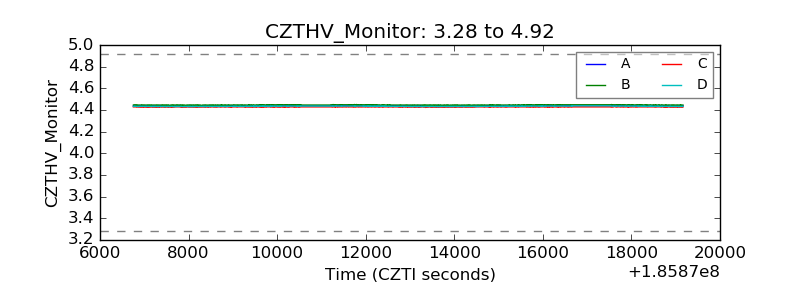 |
| D_VDD | 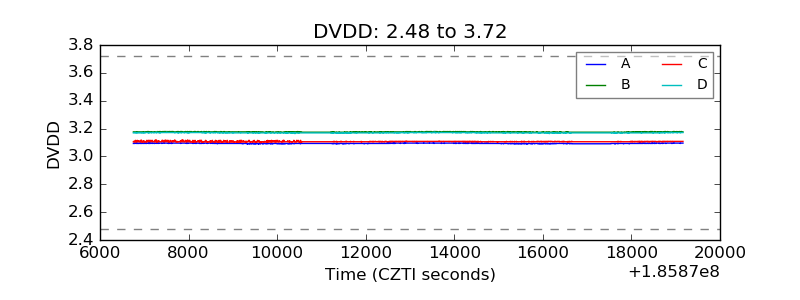 |
| Temperature 1 | 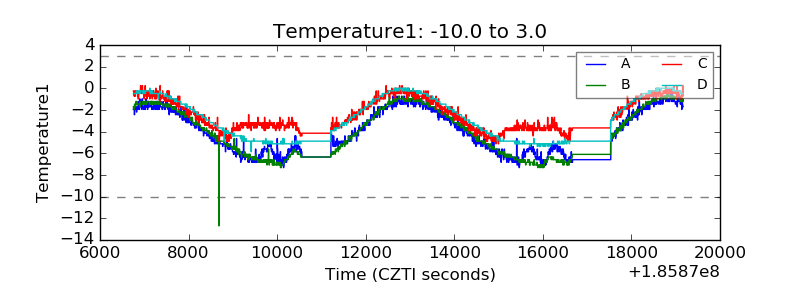 |
| Veto HV Monitor | 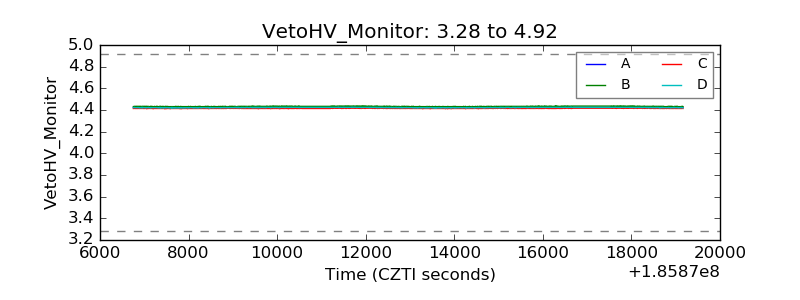 |
| Veto LLD | 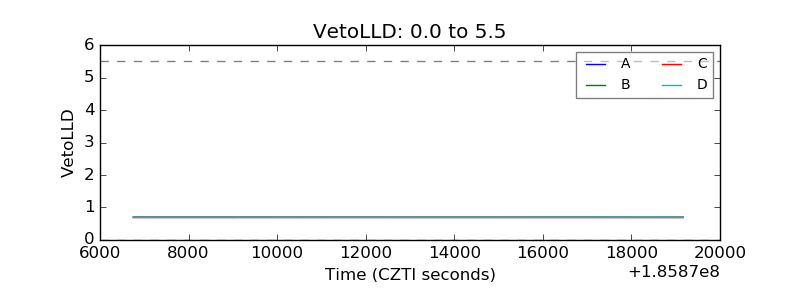 |
| Alpha Counter | 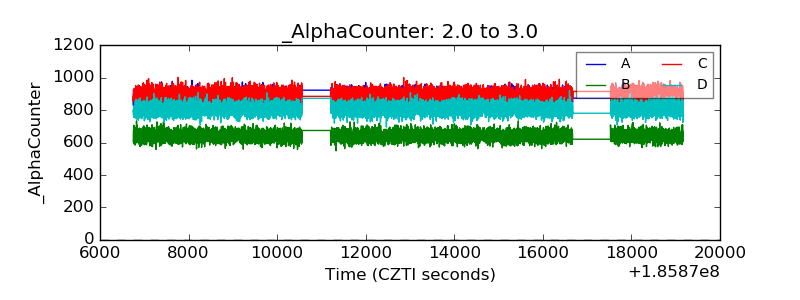 |
| _CPM_Rate | 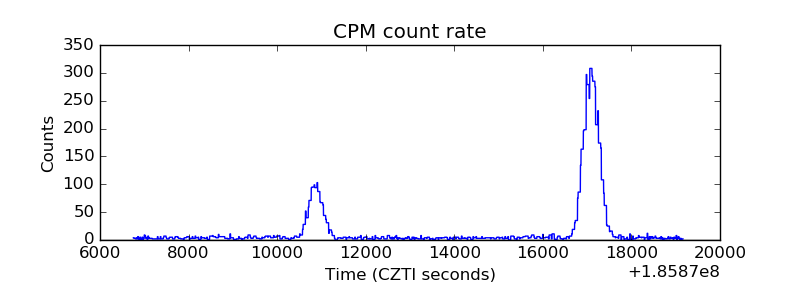 |
| CZT Counter | 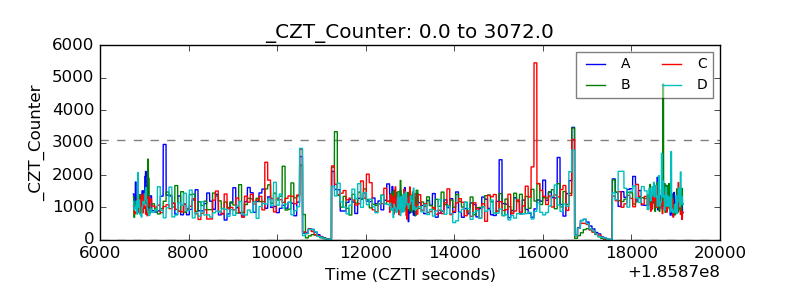 |
| +2.5 Volts monitor | 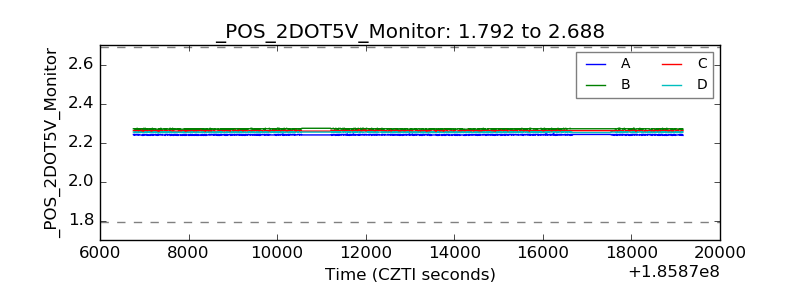 |
| +5 Volts monitor |  |
| _ROLL_ROT | 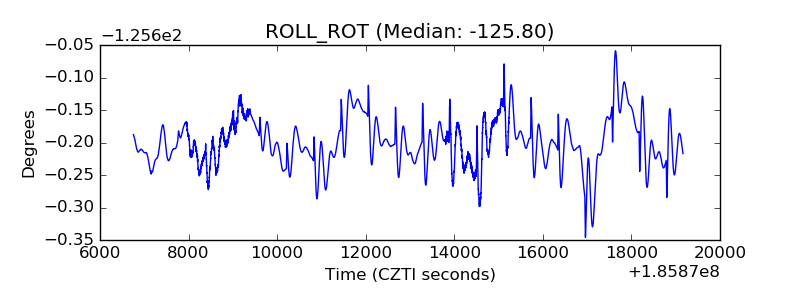 |
| _Roll_DEC | 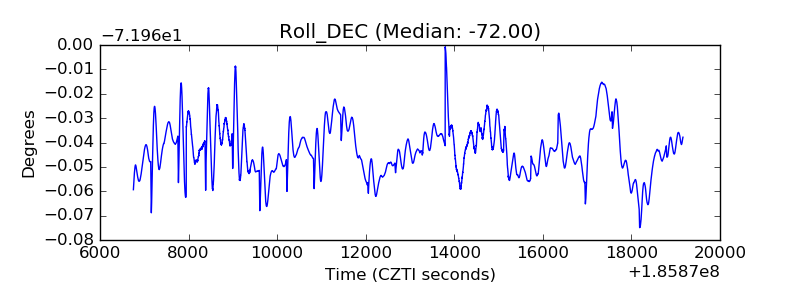 |
| _Roll_RA | 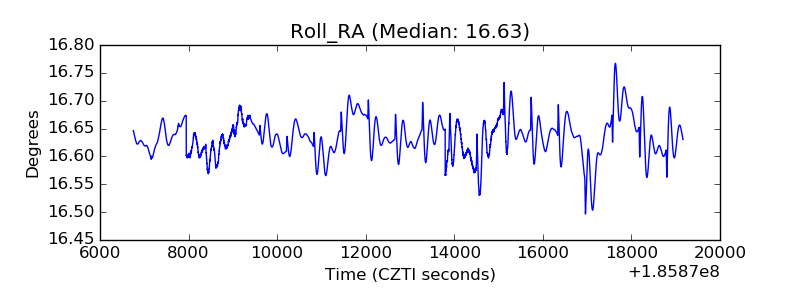 |
| Veto Counter | 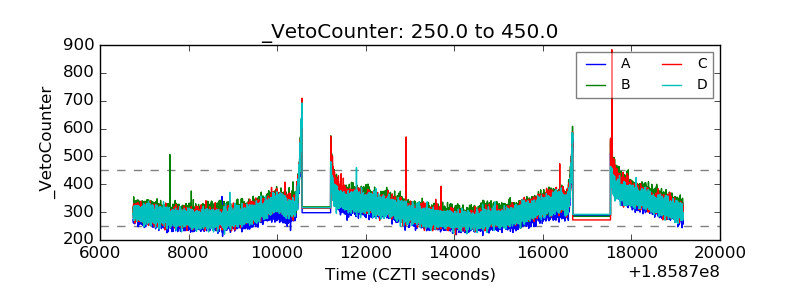 |