| Param | Original file | Final file |
|---|---|---|
| Filename | modeM0/AS1P01_010T01_9000000112_00820cztM0_level2.evt | modeM0/AS1P01_010T01_9000000112_00820cztM0_level2_quad_clean.evt |
| Size (bytes) | 979,680,960 | 93,015,360 |
| Size | 934.3 MB | 88.7 MB |
| Events in quadrant A | 7,288,667 | 605,249 |
| Events in quadrant B | 7,790,580 | 604,464 |
| Events in quadrant C | 7,069,182 | 594,798 |
| Events in quadrant D | 7,114,082 | 584,019 |
| Mode M9 | |||
|---|---|---|---|
| Quadrant | BADHDUFLAG | Total packets | Discarded packets |
| A | 0 | 10 | 0 |
| B | 0 | 10 | 0 |
| C | 0 | 10 | 0 |
| D | 0 | 10 | 0 |
| Mode M0 | |||
|---|---|---|---|
| Quadrant | BADHDUFLAG | Total packets | Discarded packets |
| A | 0 | 26022 | 0 |
| B | 0 | 27449 | 0 |
| C | 0 | 25368 | 0 |
| D | 0 | 25526 | 0 |
| Mode SS | |||
|---|---|---|---|
| Quadrant | BADHDUFLAG | Total packets | Discarded packets |
| A | 0 | 124 | 0 |
| B | 0 | 124 | 0 |
| C | 0 | 124 | 0 |
| D | 0 | 124 | 0 |
| Quadrant | Total seconds | Saturated seconds | Saturation percentage |
|---|---|---|---|
| A | 6138 | 48 | 0.782014% |
| B | 6138 | 49 | 0.798306% |
| C | 6138 | 65 | 1.058977% |
| D | 6138 | 103 | 1.678071% |
Noise dominated data is calculated using 1-second bins in cleaned event files. If a bin has >2000 counts, and if more than 50% of those come from <1% of pixels, then it is considered to be noise-dominated and hence unusable.
| Quadrant | # 1 sec bins | Bins with >0 counts | Bins with >2000 counts | High rate bins dominated by noise | Noise dominated (total time) | Noise dominated (detector-on time) | Marked lightcurve |
|---|---|---|---|---|---|---|---|
| A | 7133 | 6138 | 196 | 196 | 2.75% | 3.19% | 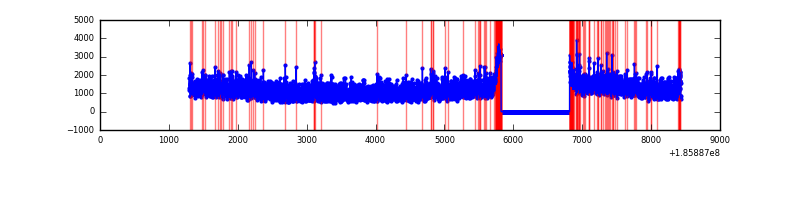 |
| B | 7133 | 6138 | 257 | 257 | 3.60% | 4.19% | 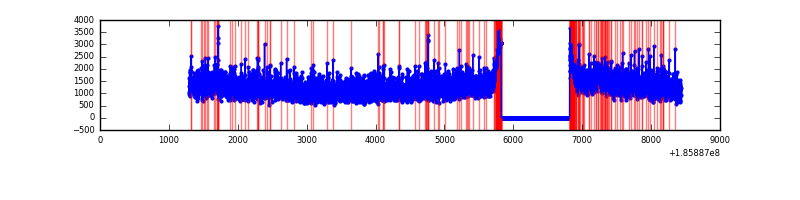 |
| C | 7133 | 6138 | 197 | 197 | 2.76% | 3.21% | 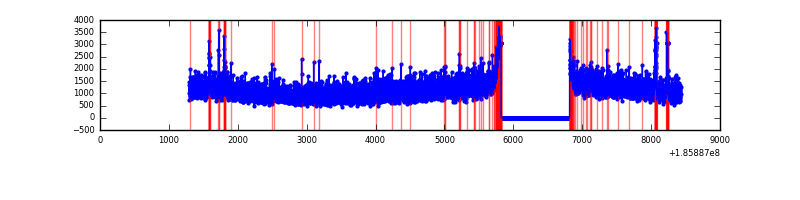 |
| D | 7133 | 6138 | 258 | 258 | 3.62% | 4.20% | 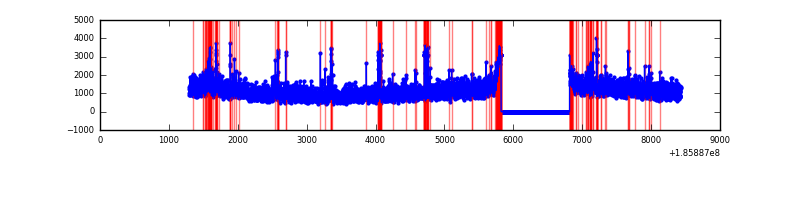 |
Top three noisy pixels from each quadrant. If the there are fewer than three noisy pixels in the level2.evt file, extra rows are filled as -1
| Pixel properties | Quadrant properties | ||||||
|---|---|---|---|---|---|---|---|
| Quadrant | DetID | PixID | Counts | Sigma | Mean | Median | Sigma |
| A | 15 | 69 | 30349 | 62.51 | 1878 | 1893 | 455.2 |
| A | 15 | 233 | 29670 | 61.02 | 1878 | 1893 | 455.2 |
| A | 8 | 192 | 19586 | 38.87 | 1878 | 1893 | 455.2 |
| B | 0 | 220 | 121009 | 260.3 | 1950 | 1960 | 457.4 |
| B | 2 | 2 | 59907 | 126.7 | 1950 | 1960 | 457.4 |
| B | 5 | 191 | 34359 | 70.84 | 1950 | 1960 | 457.4 |
| C | 9 | 52 | 166878 | 344.82 | 1718 | 1775 | 478.8 |
| C | 15 | 241 | 97045 | 198.97 | 1718 | 1775 | 478.8 |
| C | 3 | 79 | 36484 | 72.49 | 1718 | 1775 | 478.8 |
| D | 13 | 200 | 326550 | 611.66 | 1698 | 1759 | 531.0 |
| D | 1 | 4 | 180049 | 335.76 | 1698 | 1759 | 531.0 |
| D | 10 | 85 | 75964 | 139.75 | 1698 | 1759 | 531.0 |
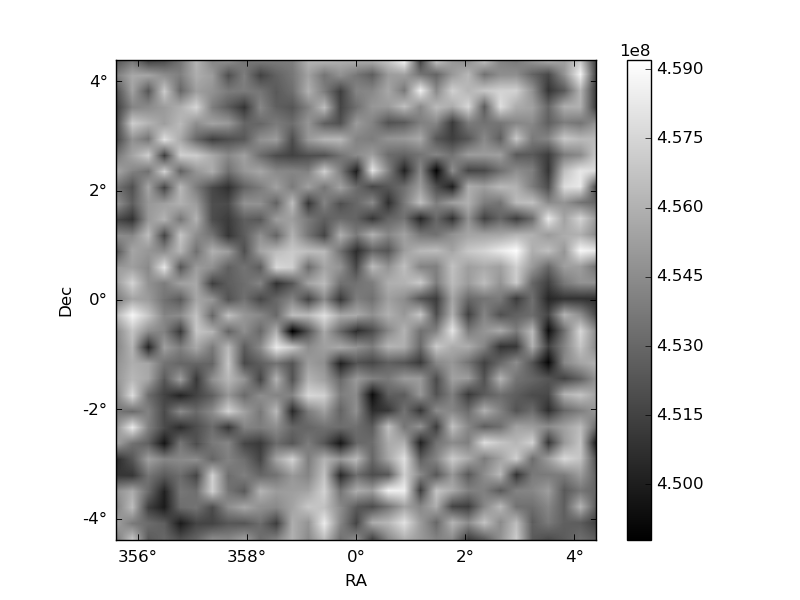
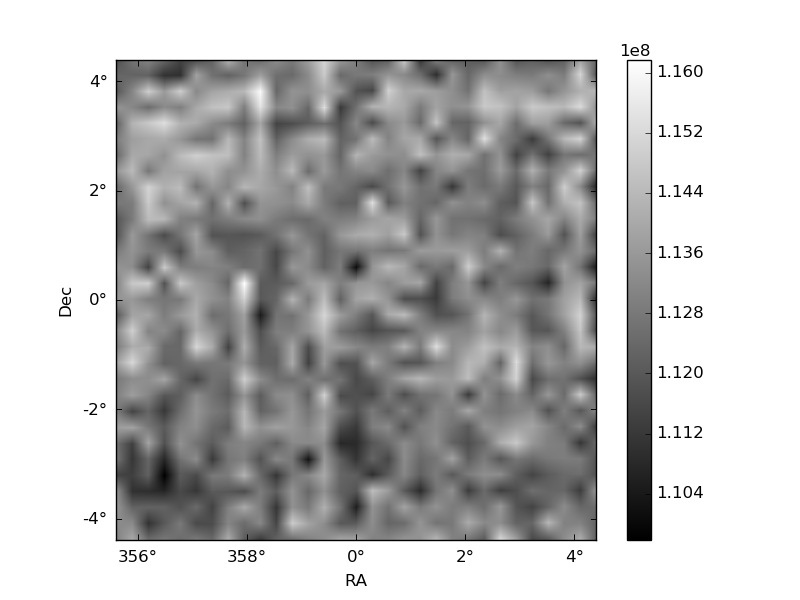
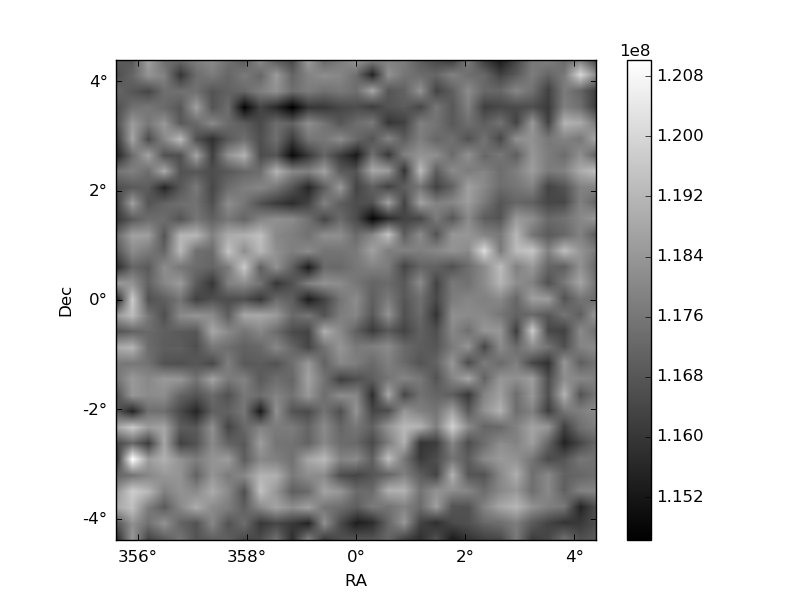
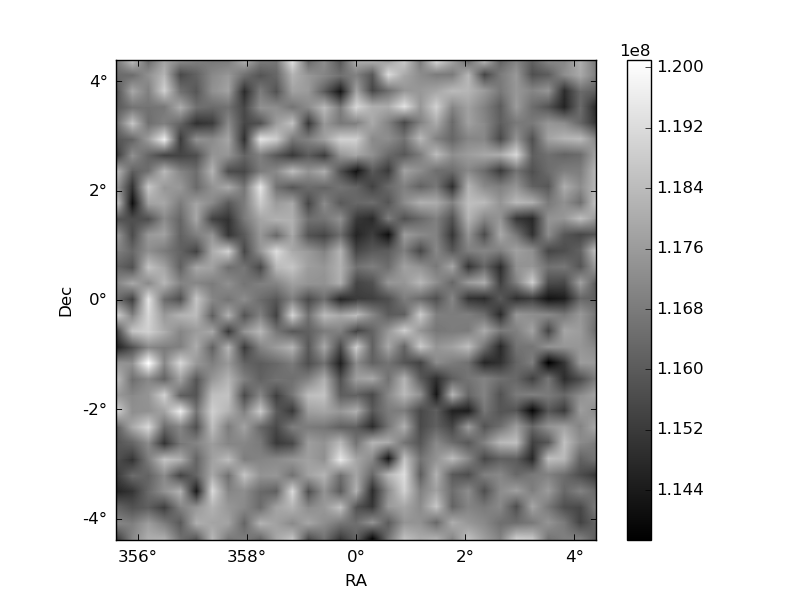
Histogram calculated using DETX and DETY for each event in the final _common_clean file
| Quadrant A | 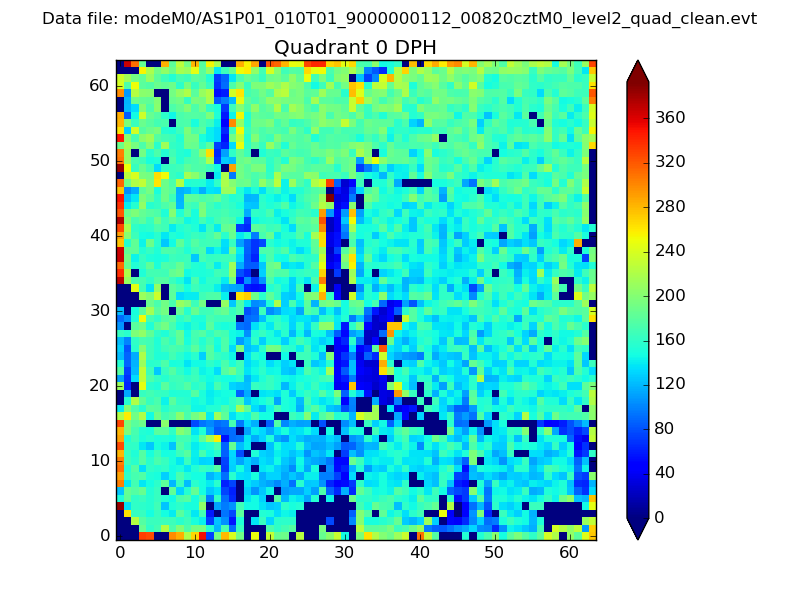 |
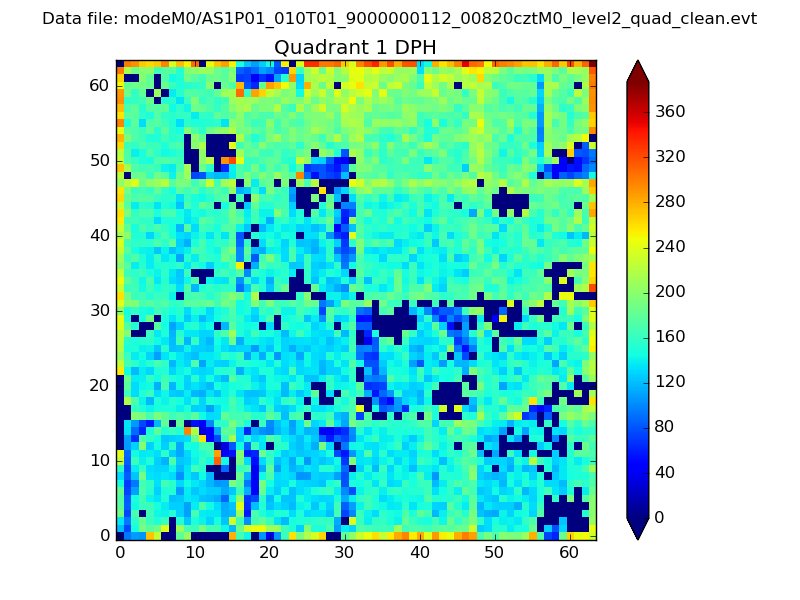 |
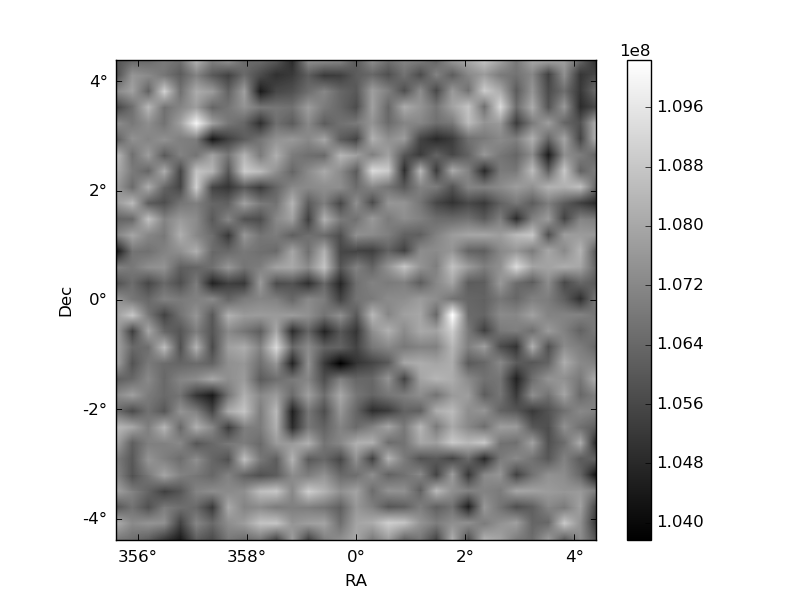
Quadrant B |
|---|---|---|---|
| Quadrant D | 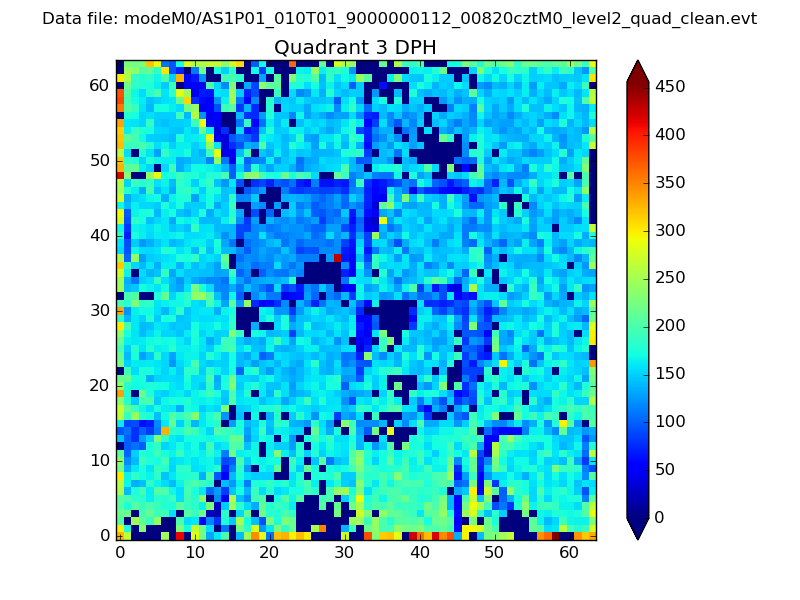 |
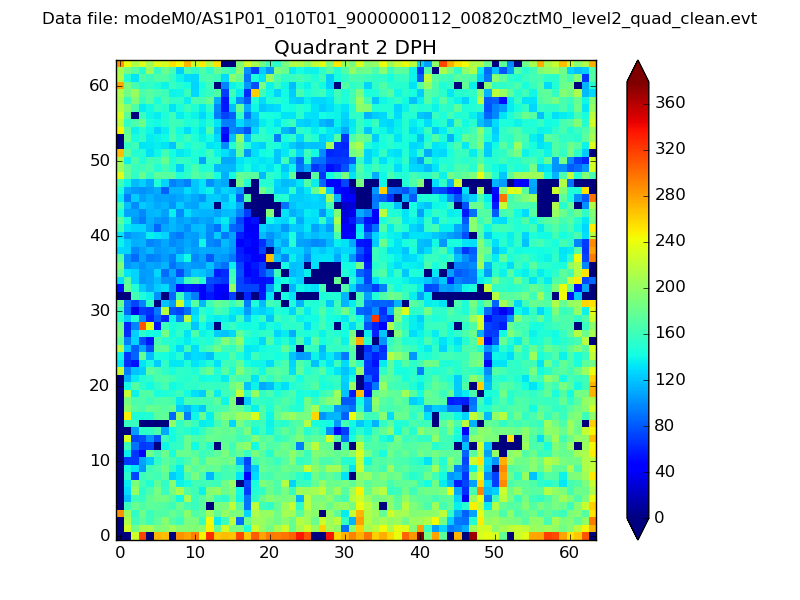 |
Quadrant C |
| Plot type | Count rate plots | Images |
|---|---|---|
| Comparison with Poisson distribution Blue bars denote a histogram of data divided into 1 sec bins. Red curve is a Poisson curve with rate = median count rate of data. |
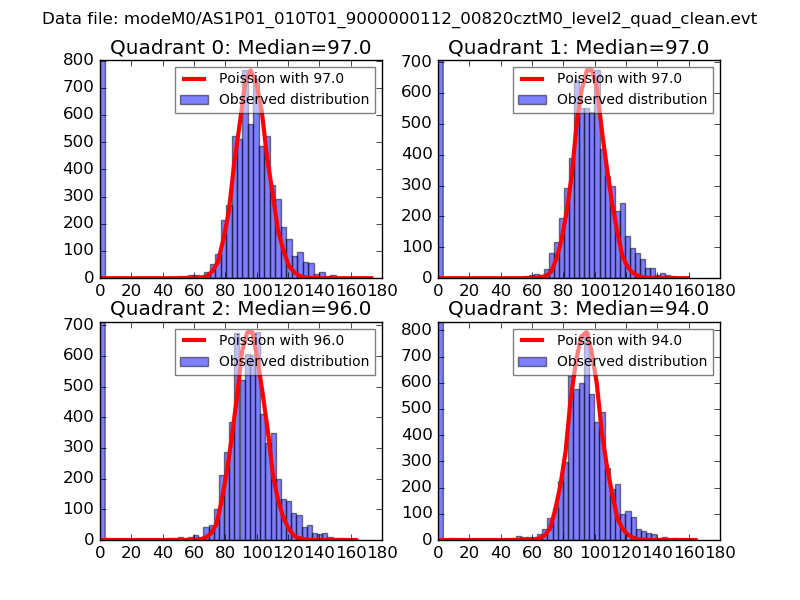 |
 |
| Quadrant-wise count rates Data is divided into 100 sec bins |
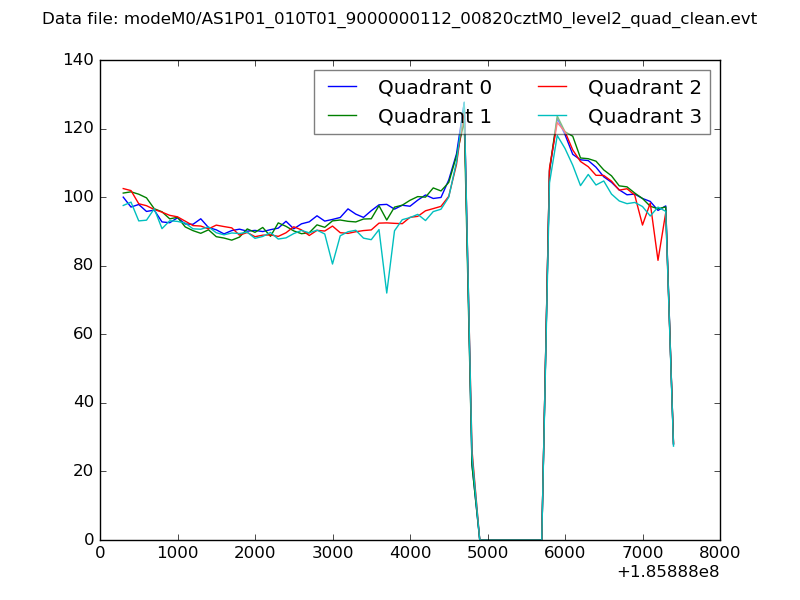 |
|
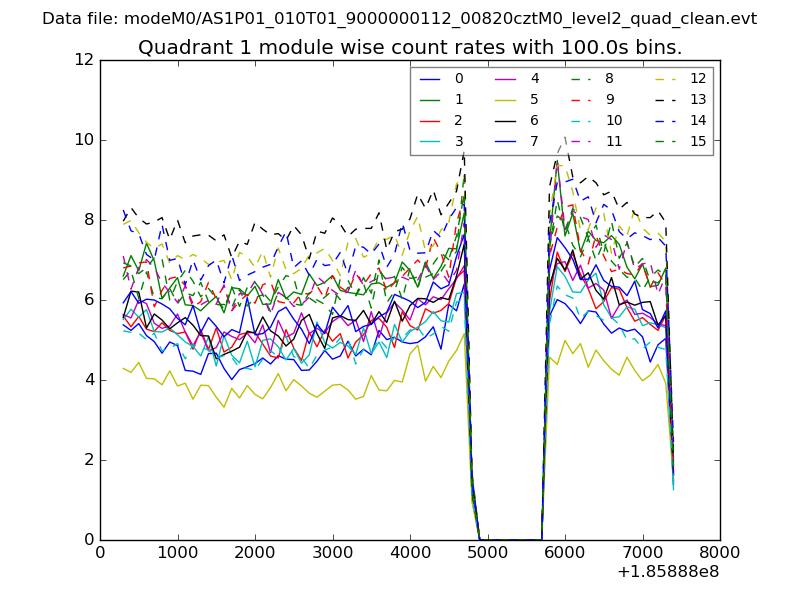
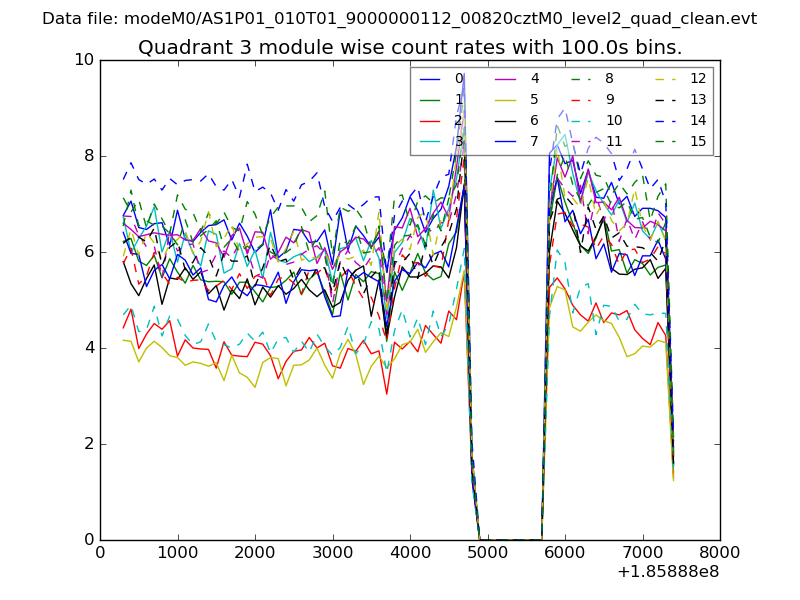
| Module-wise count rates for Quadrant A Data is divided into 100 sec bins |
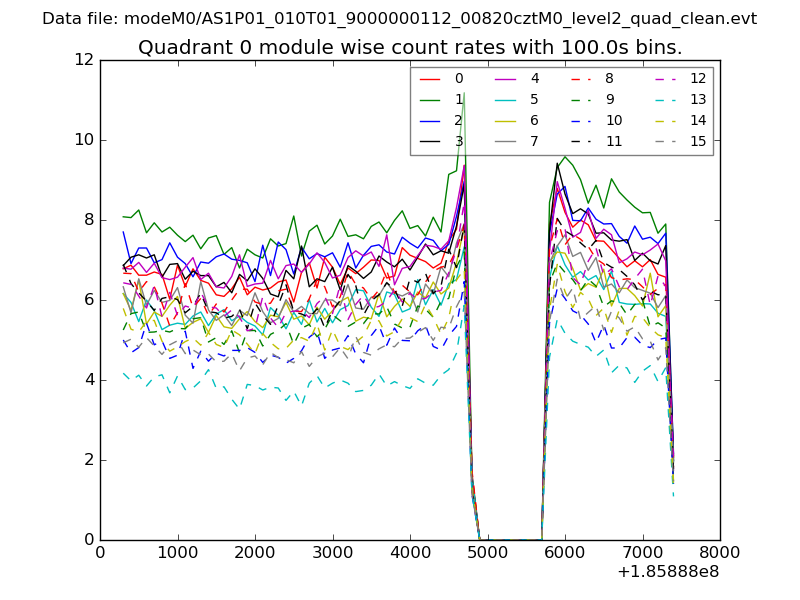 |
 |
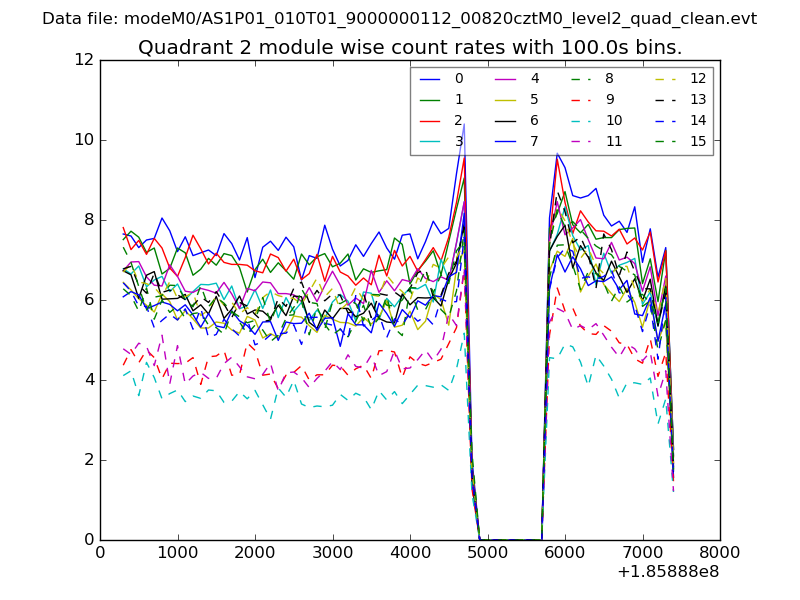
| Module-wise count rates for Quadrant B Data is divided into 100 sec bins |
 |
 |
| Module-wise count rates for Quadrant C Data is divided into 100 sec bins |
 |
 |
| Module-wise count rates for Quadrant D Data is divided into 100 sec bins |
 |
 |
| Parameter | Plot |
|---|---|
| CZT HV Monitor | 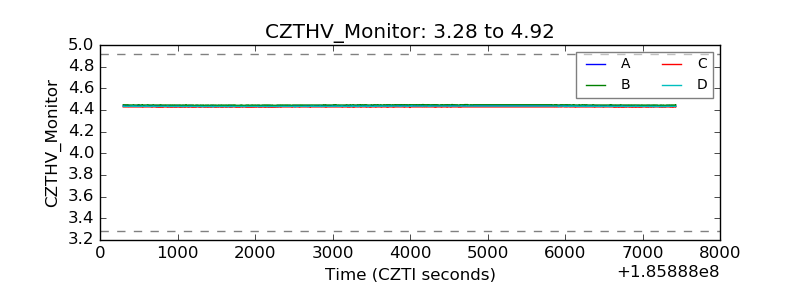 |
| D_VDD | 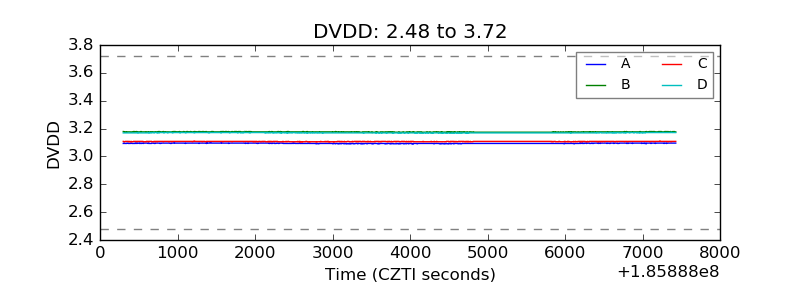 |
| Temperature 1 | 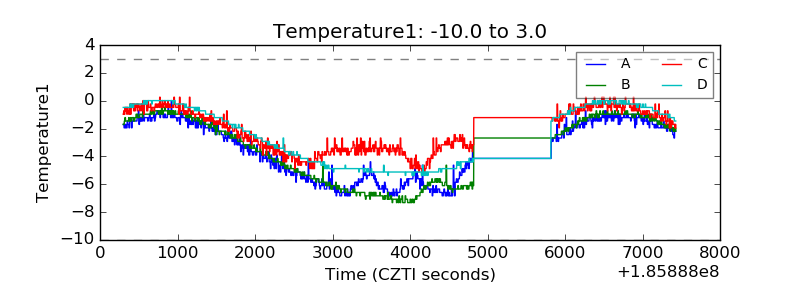 |
| Veto HV Monitor |  |
| Veto LLD | 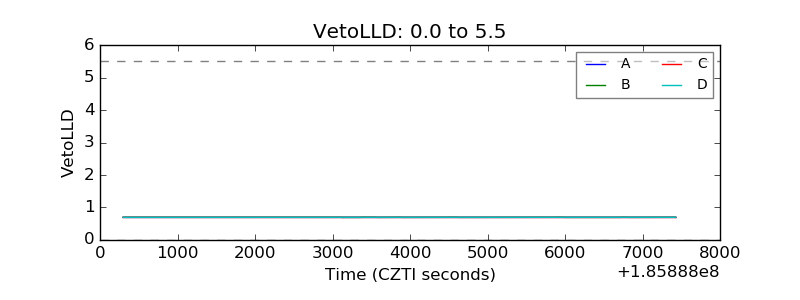 |
| Alpha Counter | 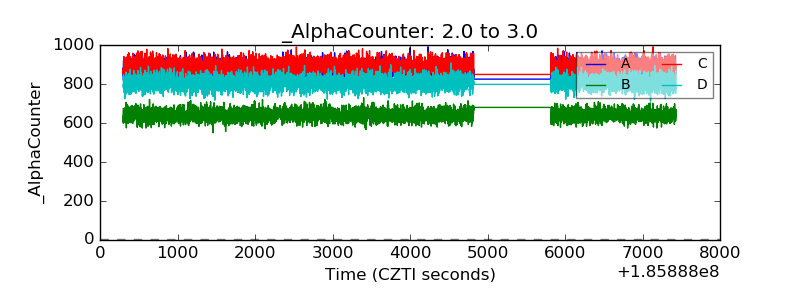 |
| _CPM_Rate | 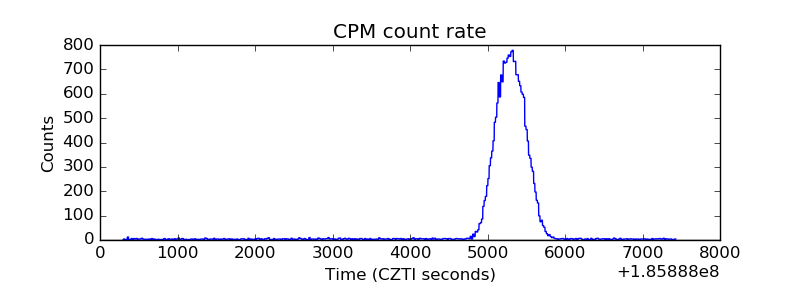 |
| CZT Counter | 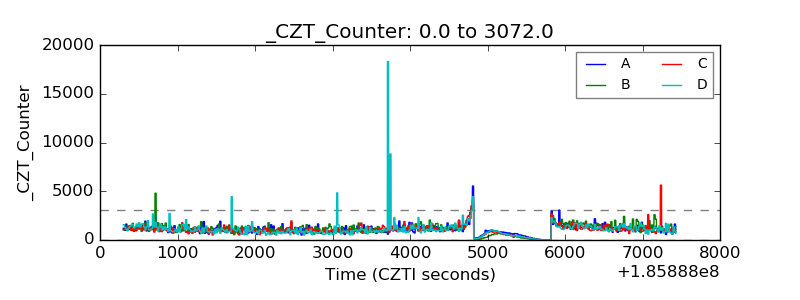 |
| +2.5 Volts monitor |  |
| +5 Volts monitor |  |
| _ROLL_ROT | 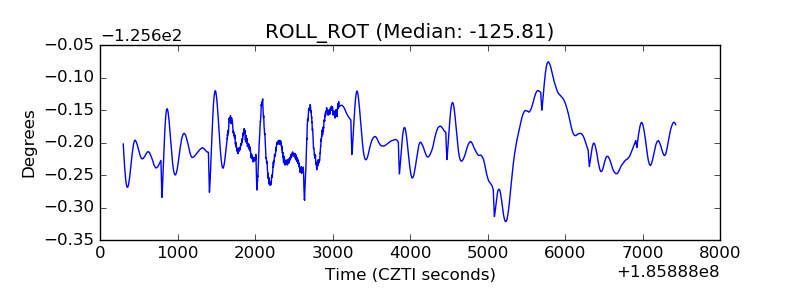 |
| _Roll_DEC | 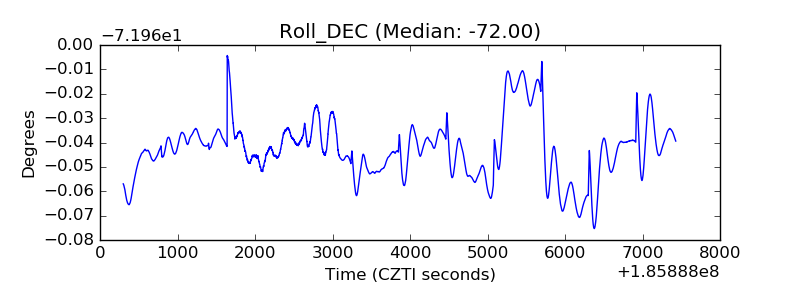 |
| _Roll_RA | 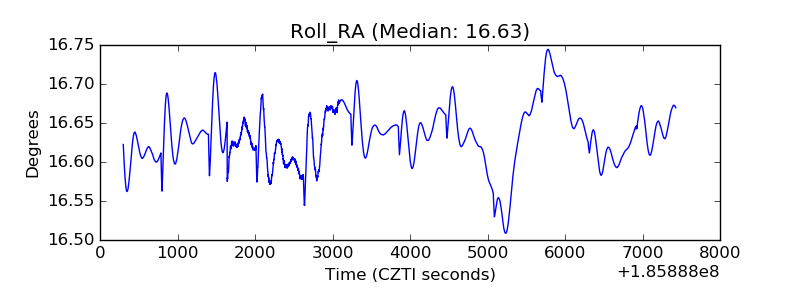 |
| Veto Counter | 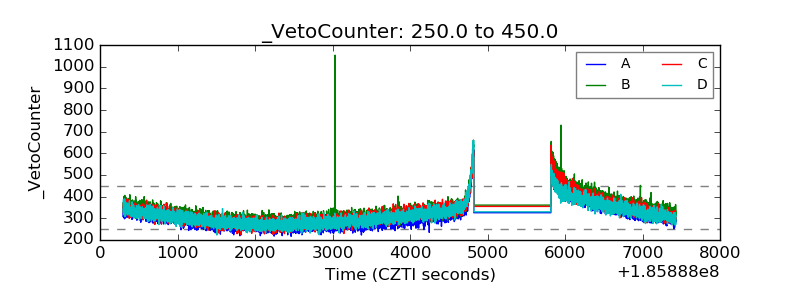 |