| Param | Original file | Final file |
|---|---|---|
| Filename | modeM0/AS1P01_010T01_9000000112_00822cztM0_level2.evt | modeM0/AS1P01_010T01_9000000112_00822cztM0_level2_quad_clean.evt |
| Size (bytes) | 922,772,160 | 87,667,200 |
| Size | 880.0 MB | 83.6 MB |
| Events in quadrant A | 6,630,644 | 578,826 |
| Events in quadrant B | 7,843,003 | 570,160 |
| Events in quadrant C | 6,461,665 | 559,542 |
| Events in quadrant D | 6,634,089 | 549,316 |
| Mode M9 | |||
|---|---|---|---|
| Quadrant | BADHDUFLAG | Total packets | Discarded packets |
| A | 0 | 11 | 0 |
| B | 0 | 11 | 0 |
| C | 0 | 11 | 0 |
| D | 0 | 11 | 0 |
| Mode M0 | |||
|---|---|---|---|
| Quadrant | BADHDUFLAG | Total packets | Discarded packets |
| A | 0 | 23743 | 0 |
| B | 0 | 27378 | 0 |
| C | 0 | 23281 | 0 |
| D | 0 | 23777 | 0 |
| Mode SS | |||
|---|---|---|---|
| Quadrant | BADHDUFLAG | Total packets | Discarded packets |
| A | 0 | 116 | 0 |
| B | 0 | 116 | 0 |
| C | 0 | 116 | 0 |
| D | 0 | 116 | 0 |
| Quadrant | Total seconds | Saturated seconds | Saturation percentage |
|---|---|---|---|
| A | 5673 | 41 | 0.722722% |
| B | 5673 | 252 | 4.442094% |
| C | 5674 | 62 | 1.092704% |
| D | 5673 | 95 | 1.674599% |
Noise dominated data is calculated using 1-second bins in cleaned event files. If a bin has >2000 counts, and if more than 50% of those come from <1% of pixels, then it is considered to be noise-dominated and hence unusable.
| Quadrant | # 1 sec bins | Bins with >0 counts | Bins with >2000 counts | High rate bins dominated by noise | Noise dominated (total time) | Noise dominated (detector-on time) | Marked lightcurve |
|---|---|---|---|---|---|---|---|
| A | 6813 | 5673 | 185 | 185 | 2.72% | 3.26% |  |
| B | 6813 | 5673 | 679 | 679 | 9.97% | 11.97% | 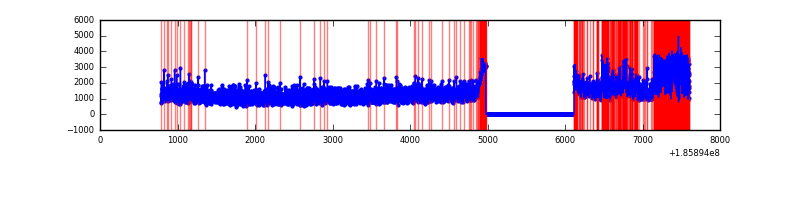 |
| C | 6814 | 5674 | 166 | 166 | 2.44% | 2.93% | 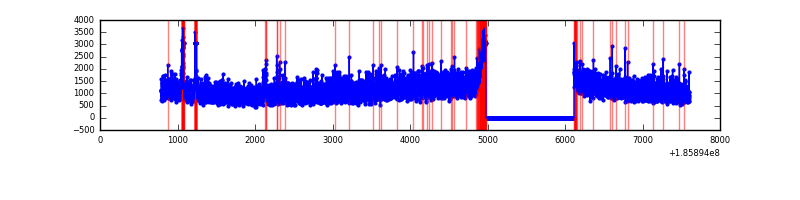 |
| D | 6813 | 5673 | 243 | 243 | 3.57% | 4.28% | 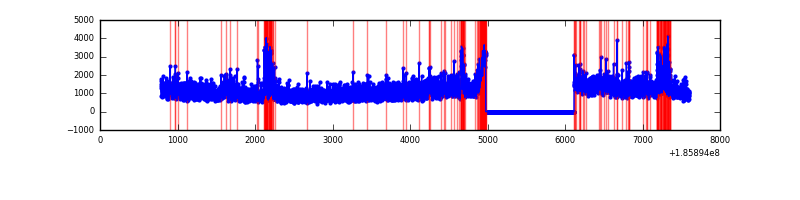 |
Top three noisy pixels from each quadrant. If the there are fewer than three noisy pixels in the level2.evt file, extra rows are filled as -1
| Pixel properties | Quadrant properties | ||||||
|---|---|---|---|---|---|---|---|
| Quadrant | DetID | PixID | Counts | Sigma | Mean | Median | Sigma |
| A | 15 | 69 | 39368 | 90.95 | 1706 | 1719 | 414.0 |
| A | 15 | 233 | 39153 | 90.43 | 1706 | 1719 | 414.0 |
| A | 11 | 79 | 7680 | 14.4 | 1706 | 1719 | 414.0 |
| B | 3 | 204 | 950910 | 2278.28 | 1768 | 1777 | 416.6 |
| B | 0 | 220 | 62758 | 146.38 | 1768 | 1777 | 416.6 |
| B | 4 | 232 | 23203 | 51.43 | 1768 | 1777 | 416.6 |
| C | 9 | 52 | 136425 | 308.69 | 1575 | 1626 | 436.7 |
| C | 15 | 241 | 58171 | 129.49 | 1575 | 1626 | 436.7 |
| C | 1 | 192 | 45716 | 100.96 | 1575 | 1626 | 436.7 |
| D | 13 | 200 | 275908 | 577.88 | 1529 | 1579 | 474.7 |
| D | 1 | 4 | 275835 | 577.73 | 1529 | 1579 | 474.7 |
| D | 2 | 216 | 161777 | 337.46 | 1529 | 1579 | 474.7 |
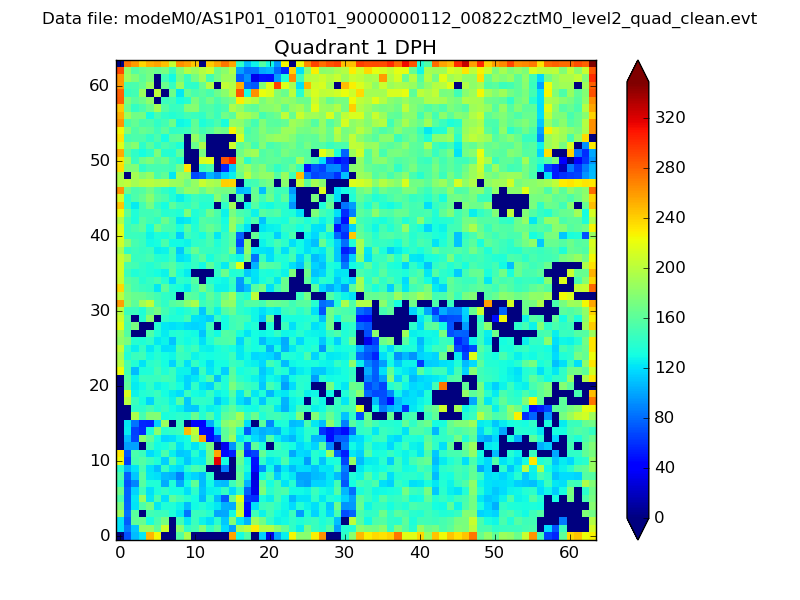
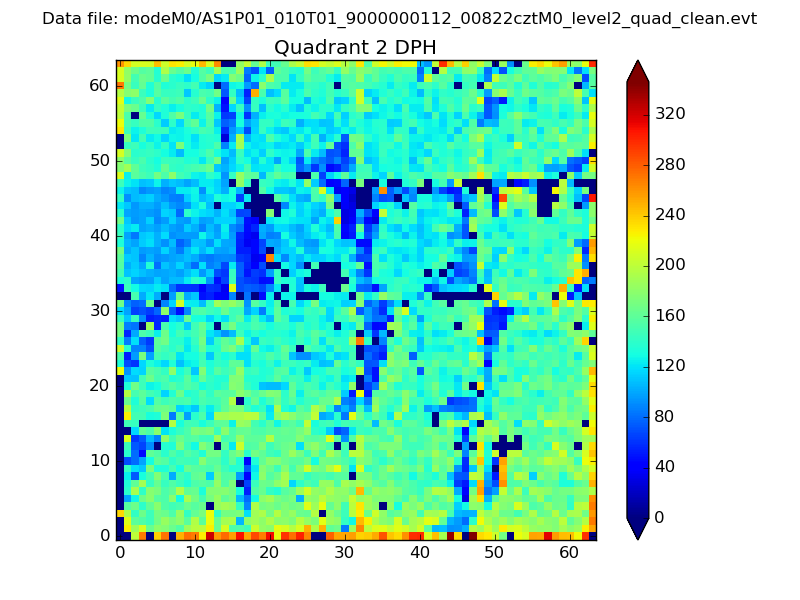
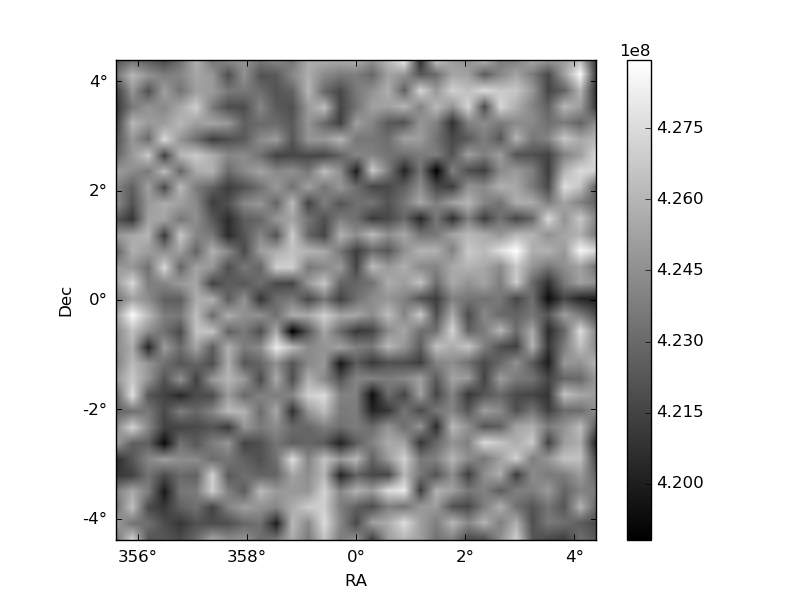
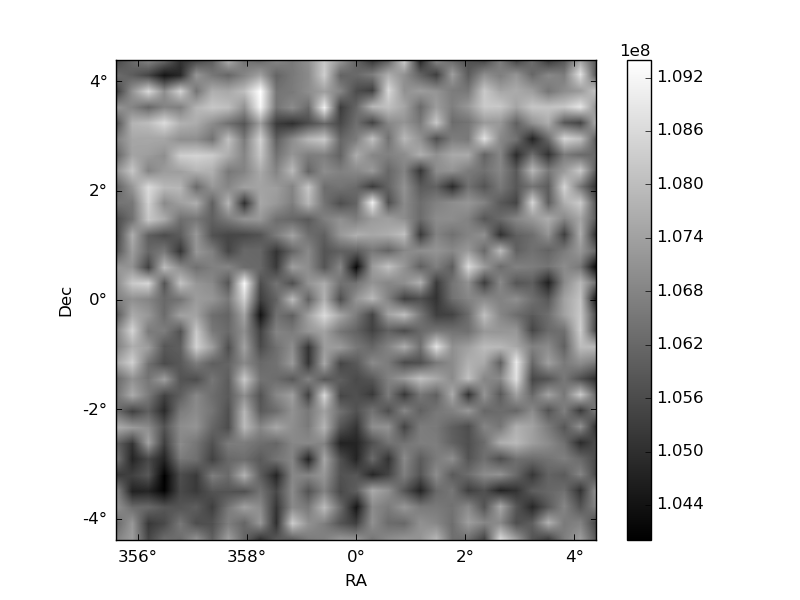
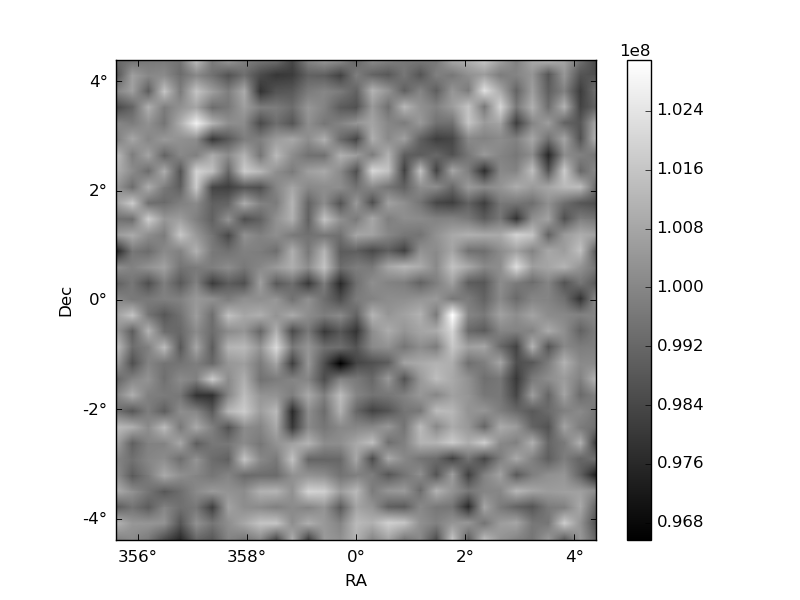
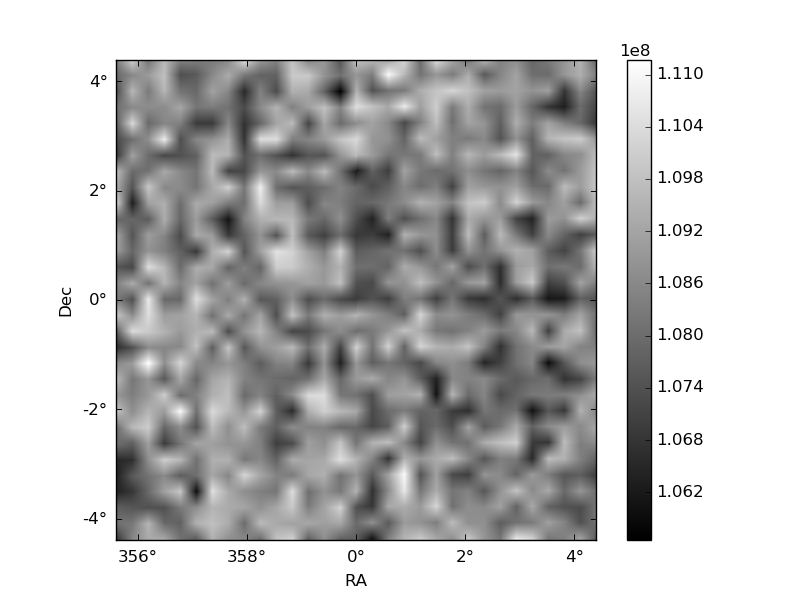
Histogram calculated using DETX and DETY for each event in the final _common_clean file
| Quadrant A | 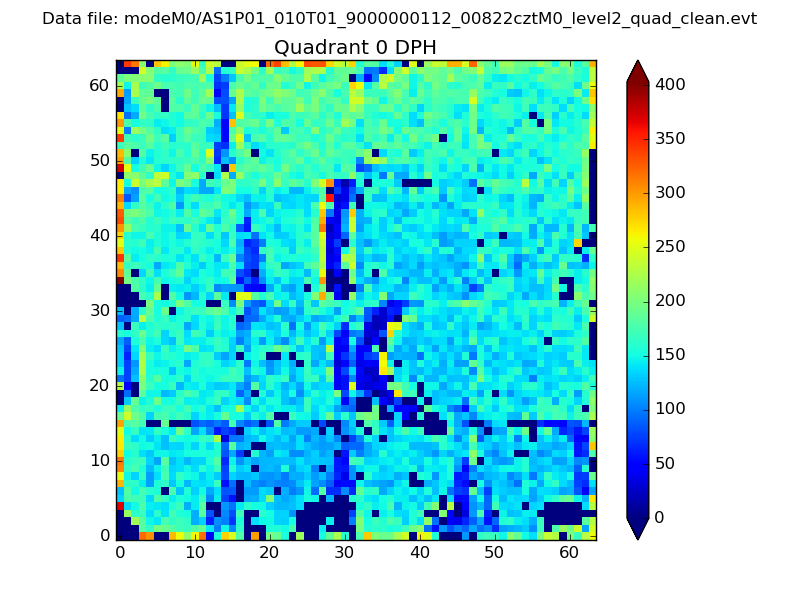 |
 |
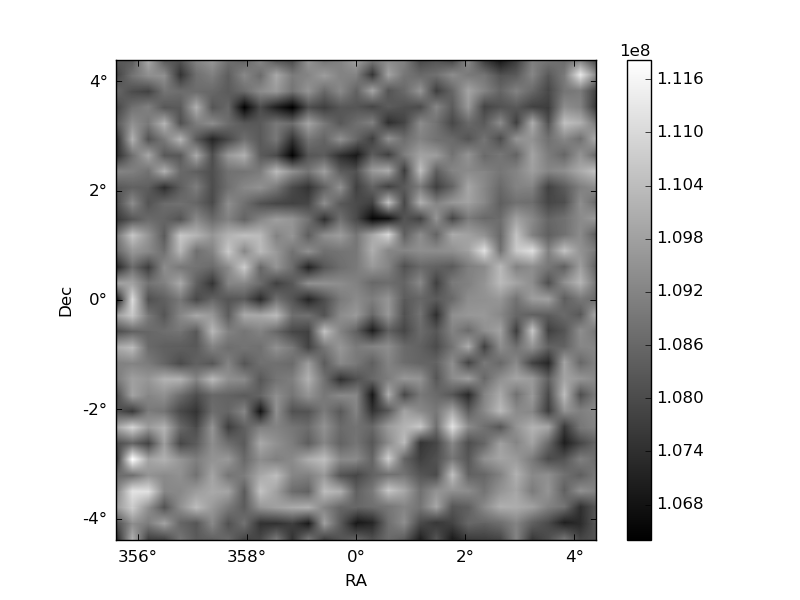
Quadrant B |
|---|---|---|---|
| Quadrant D | 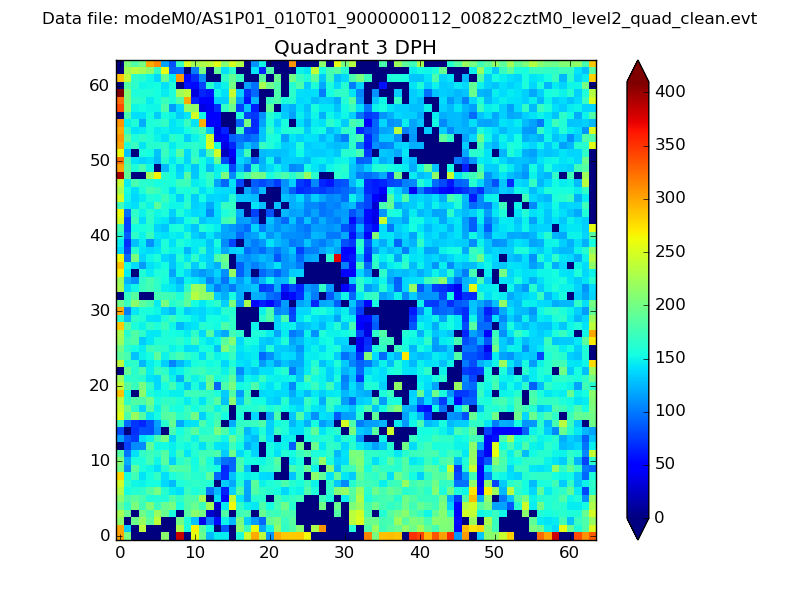 |
 |
Quadrant C |
| Plot type | Count rate plots | Images |
|---|---|---|
| Comparison with Poisson distribution Blue bars denote a histogram of data divided into 1 sec bins. Red curve is a Poisson curve with rate = median count rate of data. |
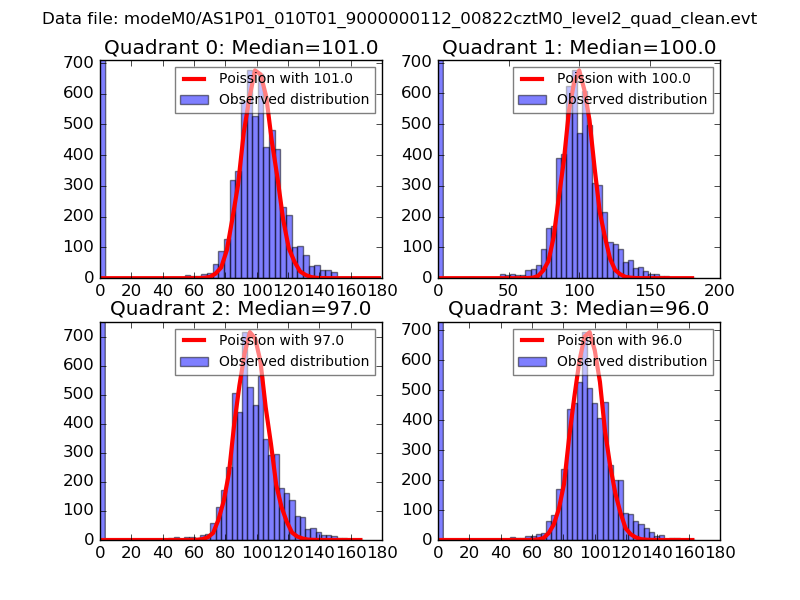 |
 |
| Quadrant-wise count rates Data is divided into 100 sec bins |
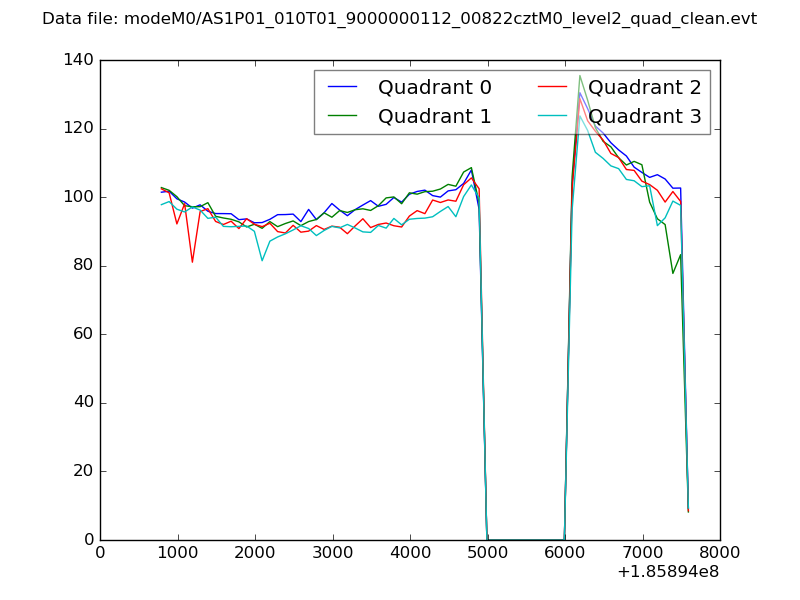 |
|
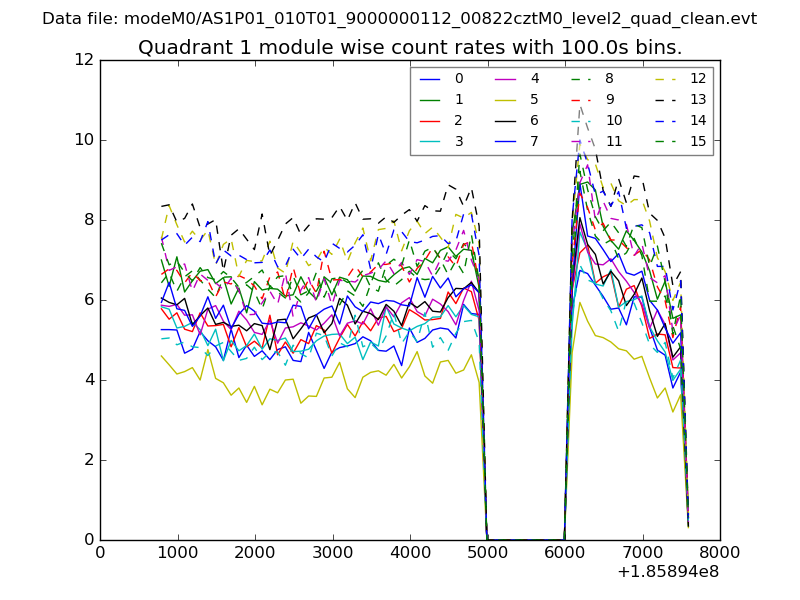
| Module-wise count rates for Quadrant A Data is divided into 100 sec bins |
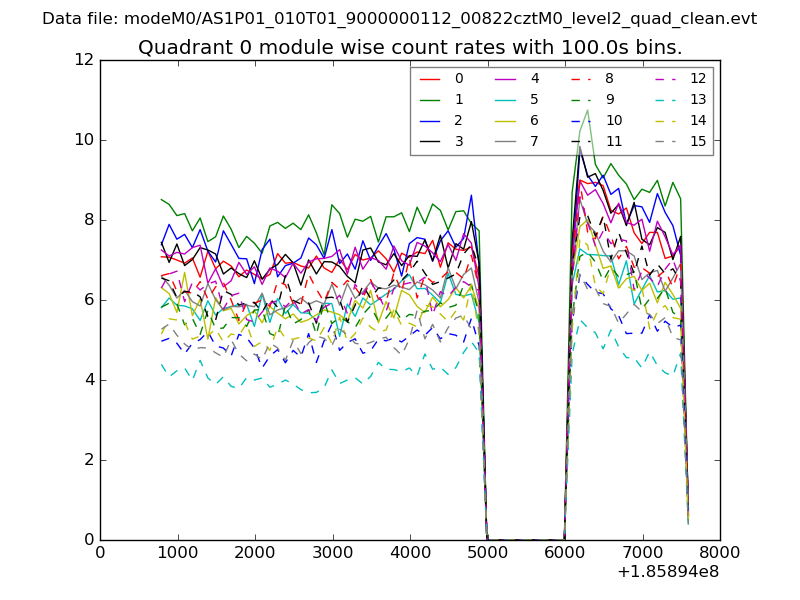 |
 |
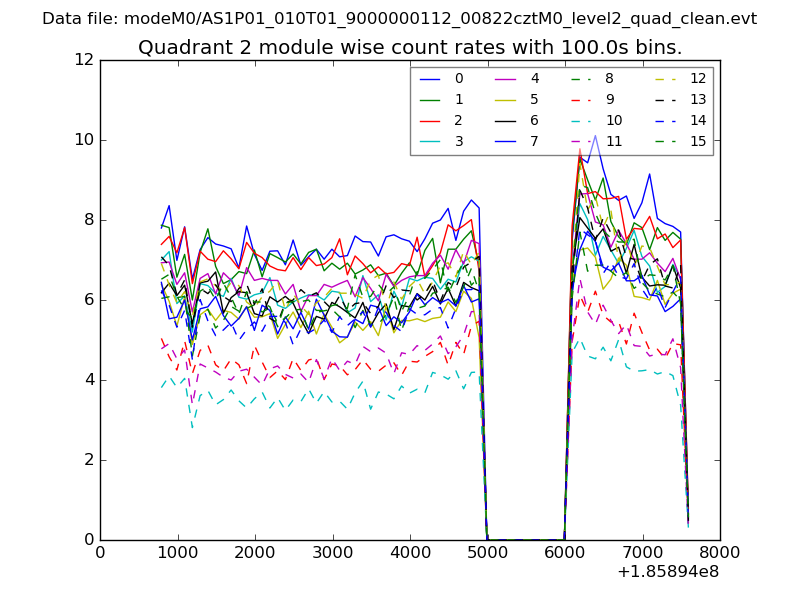
| Module-wise count rates for Quadrant B Data is divided into 100 sec bins |
 |
 |
| Module-wise count rates for Quadrant C Data is divided into 100 sec bins |
 |
 |
| Module-wise count rates for Quadrant D Data is divided into 100 sec bins |
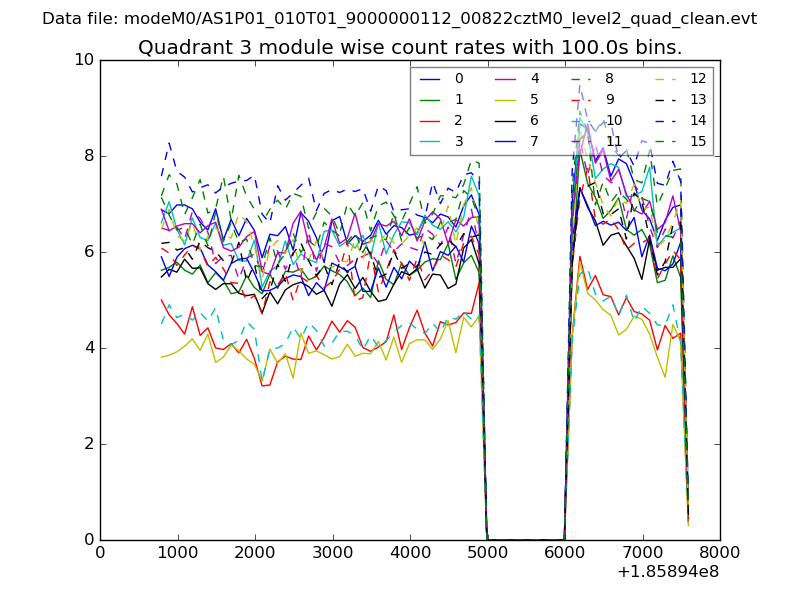 |
 |
| Parameter | Plot |
|---|---|
| CZT HV Monitor |  |
| D_VDD | 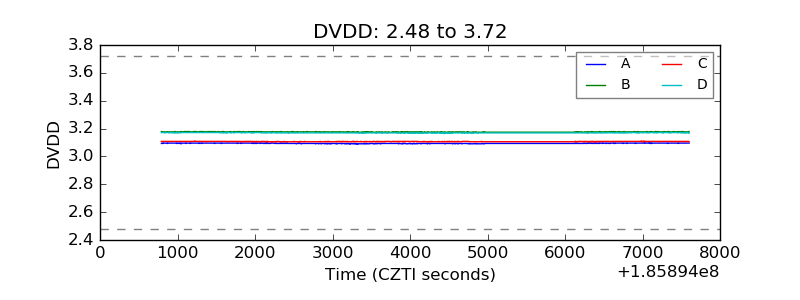 |
| Temperature 1 | 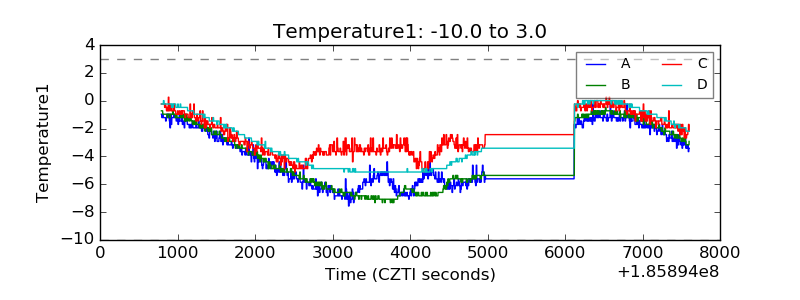 |
| Veto HV Monitor | 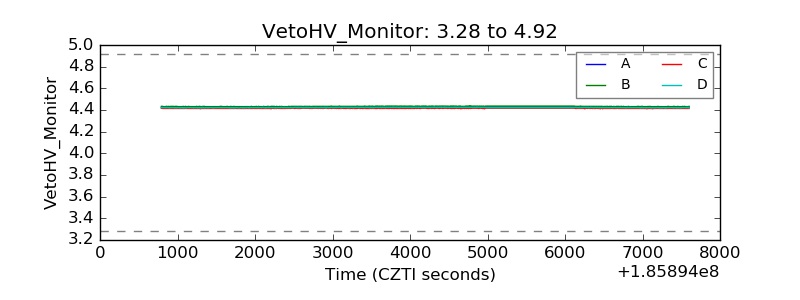 |
| Veto LLD | 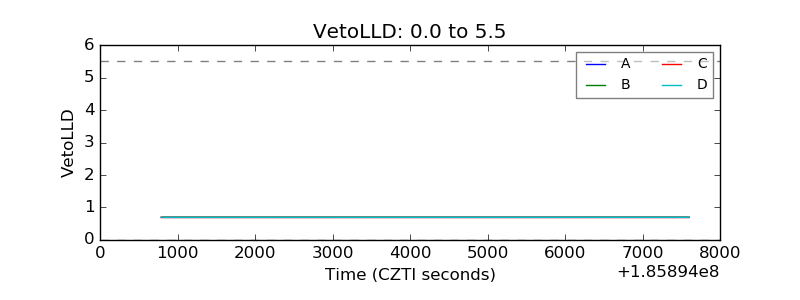 |
| Alpha Counter | 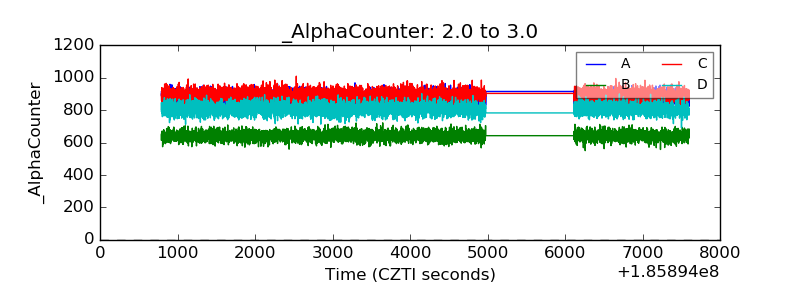 |
| _CPM_Rate | 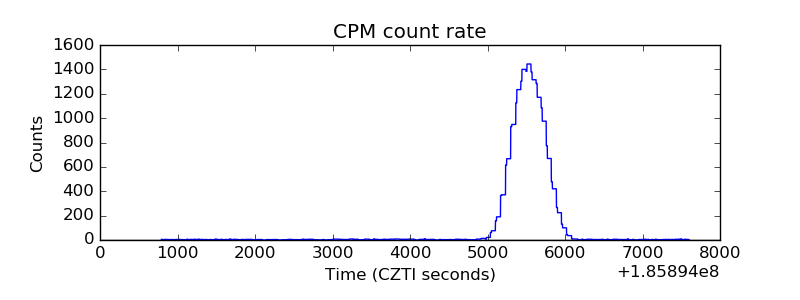 |
| CZT Counter | 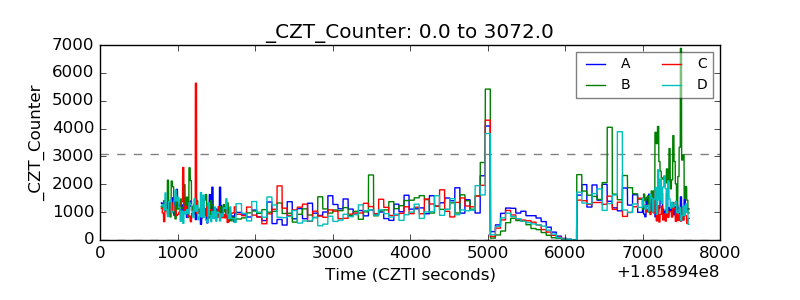 |
| +2.5 Volts monitor |  |
| +5 Volts monitor |  |
| _ROLL_ROT | 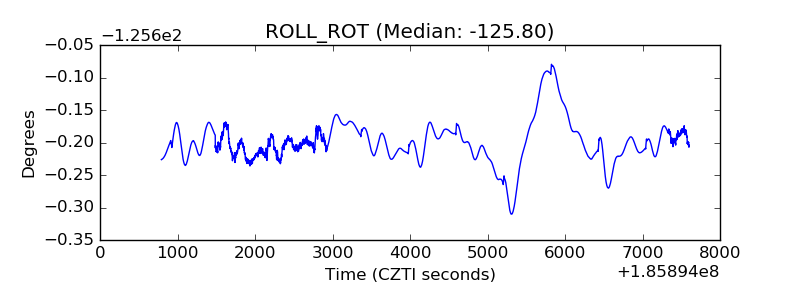 |
| _Roll_DEC | 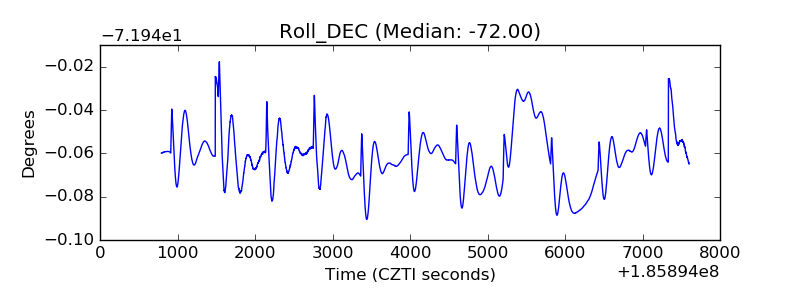 |
| _Roll_RA | 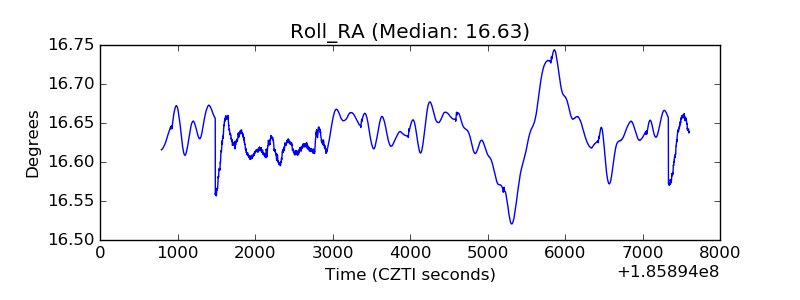 |
| Veto Counter | 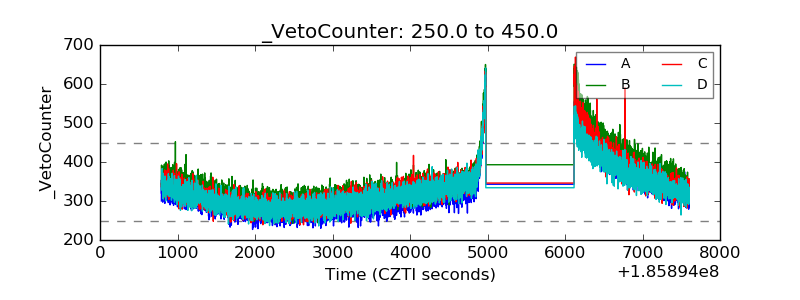 |