| Param | Original file | Final file |
|---|---|---|
| Filename | modeM0/AS1P01_010T01_9000000112_00824cztM0_level2.evt | modeM0/AS1P01_010T01_9000000112_00824cztM0_level2_quad_clean.evt |
| Size (bytes) | 982,480,320 | 95,932,800 |
| Size | 937.0 MB | 91.5 MB |
| Events in quadrant A | 7,214,613 | 638,634 |
| Events in quadrant B | 8,110,707 | 635,045 |
| Events in quadrant C | 6,648,134 | 619,847 |
| Events in quadrant D | 7,384,387 | 594,005 |
| Mode M9 | |||
|---|---|---|---|
| Quadrant | BADHDUFLAG | Total packets | Discarded packets |
| A | 0 | 13 | 0 |
| B | 0 | 13 | 0 |
| C | 0 | 13 | 0 |
| D | 0 | 13 | 0 |
| Mode M0 | |||
|---|---|---|---|
| Quadrant | BADHDUFLAG | Total packets | Discarded packets |
| A | 0 | 25721 | 0 |
| B | 0 | 28346 | 0 |
| C | 0 | 23986 | 0 |
| D | 0 | 26218 | 0 |
| Mode SS | |||
|---|---|---|---|
| Quadrant | BADHDUFLAG | Total packets | Discarded packets |
| A | 0 | 120 | 0 |
| B | 0 | 120 | 0 |
| C | 0 | 120 | 0 |
| D | 0 | 120 | 0 |
| Quadrant | Total seconds | Saturated seconds | Saturation percentage |
|---|---|---|---|
| A | 5984 | 69 | 1.153075% |
| B | 5984 | 185 | 3.091578% |
| C | 5984 | 1 | 0.016711% |
| D | 5983 | 175 | 2.924954% |
Noise dominated data is calculated using 1-second bins in cleaned event files. If a bin has >2000 counts, and if more than 50% of those come from <1% of pixels, then it is considered to be noise-dominated and hence unusable.
| Quadrant | # 1 sec bins | Bins with >0 counts | Bins with >2000 counts | High rate bins dominated by noise | Noise dominated (total time) | Noise dominated (detector-on time) | Marked lightcurve |
|---|---|---|---|---|---|---|---|
| A | 7269 | 5985 | 303 | 303 | 4.17% | 5.06% | 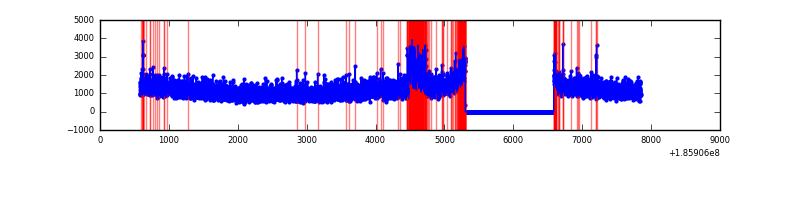 |
| B | 7269 | 5985 | 584 | 584 | 8.03% | 9.76% | 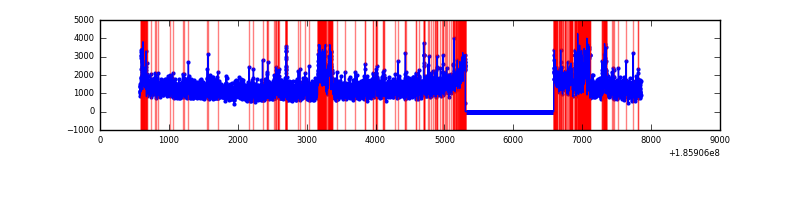 |
| C | 7269 | 5985 | 95 | 95 | 1.31% | 1.59% | 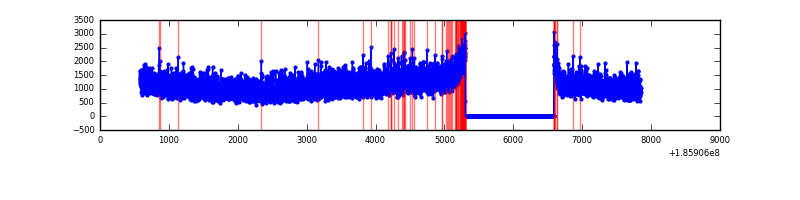 |
| D | 7268 | 5984 | 373 | 373 | 5.13% | 6.23% | 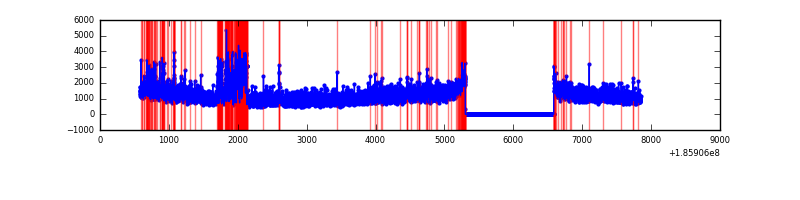 |
Top three noisy pixels from each quadrant. If the there are fewer than three noisy pixels in the level2.evt file, extra rows are filled as -1
| Pixel properties | Quadrant properties | ||||||
|---|---|---|---|---|---|---|---|
| Quadrant | DetID | PixID | Counts | Sigma | Mean | Median | Sigma |
| A | 15 | 171 | 311583 | 721.43 | 1791 | 1805 | 429.4 |
| A | 15 | 233 | 20091 | 42.59 | 1791 | 1805 | 429.4 |
| A | 7 | 16 | 8003 | 14.43 | 1791 | 1805 | 429.4 |
| B | 7 | 221 | 527474 | 1225.1 | 1858 | 1867 | 429.0 |
| B | 0 | 153 | 275811 | 638.52 | 1858 | 1867 | 429.0 |
| B | 0 | 220 | 145679 | 335.2 | 1858 | 1867 | 429.0 |
| C | 15 | 241 | 41975 | 87.34 | 1675 | 1726 | 460.8 |
| C | 3 | 111 | 31640 | 64.91 | 1675 | 1726 | 460.8 |
| C | 3 | 79 | 24972 | 50.44 | 1675 | 1726 | 460.8 |
| D | 13 | 200 | 830543 | 1677.97 | 1596 | 1654 | 494.0 |
| D | 1 | 4 | 398150 | 802.65 | 1596 | 1654 | 494.0 |
| D | 13 | 169 | 88579 | 175.97 | 1596 | 1654 | 494.0 |
Histogram calculated using DETX and DETY for each event in the final _common_clean file
| Quadrant A | 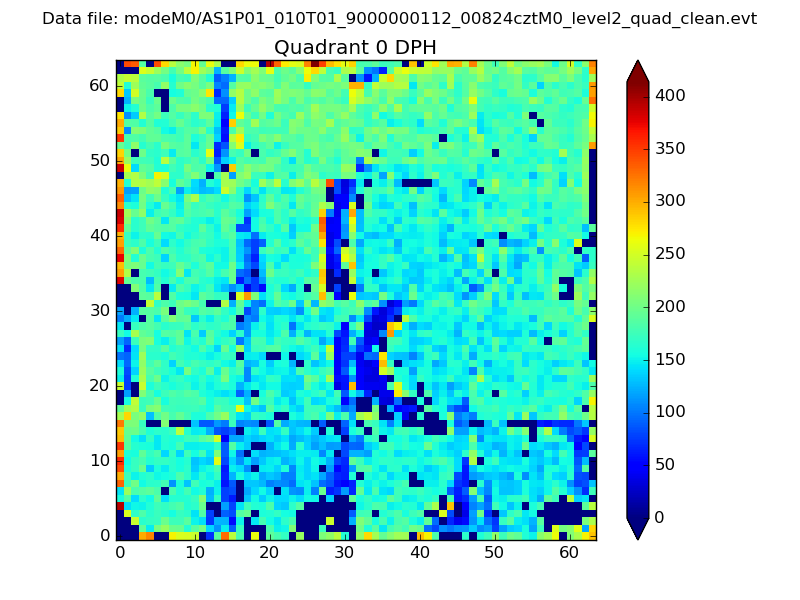 |
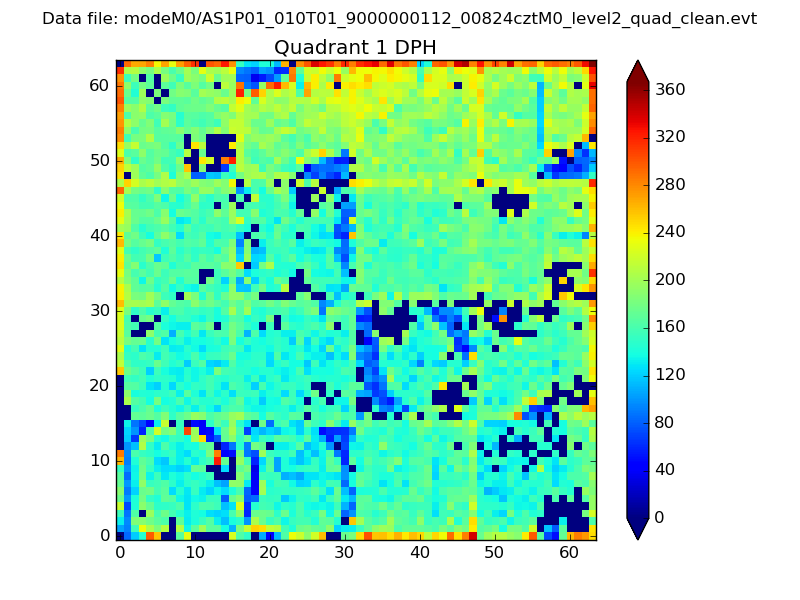 |
Quadrant B |
|---|---|---|---|
| Quadrant D | 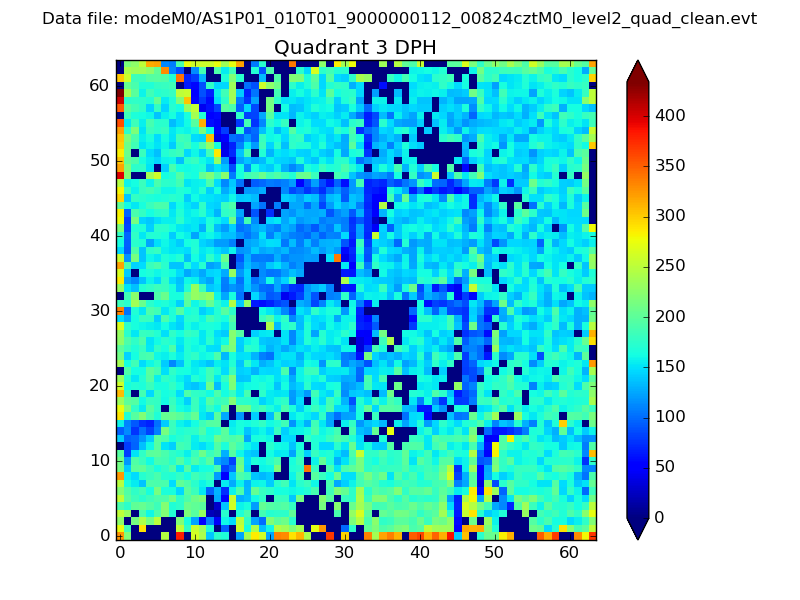 |
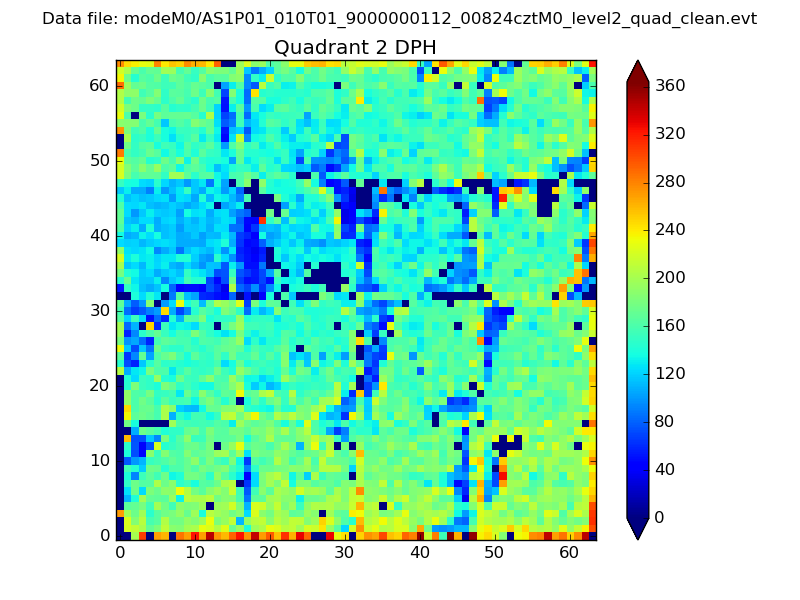 |
Quadrant C |
| Plot type | Count rate plots | Images |
|---|---|---|
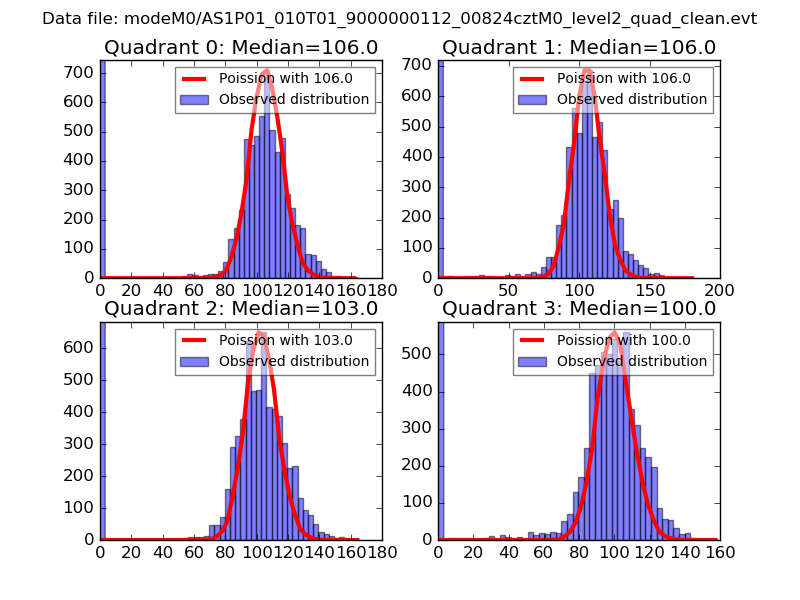
| Comparison with Poisson distribution Blue bars denote a histogram of data divided into 1 sec bins. Red curve is a Poisson curve with rate = median count rate of data. |
 |
 |
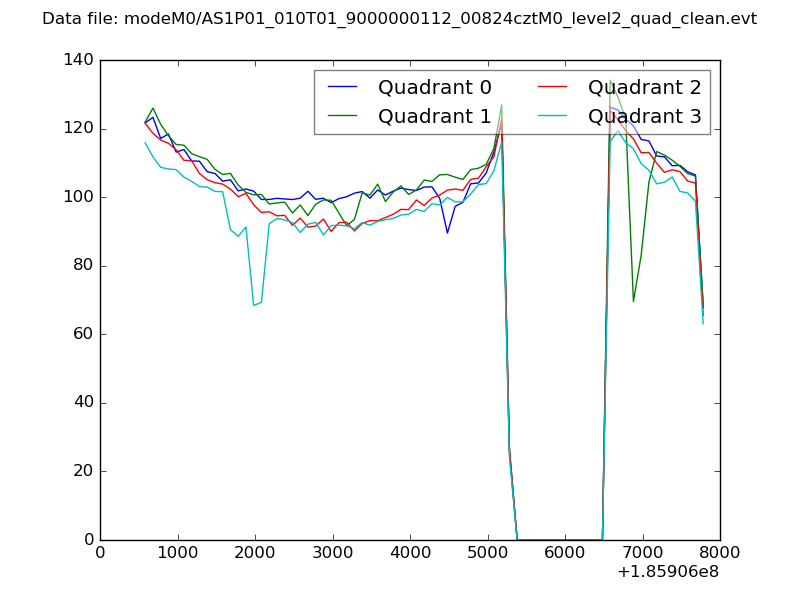
| Quadrant-wise count rates Data is divided into 100 sec bins |
 |
|
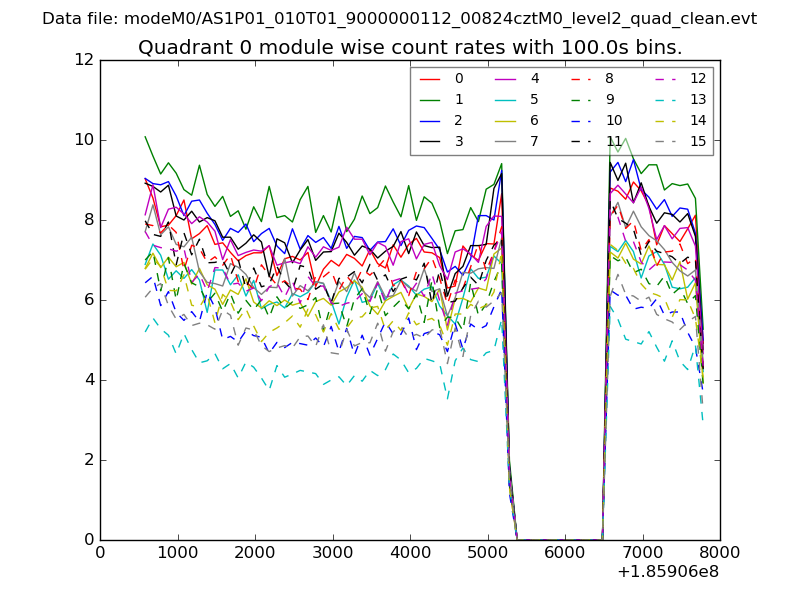
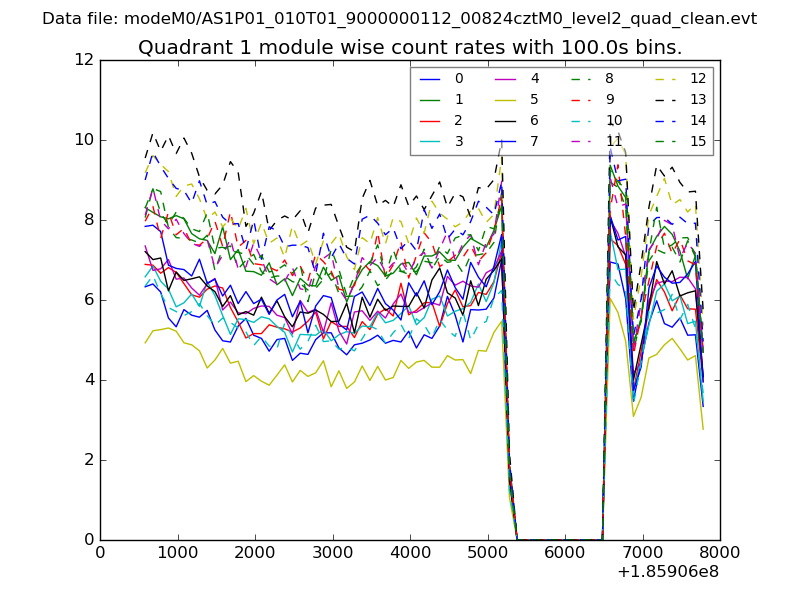
| Module-wise count rates for Quadrant A Data is divided into 100 sec bins |
 |
 |
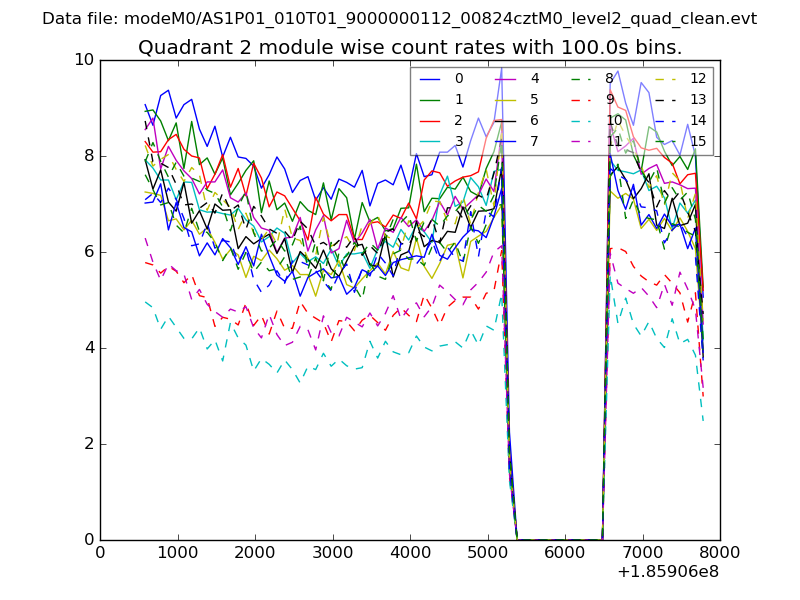
| Module-wise count rates for Quadrant B Data is divided into 100 sec bins |
 |
 |
| Module-wise count rates for Quadrant C Data is divided into 100 sec bins |
 |
 |
| Module-wise count rates for Quadrant D Data is divided into 100 sec bins |
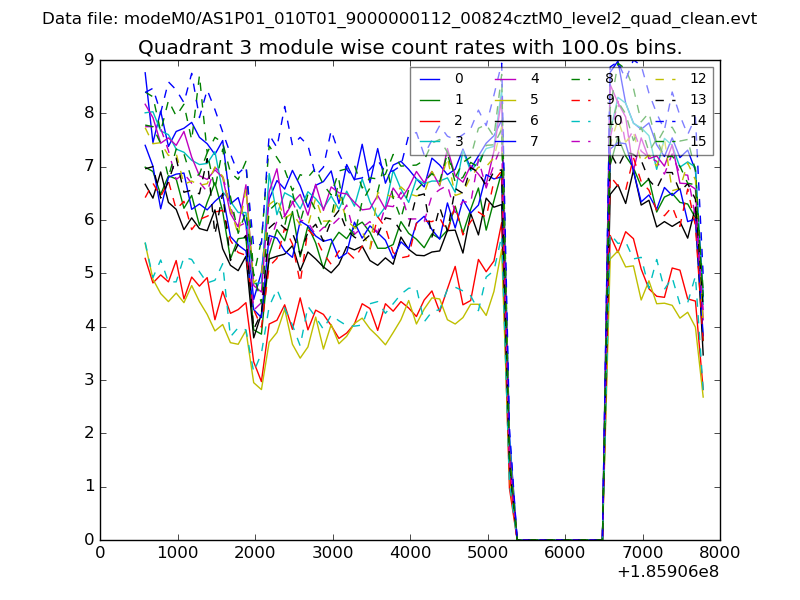 |
 |
| Parameter | Plot |
|---|---|
| CZT HV Monitor | 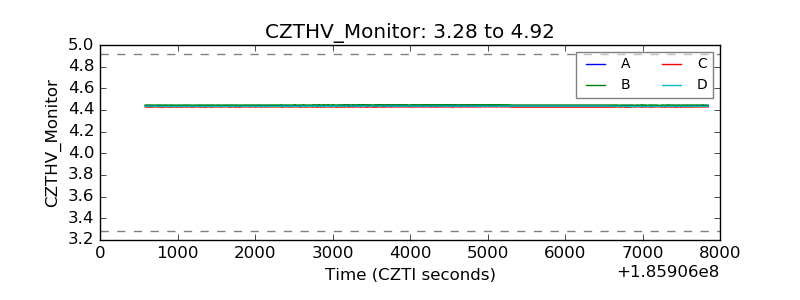 |
| D_VDD | 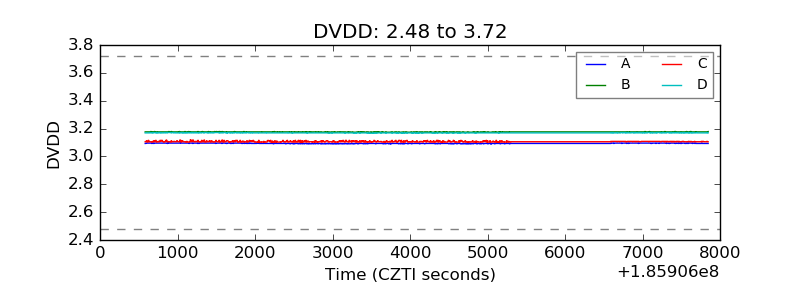 |
| Temperature 1 | 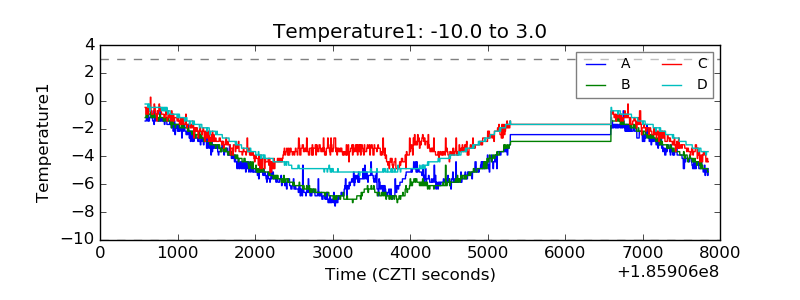 |
| Veto HV Monitor | 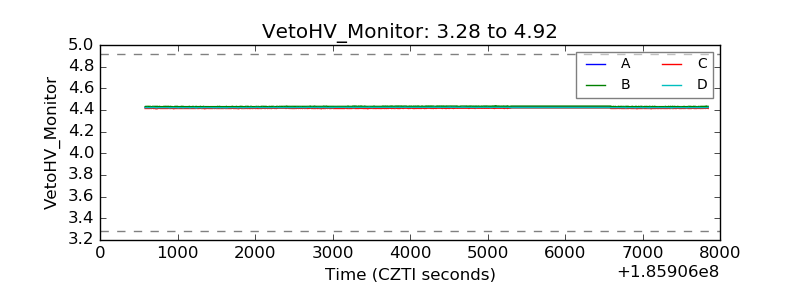 |
| Veto LLD | 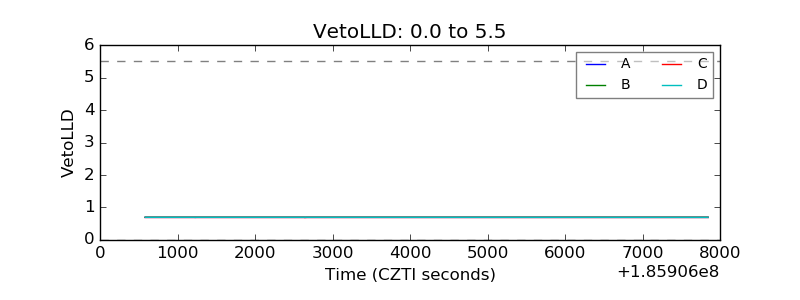 |
| Alpha Counter | 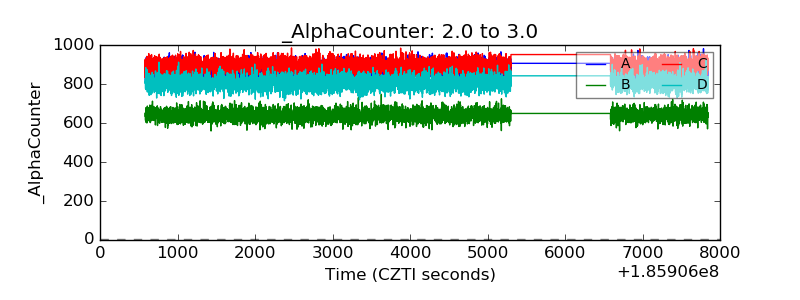 |
| _CPM_Rate | 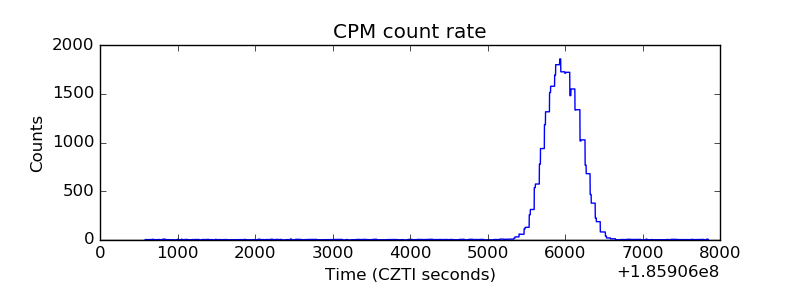 |
| CZT Counter | 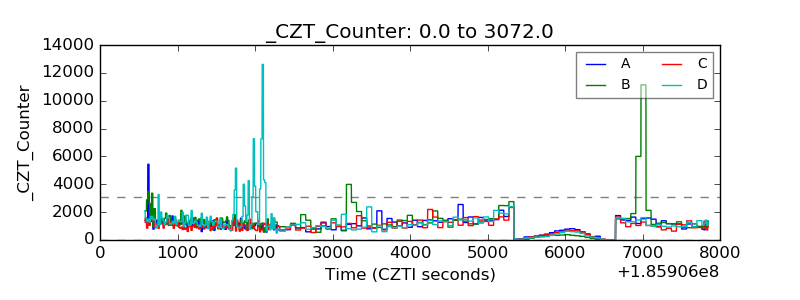 |
| +2.5 Volts monitor | 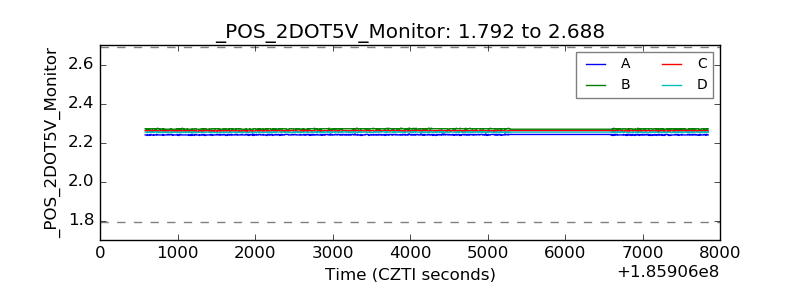 |
| +5 Volts monitor |  |
| _ROLL_ROT | 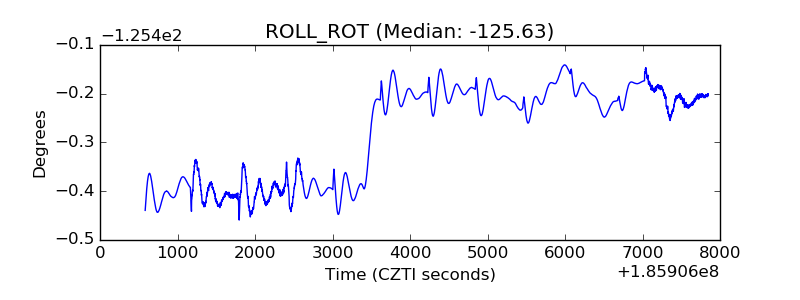 |
| _Roll_DEC | 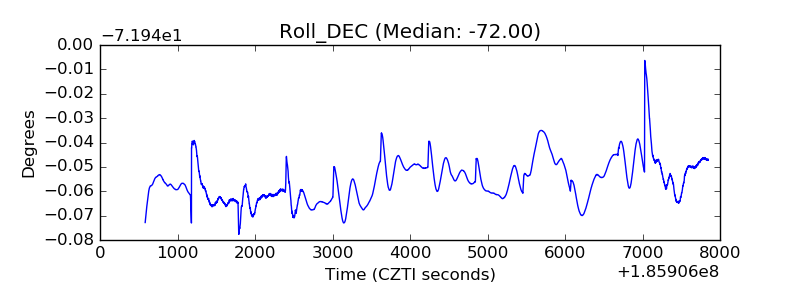 |
| _Roll_RA | 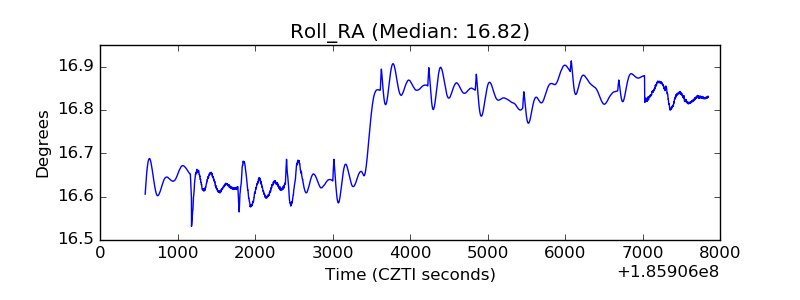 |
| Veto Counter | 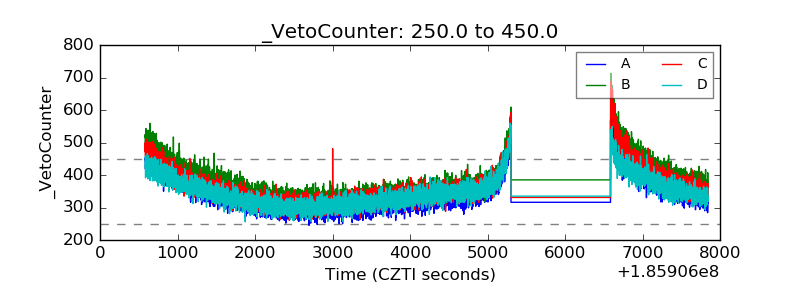 |