| Param | Original file | Final file |
|---|---|---|
| Filename | modeM0/AS1P01_010T01_9000000112_00830cztM0_level2.evt | modeM0/AS1P01_010T01_9000000112_00830cztM0_level2_quad_clean.evt |
| Size (bytes) | 1,123,980,480 | 102,873,600 |
| Size | 1.0 GB | 98.1 MB |
| Events in quadrant A | 8,267,628 | 668,309 |
| Events in quadrant B | 8,804,322 | 672,782 |
| Events in quadrant C | 8,340,892 | 654,659 |
| Events in quadrant D | 8,164,273 | 633,384 |
| Mode M0 | |||
|---|---|---|---|
| Quadrant | BADHDUFLAG | Total packets | Discarded packets |
| A | 0 | 29516 | 0 |
| B | 0 | 31117 | 0 |
| C | 0 | 29737 | 0 |
| D | 0 | 29252 | 0 |
| Mode SS | |||
|---|---|---|---|
| Quadrant | BADHDUFLAG | Total packets | Discarded packets |
| A | 0 | 140 | 0 |
| B | 0 | 140 | 0 |
| C | 0 | 140 | 0 |
| D | 0 | 140 | 0 |
| Quadrant | Total seconds | Saturated seconds | Saturation percentage |
|---|---|---|---|
| A | 6981 | 2 | 0.028649% |
| B | 6981 | 23 | 0.329466% |
| C | 6982 | 7 | 0.100258% |
| D | 6982 | 115 | 1.647093% |
Noise dominated data is calculated using 1-second bins in cleaned event files. If a bin has >2000 counts, and if more than 50% of those come from <1% of pixels, then it is considered to be noise-dominated and hence unusable.
| Quadrant | # 1 sec bins | Bins with >0 counts | Bins with >2000 counts | High rate bins dominated by noise | Noise dominated (total time) | Noise dominated (detector-on time) | Marked lightcurve |
|---|---|---|---|---|---|---|---|
| A | 6981 | 6981 | 281 | 281 | 4.03% | 4.03% | 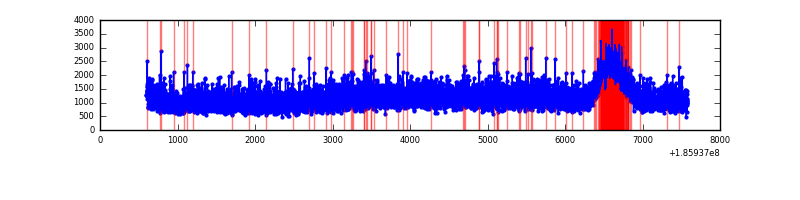 |
| B | 6981 | 6981 | 365 | 365 | 5.23% | 5.23% | 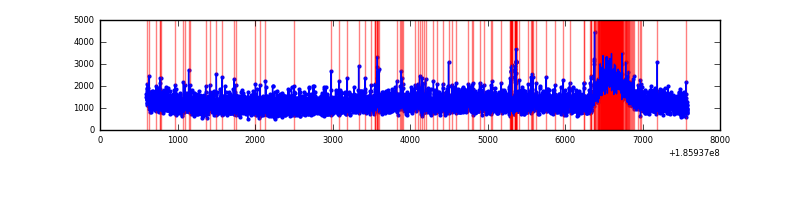 |
| C | 6982 | 6982 | 300 | 300 | 4.30% | 4.30% | 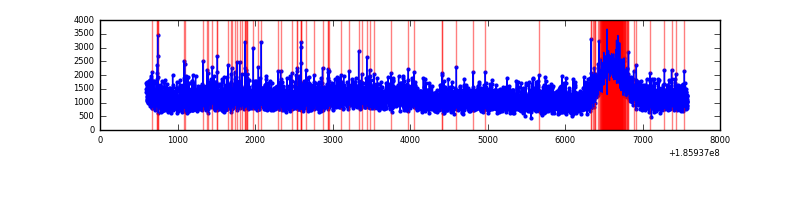 |
| D | 6982 | 6982 | 394 | 394 | 5.64% | 5.64% | 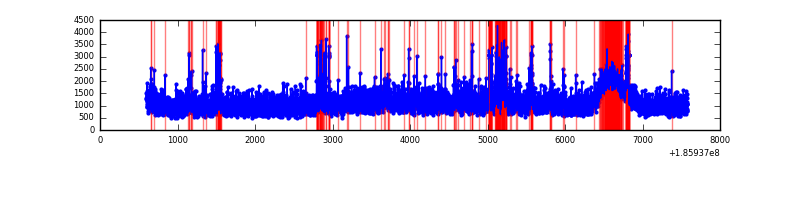 |
Top three noisy pixels from each quadrant. If the there are fewer than three noisy pixels in the level2.evt file, extra rows are filled as -1
| Pixel properties | Quadrant properties | ||||||
|---|---|---|---|---|---|---|---|
| Quadrant | DetID | PixID | Counts | Sigma | Mean | Median | Sigma |
| A | 11 | 79 | 9866 | 14.75 | 2153 | 2168 | 521.7 |
| A | 3 | 111 | 6431 | 8.17 | 2153 | 2168 | 521.7 |
| A | 12 | 189 | 6178 | 7.69 | 2153 | 2168 | 521.7 |
| B | 5 | 65 | 48138 | 86.43 | 2259 | 2269 | 530.7 |
| B | 15 | 255 | 36272 | 64.07 | 2259 | 2269 | 530.7 |
| B | 0 | 220 | 31454 | 54.99 | 2259 | 2269 | 530.7 |
| C | 15 | 241 | 239662 | 413.51 | 2046 | 2117 | 574.5 |
| C | 10 | 34 | 48661 | 81.02 | 2046 | 2117 | 574.5 |
| C | 3 | 111 | 34530 | 56.42 | 2046 | 2117 | 574.5 |
| D | 13 | 200 | 411288 | 672.77 | 1950 | 2021 | 608.3 |
| D | 7 | 207 | 148770 | 241.23 | 1950 | 2021 | 608.3 |
| D | 13 | 13 | 79517 | 127.39 | 1950 | 2021 | 608.3 |
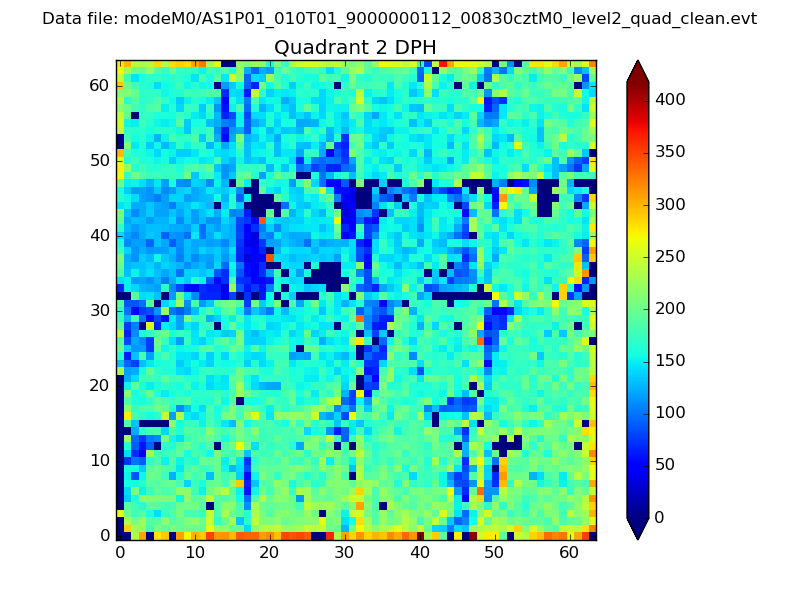
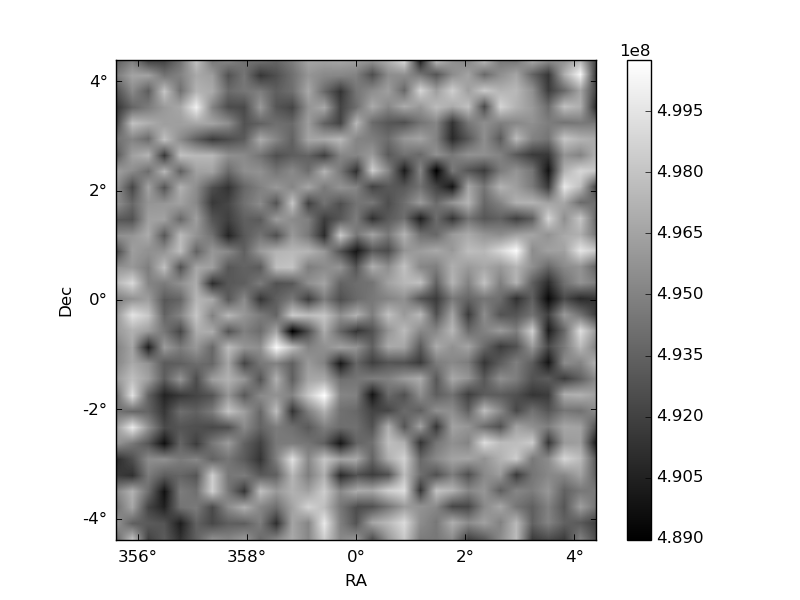
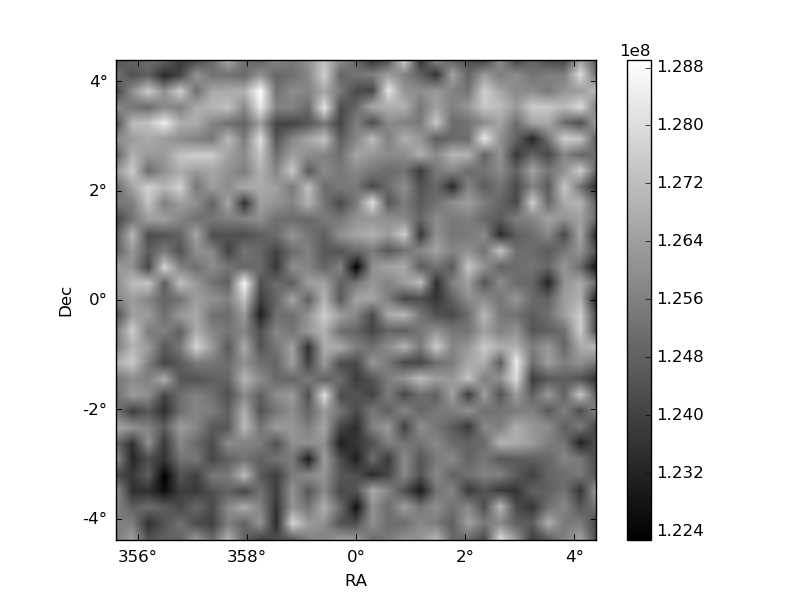
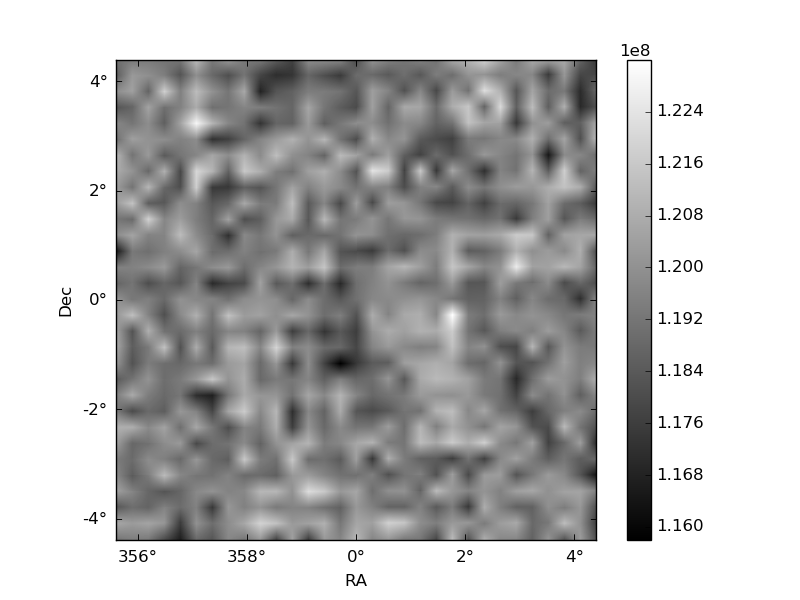
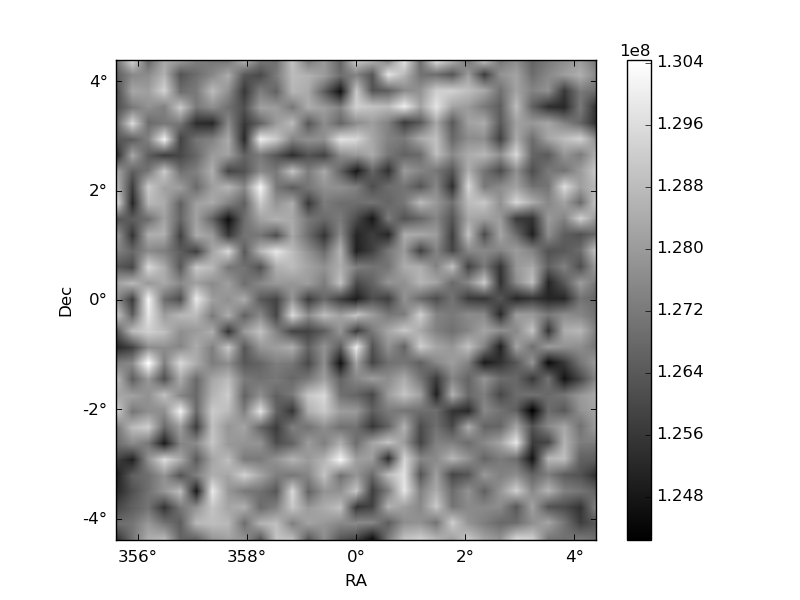
Histogram calculated using DETX and DETY for each event in the final _common_clean file
| Quadrant A | 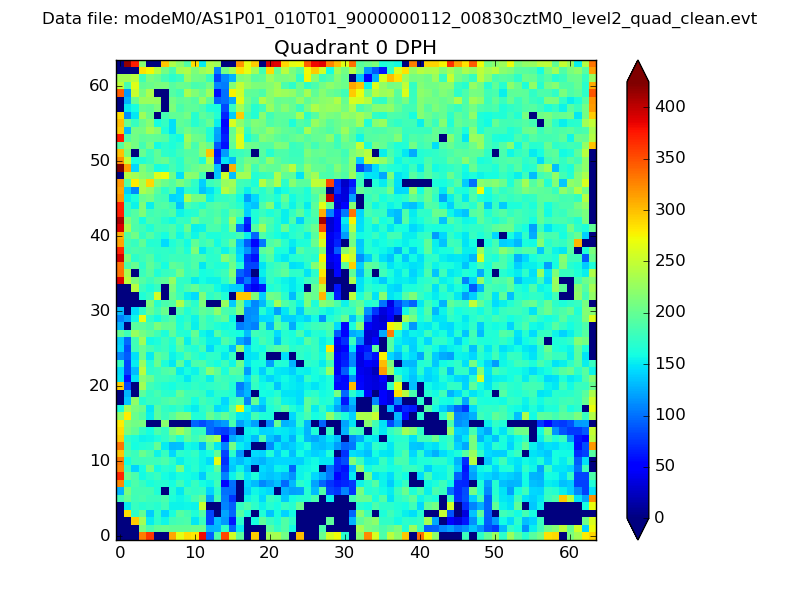 |
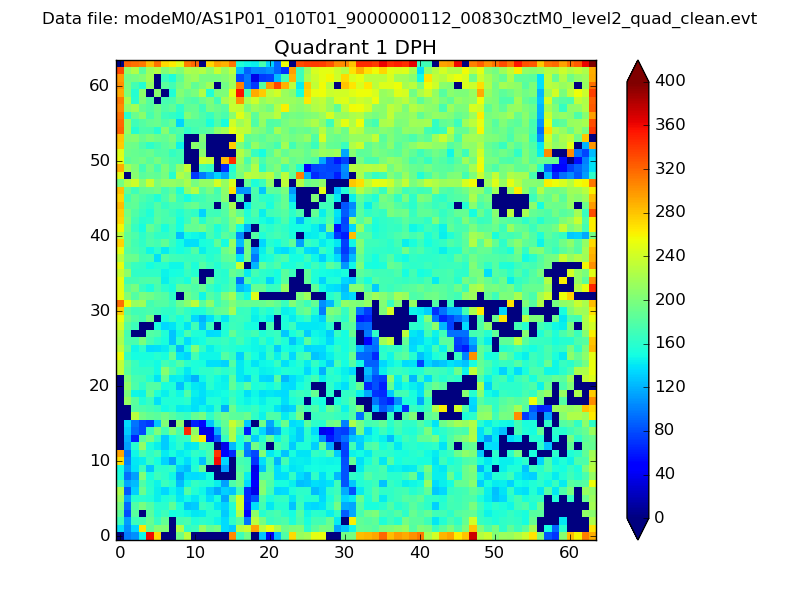 |
Quadrant B |
|---|---|---|---|
| Quadrant D | 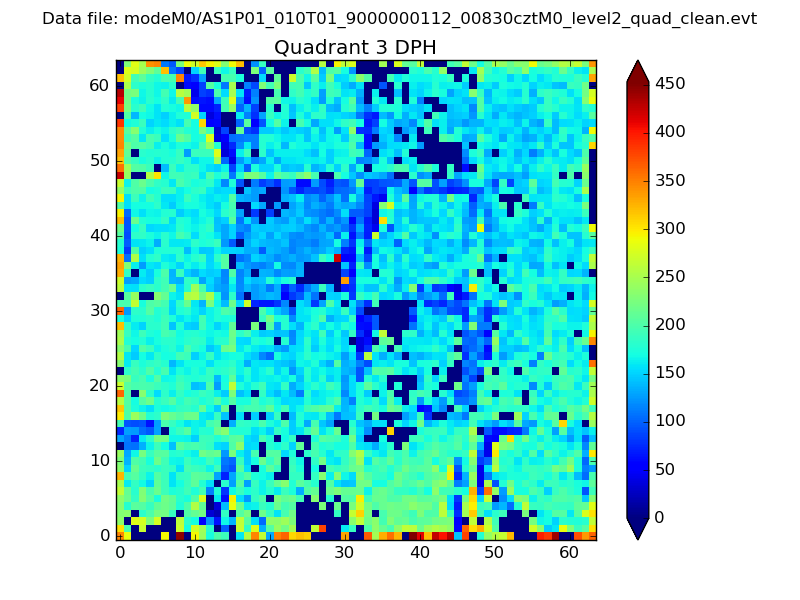 |
 |
Quadrant C |
| Plot type | Count rate plots | Images |
|---|---|---|
| Comparison with Poisson distribution Blue bars denote a histogram of data divided into 1 sec bins. Red curve is a Poisson curve with rate = median count rate of data. |
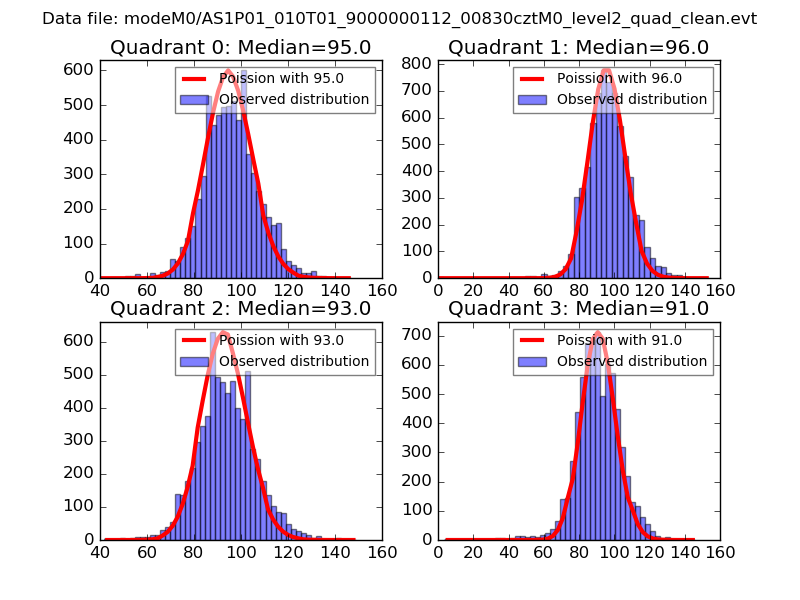 |
 |
| Quadrant-wise count rates Data is divided into 100 sec bins |
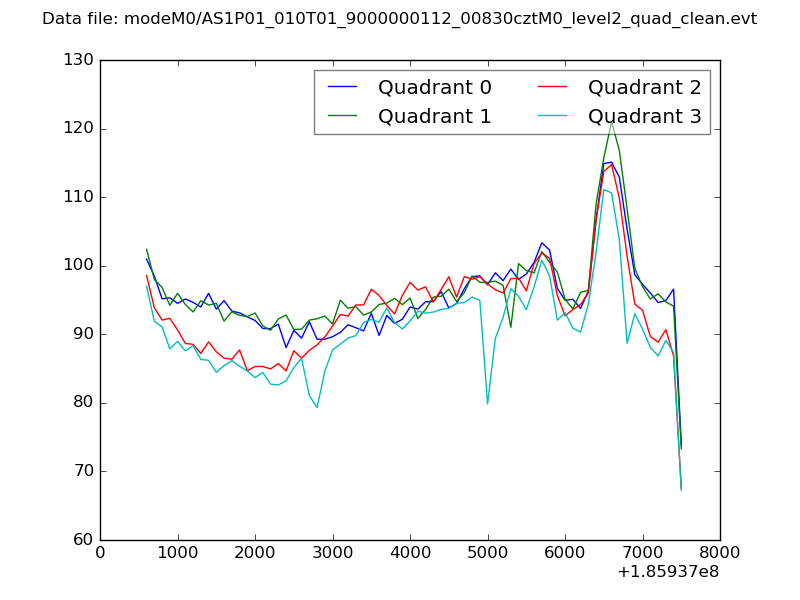 |
|
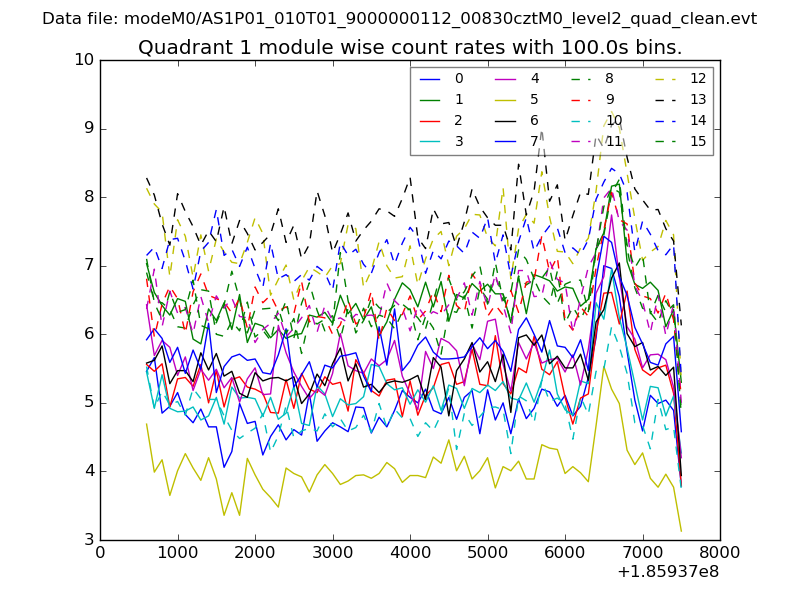
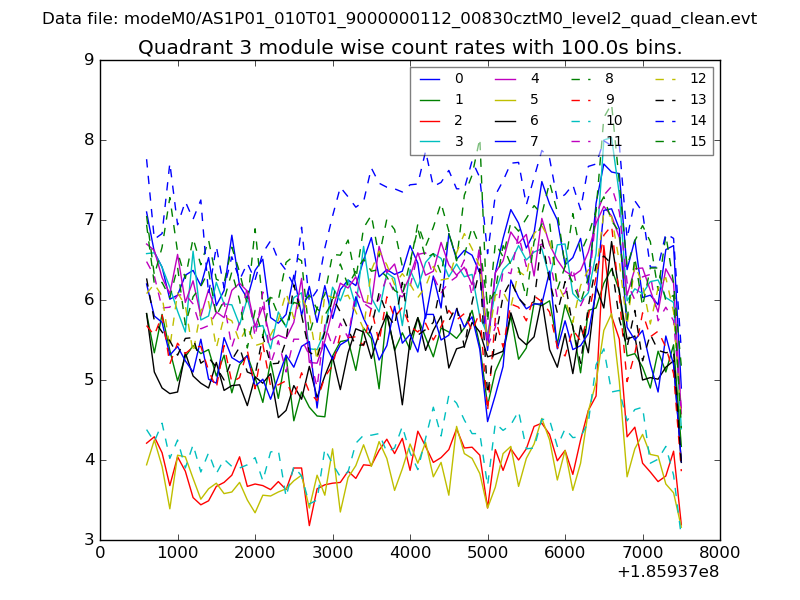
| Module-wise count rates for Quadrant A Data is divided into 100 sec bins |
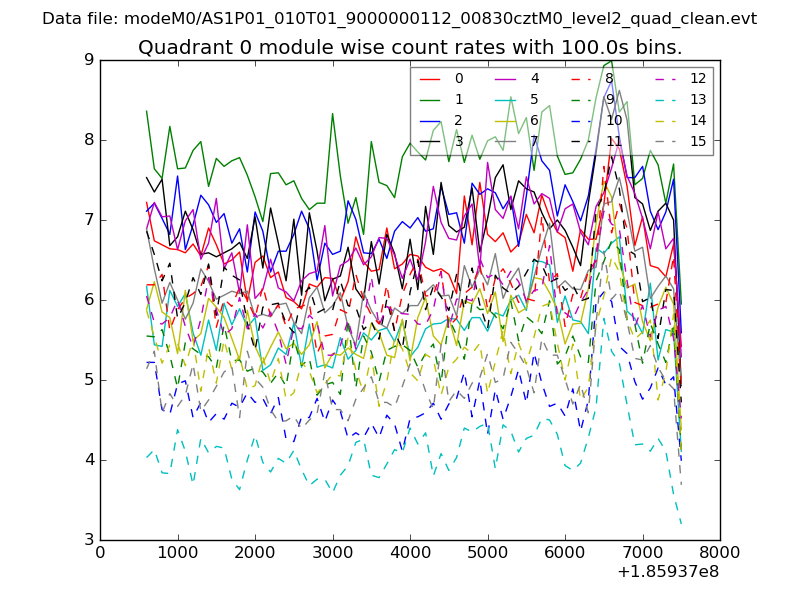 |
 |
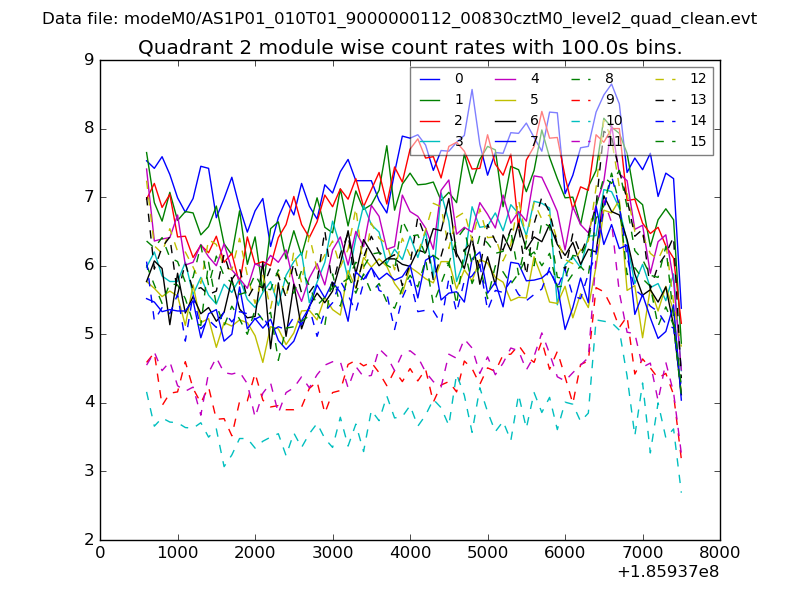
| Module-wise count rates for Quadrant B Data is divided into 100 sec bins |
 |
 |
| Module-wise count rates for Quadrant C Data is divided into 100 sec bins |
 |
 |
| Module-wise count rates for Quadrant D Data is divided into 100 sec bins |
 |
 |
| Parameter | Plot |
|---|---|
| CZT HV Monitor | 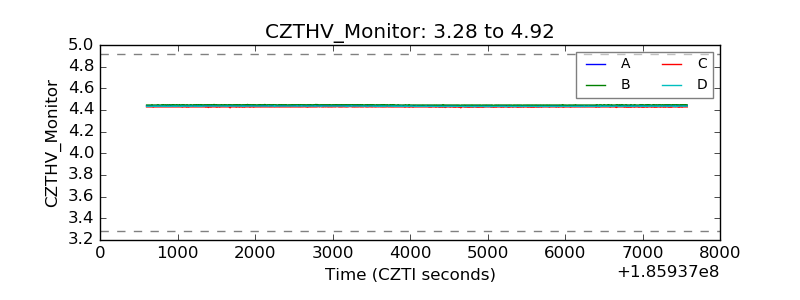 |
| D_VDD | 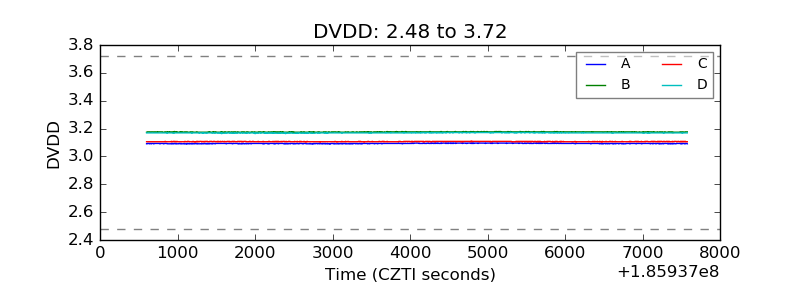 |
| Temperature 1 | 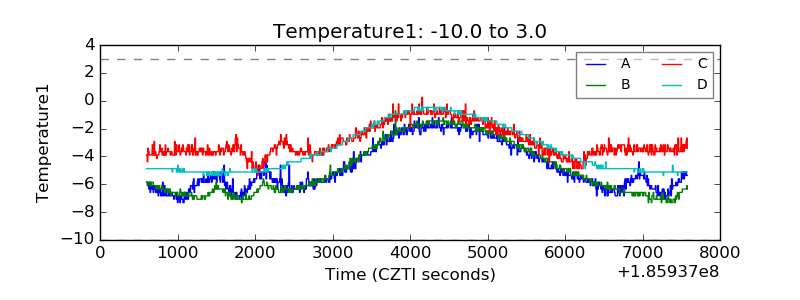 |
| Veto HV Monitor |  |
| Veto LLD | 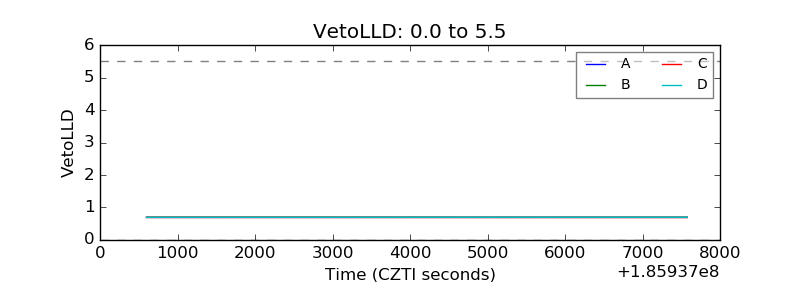 |
| Alpha Counter | 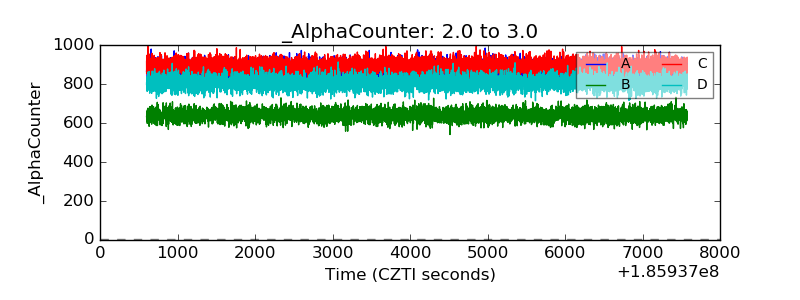 |
| _CPM_Rate | 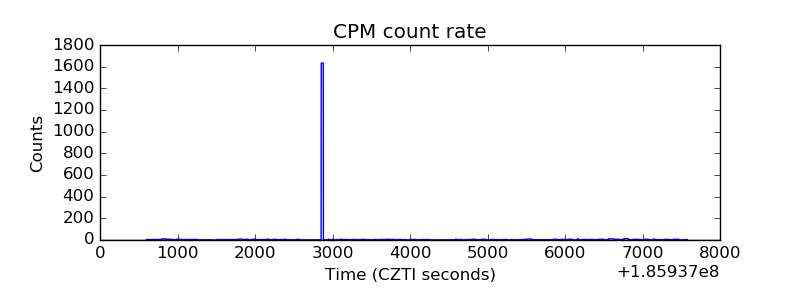 |
| CZT Counter | 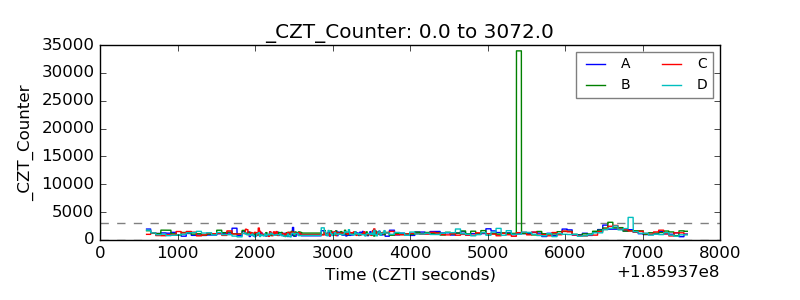 |
| +2.5 Volts monitor |  |
| +5 Volts monitor |  |
| _ROLL_ROT | 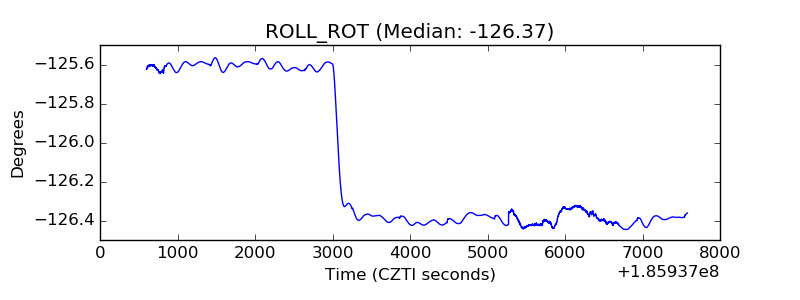 |
| _Roll_DEC | 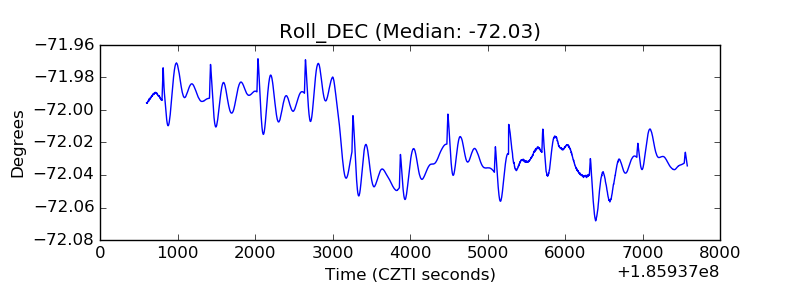 |
| _Roll_RA | 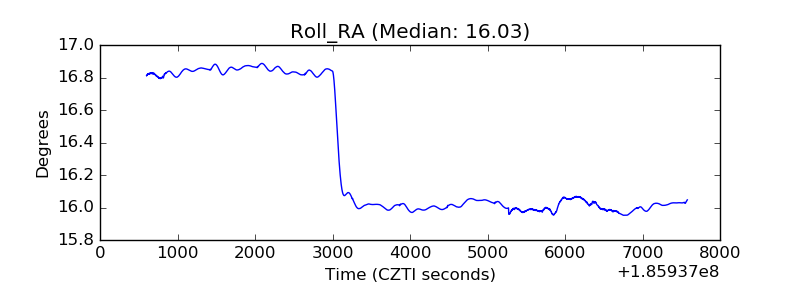 |
| Veto Counter | 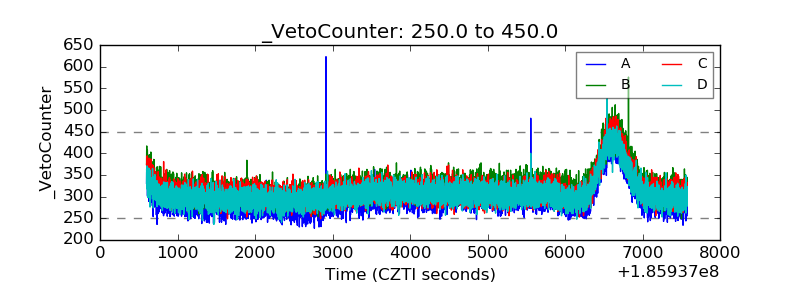 |