| Param | Original file | Final file |
|---|---|---|
| Filename | modeM0/AS1T01_001T01_9000000110cztM0_level2.fits | modeM0/AS1T01_001T01_9000000110cztM0_level2_quad_clean.evt |
| Size (bytes) | 100,854,720 | 129,890,880 |
| Size | 96.2 MB | 123.9 MB |
| Events in quadrant A | 569,786 | 803,694 |
| Events in quadrant B | 572,488 | 806,805 |
| Events in quadrant C | 565,512 | 764,905 |
| Events in quadrant D | 487,258 | 698,777 |
| Mode M0 | |||
|---|---|---|---|
| Quadrant | BADHDUFLAG | Total packets | Discarded packets |
| A | 0 | 54959 | 0 |
| B | 0 | 56062 | 0 |
| C | 0 | 52495 | 0 |
| D | 0 | 51455 | 0 |
| Mode SS | |||
|---|---|---|---|
| Quadrant | BADHDUFLAG | Total packets | Discarded packets |
| A | 0 | 250 | 0 |
| B | 0 | 250 | 0 |
| C | 0 | 250 | 0 |
| D | 0 | 250 | 0 |
| Quadrant | Total seconds | Saturated seconds | Saturation percentage |
|---|---|---|---|
| A | 12424 | 188 | 1.513200% |
| B | 12424 | 141 | 1.134900% |
| C | 12424 | 55 | 0.442692% |
| D | 12424 | 138 | 1.110753% |
Noise dominated data is calculated using 1-second bins in cleaned event files. If a bin has >2000 counts, and if more than 50% of those come from <1% of pixels, then it is considered to be noise-dominated and hence unusable.
| Quadrant | # 1 sec bins | Bins with >0 counts | Bins with >2000 counts | High rate bins dominated by noise | Noise dominated (total time) | Noise dominated (detector-on time) | Marked lightcurve |
|---|---|---|---|---|---|---|---|
| A | 12488 | 12423 | 0 | 0 | 0.00% | 0.00% | 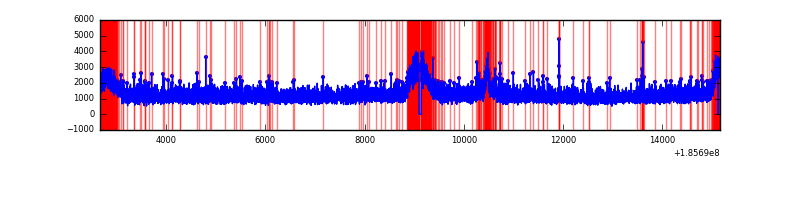 |
| B | 12488 | 12423 | 0 | 0 | 0.00% | 0.00% | 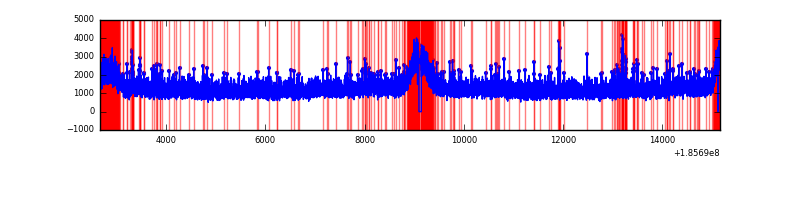 |
| C | 12489 | 12424 | 0 | 0 | 0.00% | 0.00% | 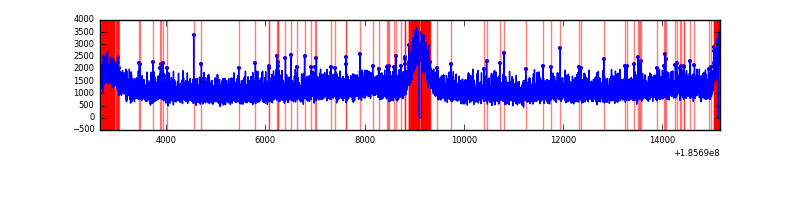 |
| D | 12489 | 12424 | 0 | 0 | 0.00% | 0.00% | 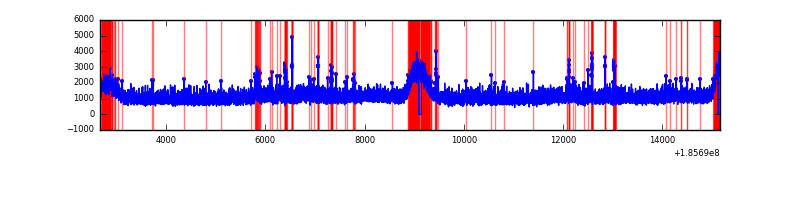 |
Top three noisy pixels from each quadrant. If the there are fewer than three noisy pixels in the level2.evt file, extra rows are filled as -1
| Pixel properties | Quadrant properties | ||||||
|---|---|---|---|---|---|---|---|
| Quadrant | DetID | PixID | Counts | Sigma | Mean | Median | Sigma |
| A | 0 | 29 | 522 | 10.16 | 148 | 138 | 37.8 |
| A | 7 | 110 | 493 | 9.39 | 148 | 138 | 37.8 |
| A | 14 | 188 | 411 | 7.22 | 148 | 138 | 37.8 |
| B | 2 | 9 | 456 | 10.38 | 151 | 143 | 30.1 |
| B | 5 | 128 | 401 | 8.56 | 151 | 143 | 30.1 |
| B | 2 | 8 | 370 | 7.53 | 151 | 143 | 30.1 |
| C | 12 | 241 | 402 | 6.72 | 149 | 138 | 39.3 |
| C | 9 | 242 | 365 | 5.78 | 149 | 138 | 39.3 |
| C | 3 | 235 | 356 | 5.55 | 149 | 138 | 39.3 |
| D | 6 | 44 | 386 | 7.22 | 139 | 127 | 35.9 |
| D | 3 | 14 | 372 | 6.83 | 139 | 127 | 35.9 |
| D | 6 | 231 | 340 | 5.94 | 139 | 127 | 35.9 |
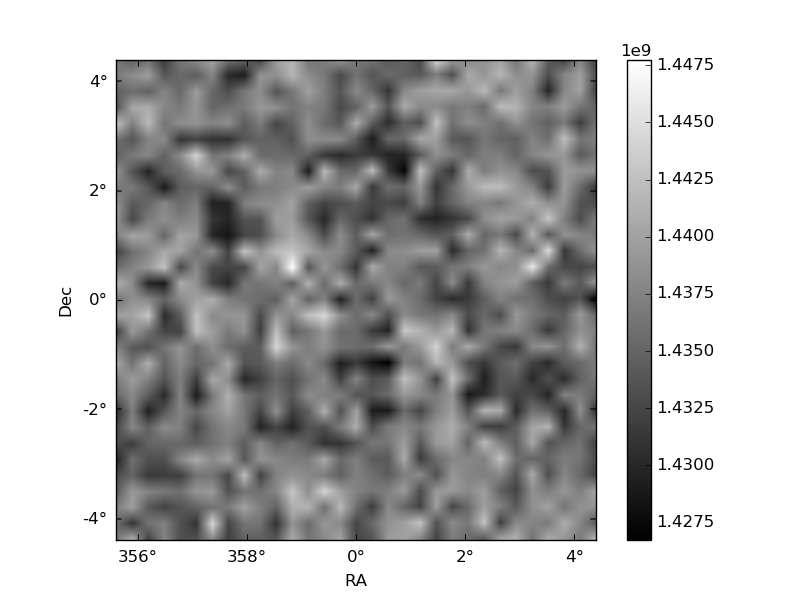
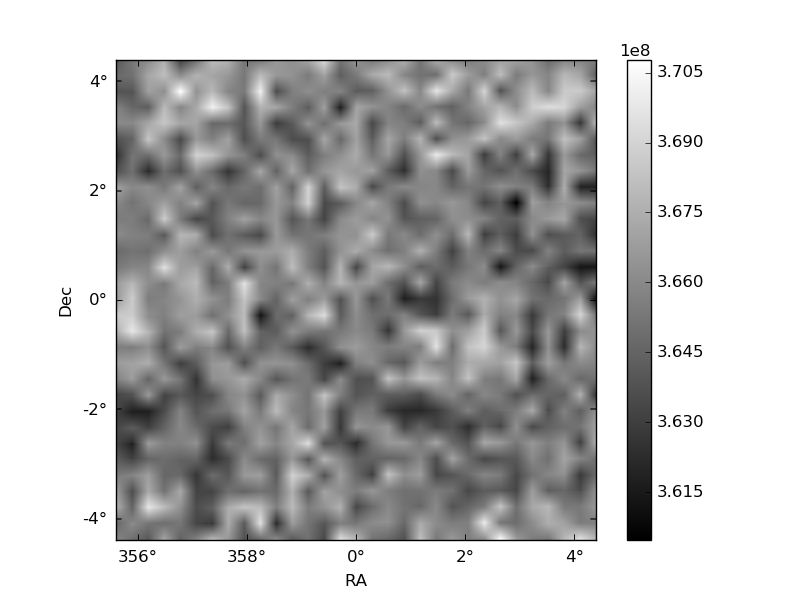
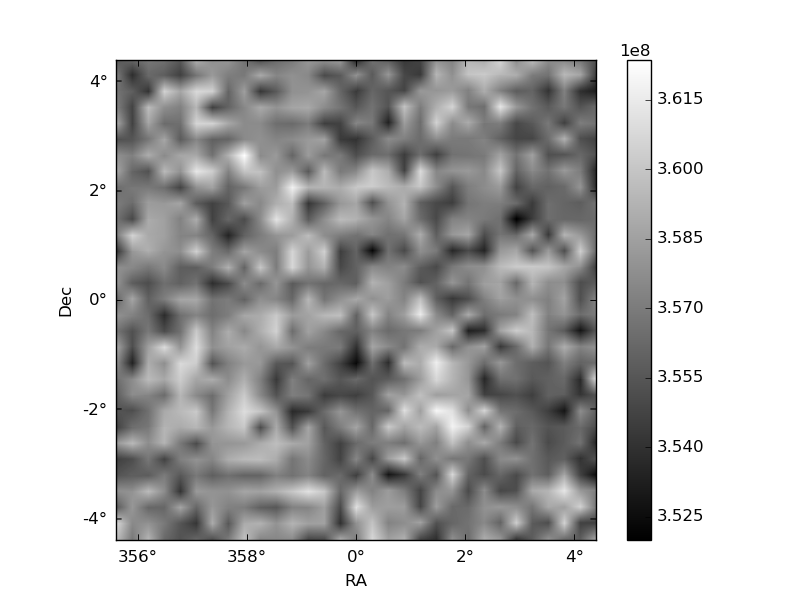
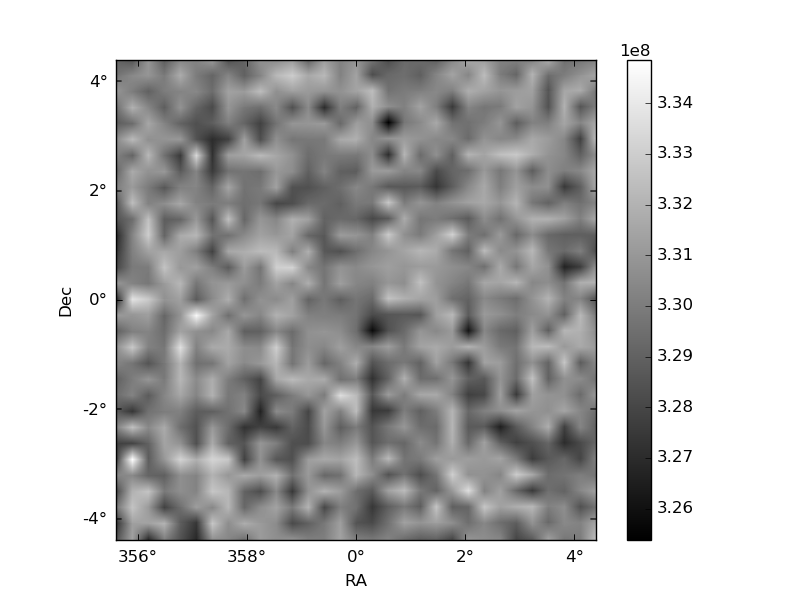
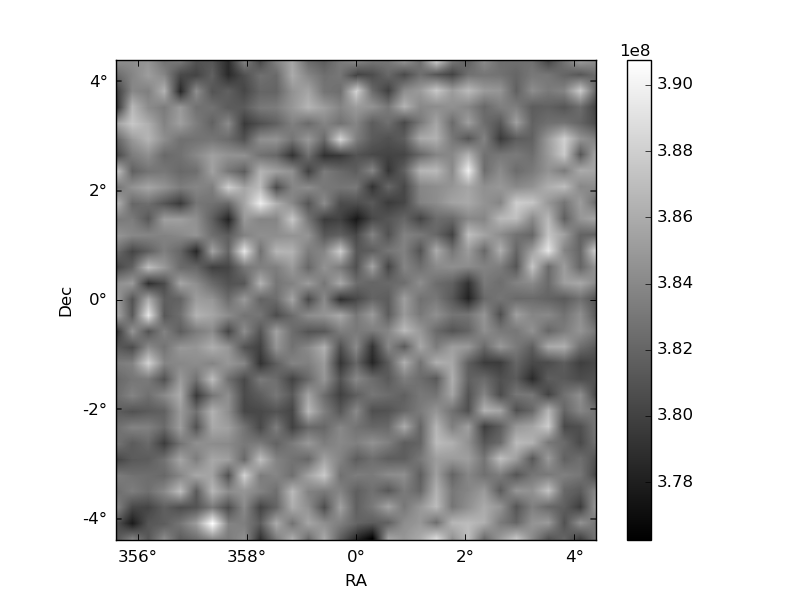
Histogram calculated using DETX and DETY for each event in the final _common_clean file
| Quadrant A | 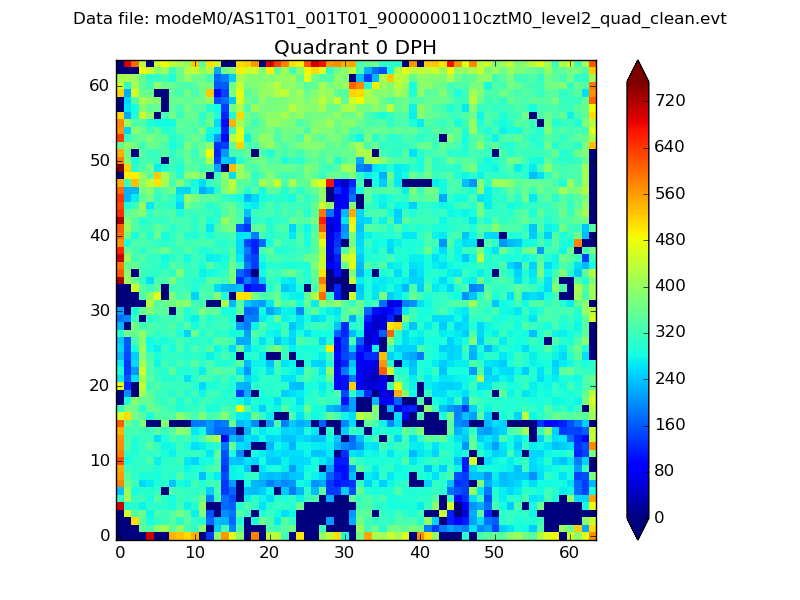 |
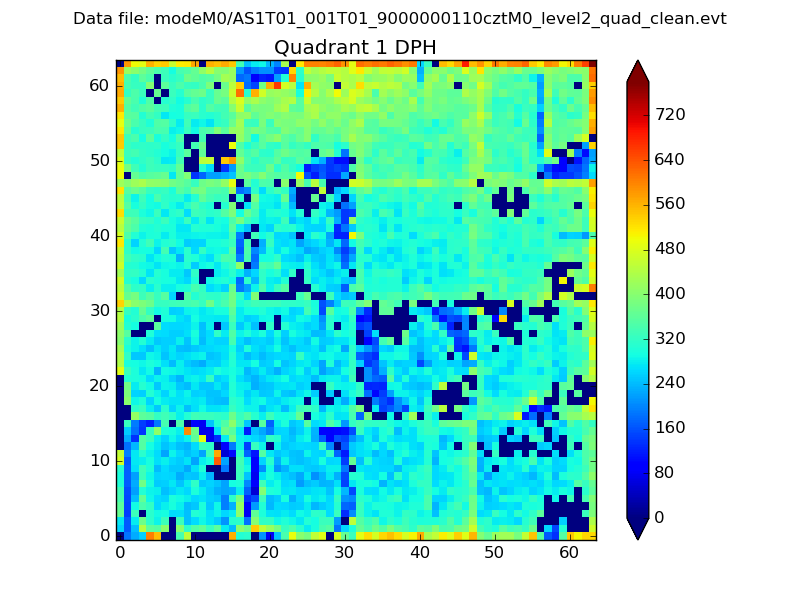 |
Quadrant B |
|---|---|---|---|
| Quadrant D | 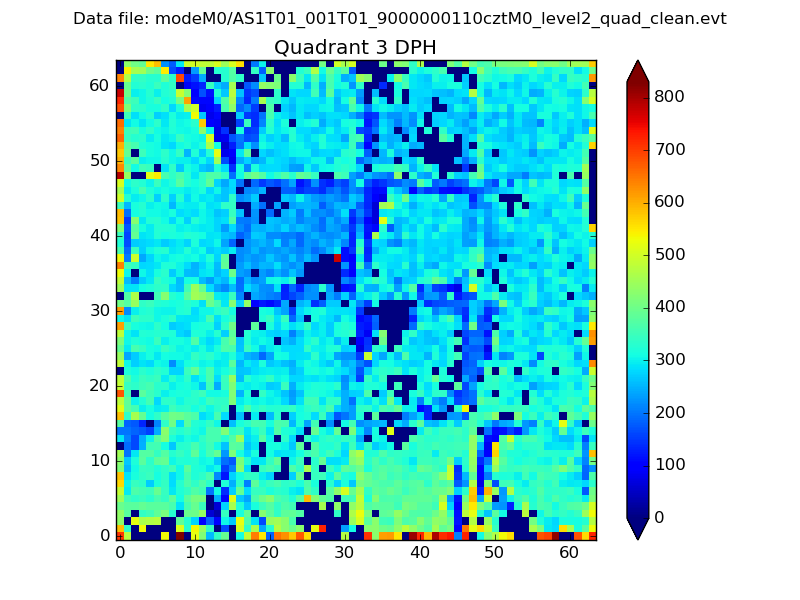 |
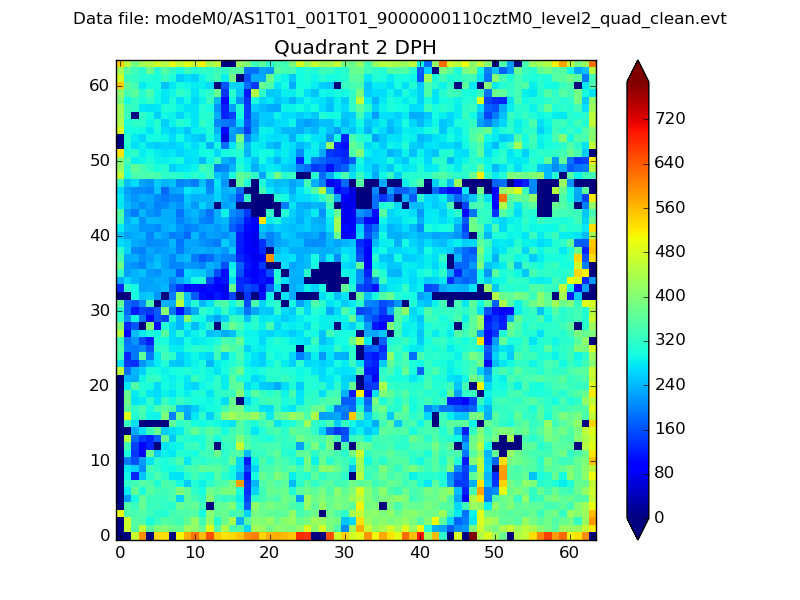 |
Quadrant C |
| Plot type | Count rate plots | Images |
|---|---|---|
| Comparison with Poisson distribution Blue bars denote a histogram of data divided into 1 sec bins. Red curve is a Poisson curve with rate = median count rate of data. |
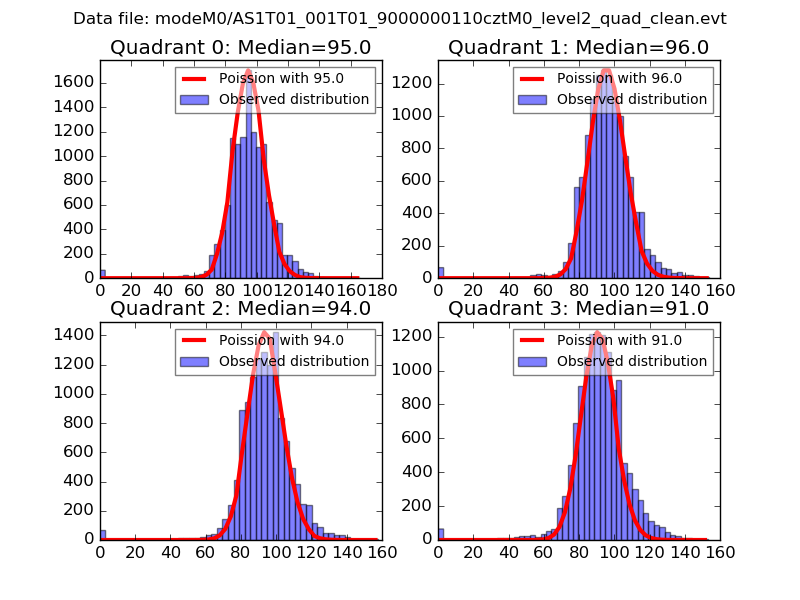 |
 |
| Quadrant-wise count rates Data is divided into 100 sec bins |
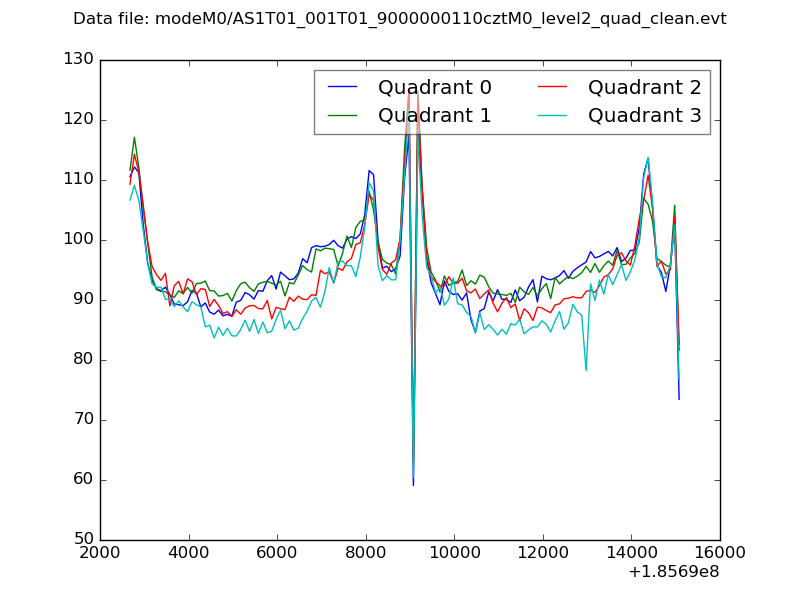 |
|
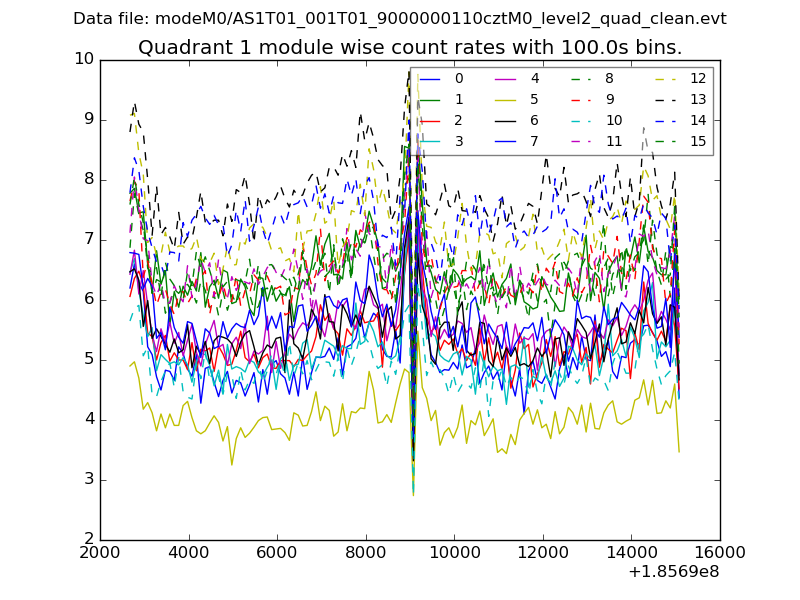
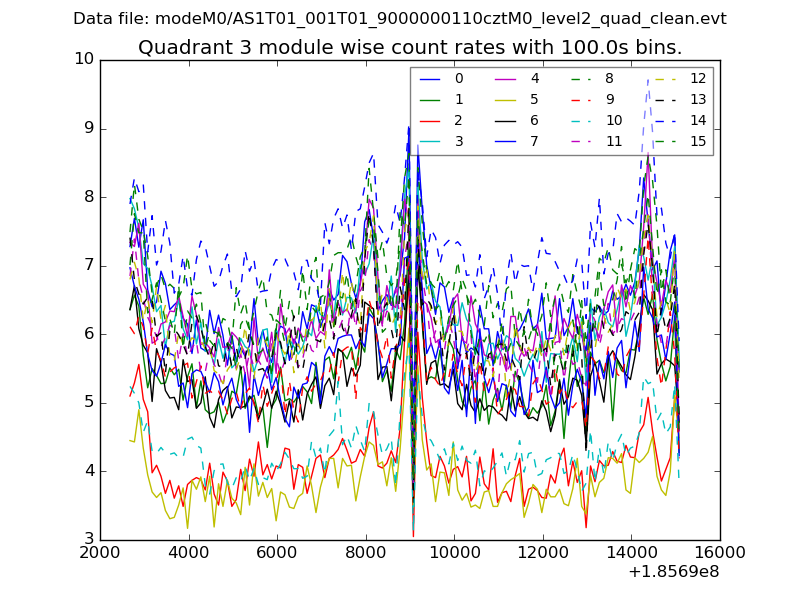
| Module-wise count rates for Quadrant A Data is divided into 100 sec bins |
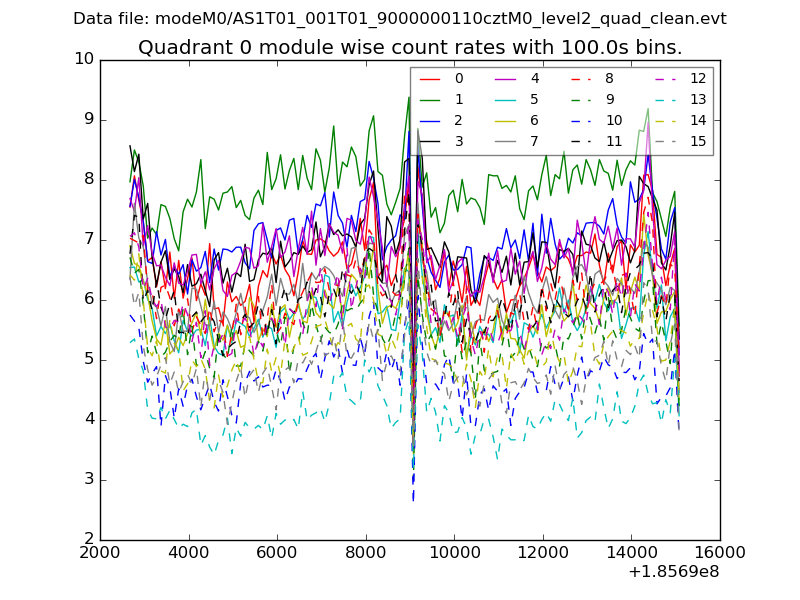 |
 |
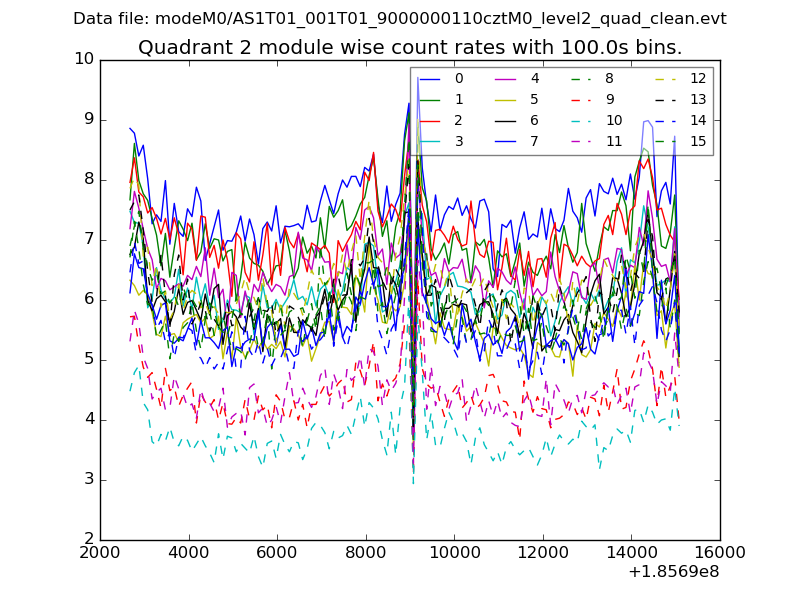
| Module-wise count rates for Quadrant B Data is divided into 100 sec bins |
 |
 |
| Module-wise count rates for Quadrant C Data is divided into 100 sec bins |
 |
 |
| Module-wise count rates for Quadrant D Data is divided into 100 sec bins |
 |
 |
| Parameter | Plot |
|---|---|
| CZT HV Monitor | 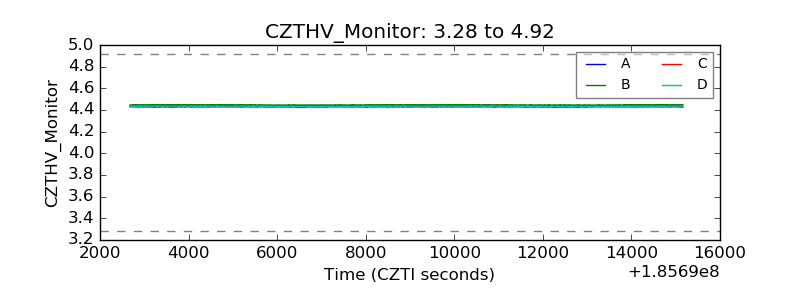 |
| D_VDD | 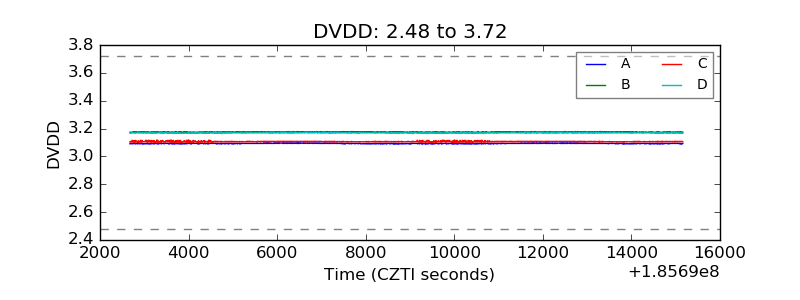 |
| Temperature 1 | 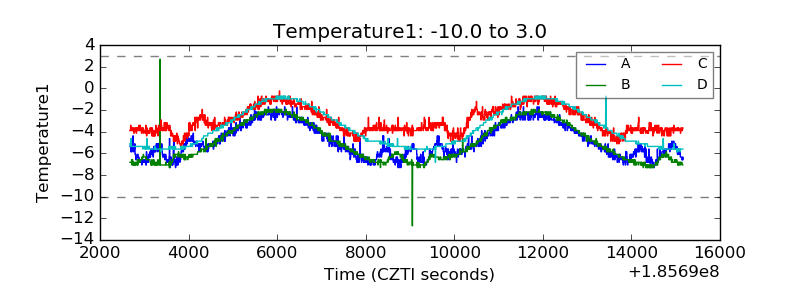 |
| Veto HV Monitor | 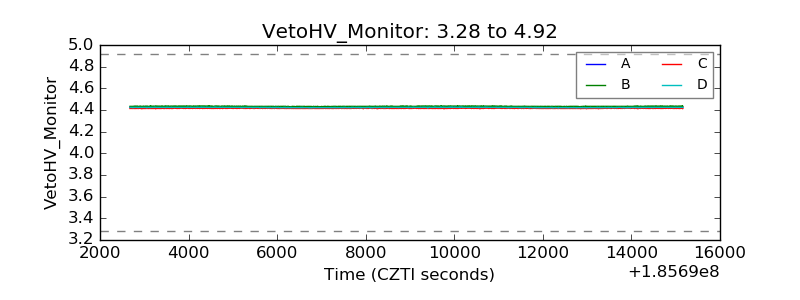 |
| Veto LLD | 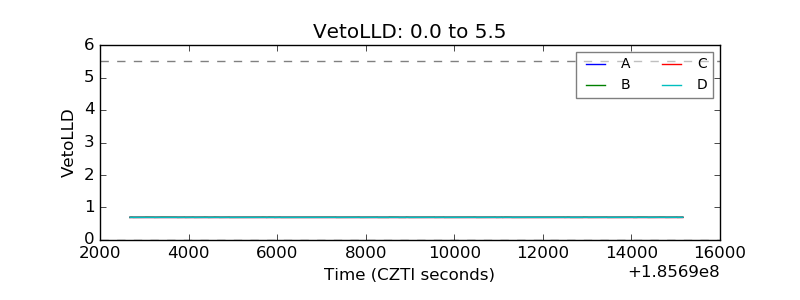 |
| Alpha Counter | 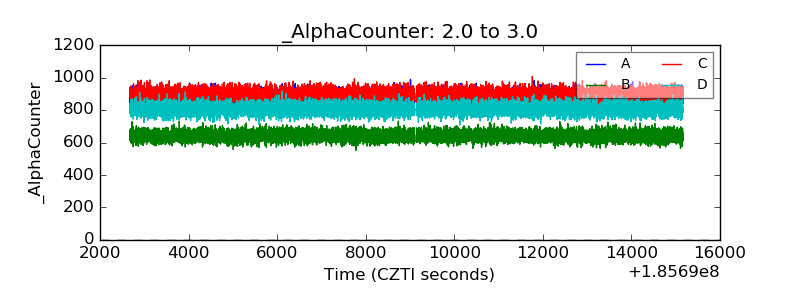 |
| _CPM_Rate | 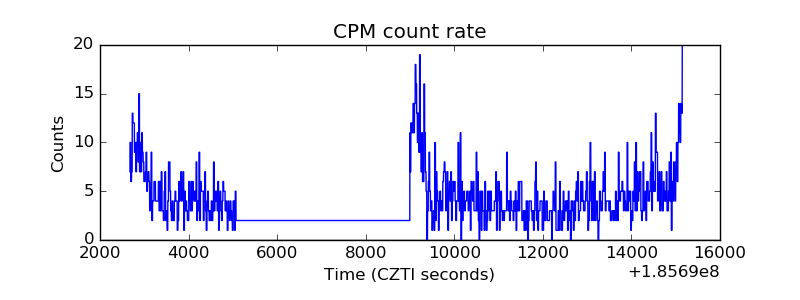 |
| CZT Counter | 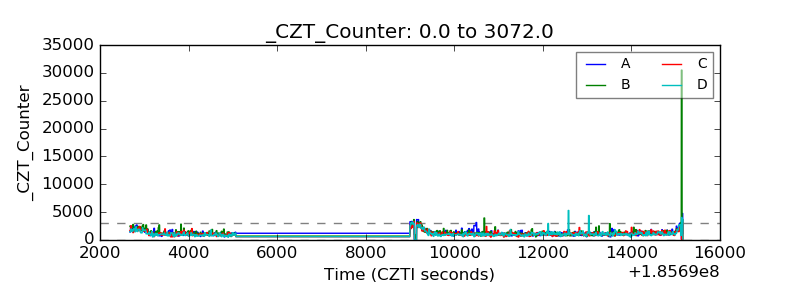 |
| +2.5 Volts monitor | 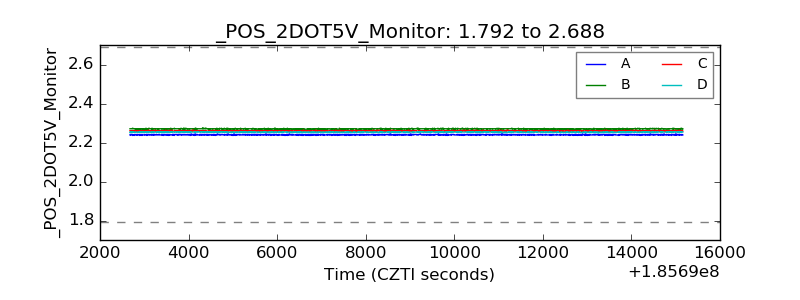 |
| +5 Volts monitor | 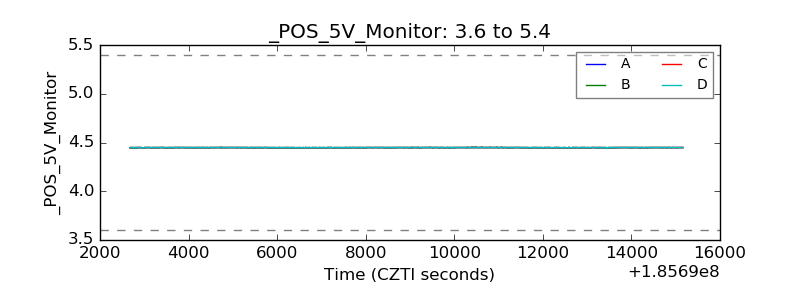 |
| _ROLL_ROT | 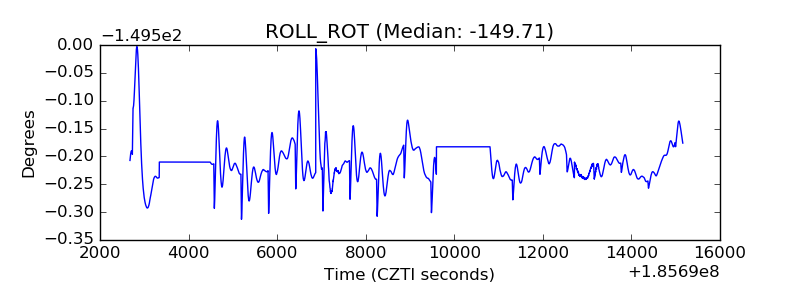 |
| _Roll_DEC | 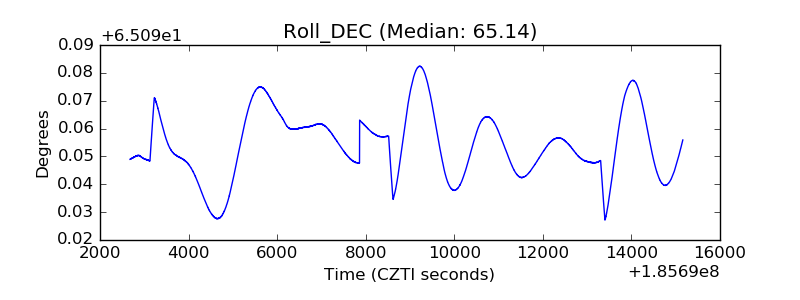 |
| _Roll_RA | 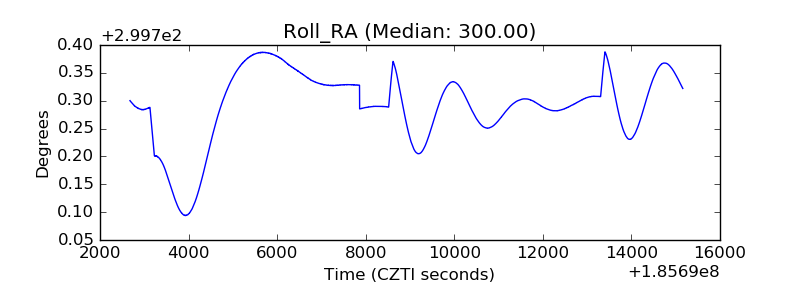 |
| Veto Counter | 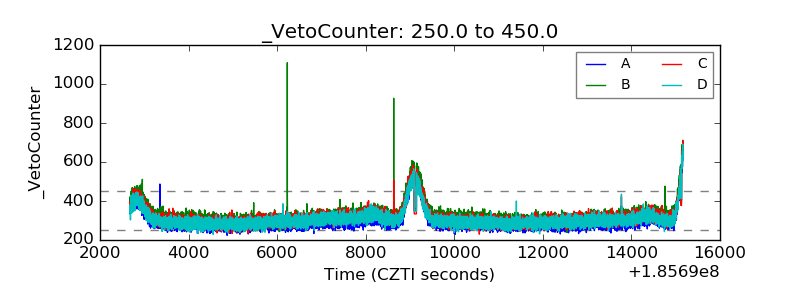 |