| Param | Original file | Final file |
|---|---|---|
| Filename | modeM0/AS1T01_001T01_9000000110_00787cztM0_level2.evt | modeM0/AS1T01_001T01_9000000110_00787cztM0_level2_quad_clean.evt |
| Size (bytes) | 1,201,668,480 | 109,388,160 |
| Size | 1.1 GB | 104.3 MB |
| Events in quadrant A | 9,360,091 | 703,451 |
| Events in quadrant B | 9,413,041 | 712,770 |
| Events in quadrant C | 8,657,012 | 699,581 |
| Events in quadrant D | 8,470,760 | 680,221 |
| Mode M0 | |||
|---|---|---|---|
| Quadrant | BADHDUFLAG | Total packets | Discarded packets |
| A | 0 | 33027 | 0 |
| B | 0 | 33230 | 0 |
| C | 0 | 31003 | 0 |
| D | 0 | 30411 | 0 |
| Mode SS | |||
|---|---|---|---|
| Quadrant | BADHDUFLAG | Total packets | Discarded packets |
| A | 0 | 150 | 0 |
| B | 0 | 150 | 0 |
| C | 0 | 150 | 0 |
| D | 0 | 150 | 0 |
| Quadrant | Total seconds | Saturated seconds | Saturation percentage |
|---|---|---|---|
| A | 7419 | 126 | 1.698342% |
| B | 7419 | 80 | 1.078312% |
| C | 7420 | 31 | 0.417790% |
| D | 7420 | 61 | 0.822102% |
Noise dominated data is calculated using 1-second bins in cleaned event files. If a bin has >2000 counts, and if more than 50% of those come from <1% of pixels, then it is considered to be noise-dominated and hence unusable.
| Quadrant | # 1 sec bins | Bins with >0 counts | Bins with >2000 counts | High rate bins dominated by noise | Noise dominated (total time) | Noise dominated (detector-on time) | Marked lightcurve |
|---|---|---|---|---|---|---|---|
| A | 7469 | 7420 | 519 | 519 | 6.95% | 6.99% | 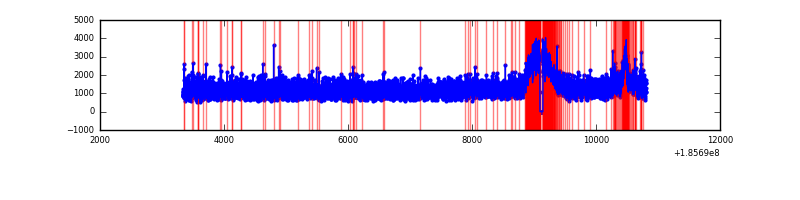 |
| B | 7469 | 7420 | 447 | 447 | 5.98% | 6.02% | 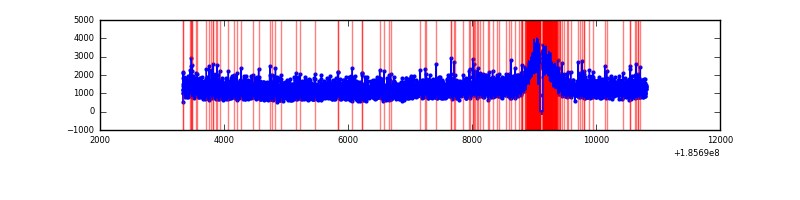 |
| C | 7470 | 7421 | 311 | 311 | 4.16% | 4.19% | 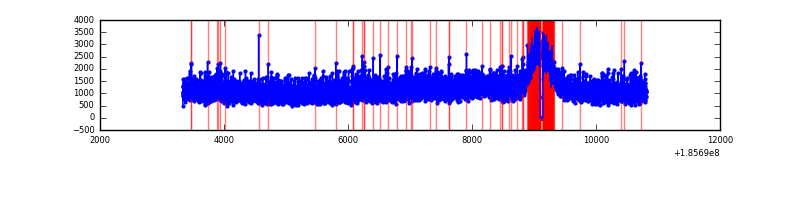 |
| D | 7470 | 7421 | 372 | 372 | 4.98% | 5.01% | 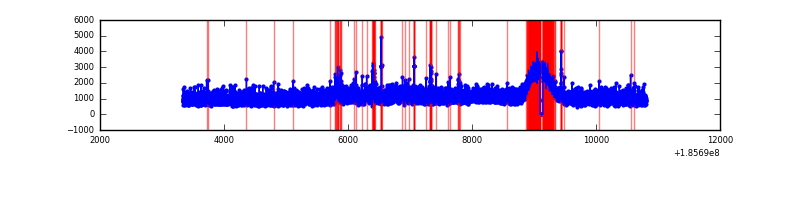 |
Top three noisy pixels from each quadrant. If the there are fewer than three noisy pixels in the level2.evt file, extra rows are filled as -1
| Pixel properties | Quadrant properties | ||||||
|---|---|---|---|---|---|---|---|
| Quadrant | DetID | PixID | Counts | Sigma | Mean | Median | Sigma |
| A | 8 | 192 | 253699 | 437.81 | 2363 | 2383 | 574.0 |
| A | 10 | 133 | 22183 | 34.49 | 2363 | 2383 | 574.0 |
| A | 12 | 236 | 18899 | 28.77 | 2363 | 2383 | 574.0 |
| B | 0 | 23 | 36163 | 58.36 | 2435 | 2446 | 577.7 |
| B | 15 | 22 | 32031 | 51.21 | 2435 | 2446 | 577.7 |
| B | 8 | 234 | 31320 | 49.98 | 2435 | 2446 | 577.7 |
| C | 9 | 83 | 57247 | 90.83 | 2171 | 2242 | 605.6 |
| C | 15 | 241 | 48013 | 75.58 | 2171 | 2242 | 605.6 |
| C | 3 | 111 | 39695 | 61.84 | 2171 | 2242 | 605.6 |
| D | 1 | 4 | 347298 | 515.69 | 2132 | 2209 | 669.2 |
| D | 13 | 25 | 75136 | 108.98 | 2132 | 2209 | 669.2 |
| D | 9 | 41 | 25981 | 35.52 | 2132 | 2209 | 669.2 |
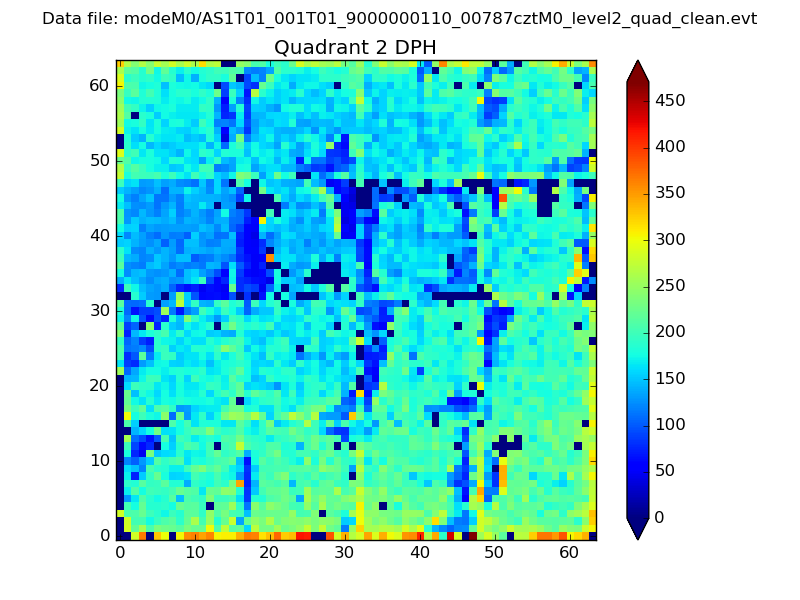
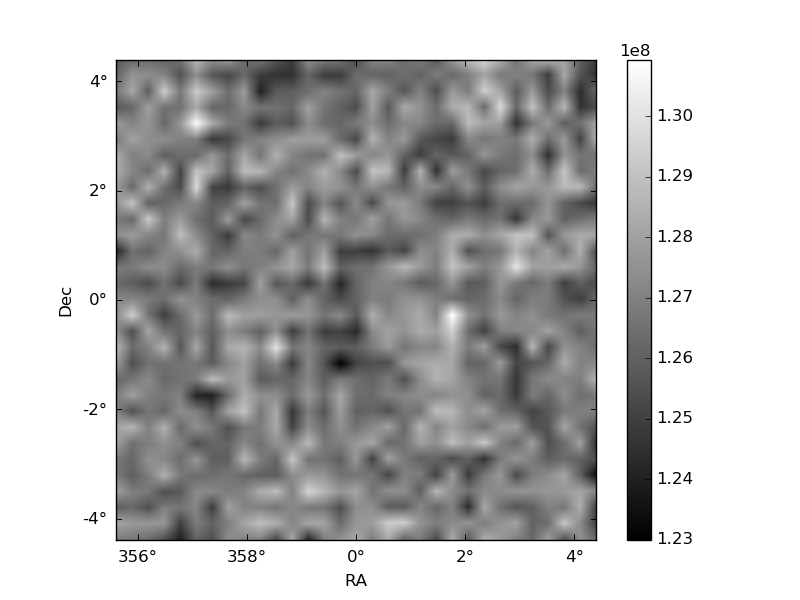
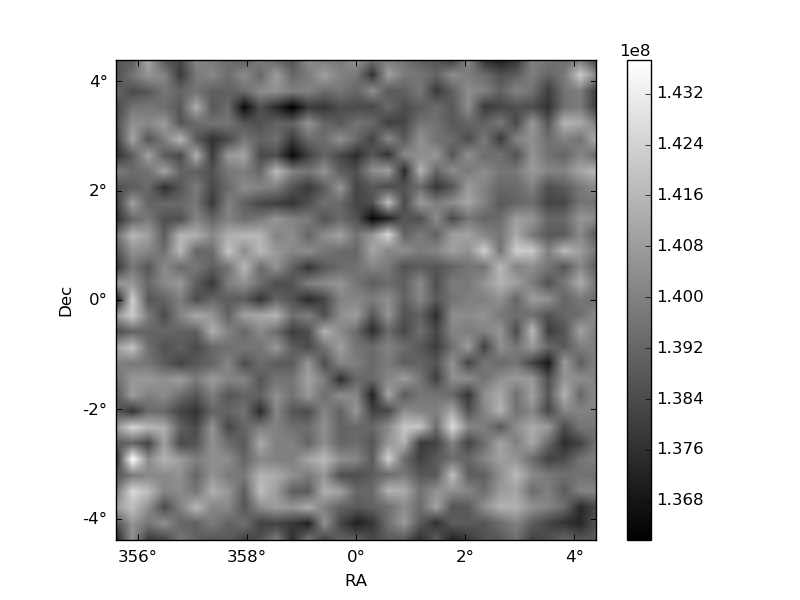
Histogram calculated using DETX and DETY for each event in the final _common_clean file
| Quadrant A | 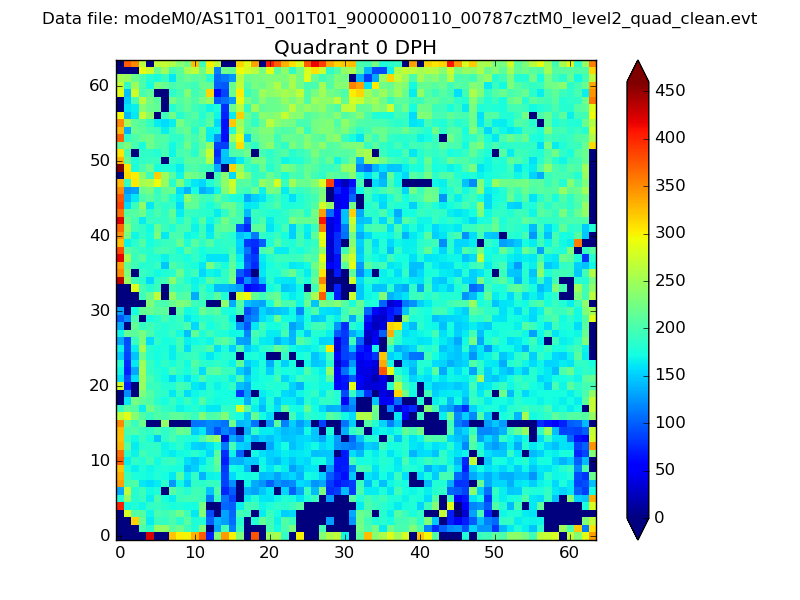 |
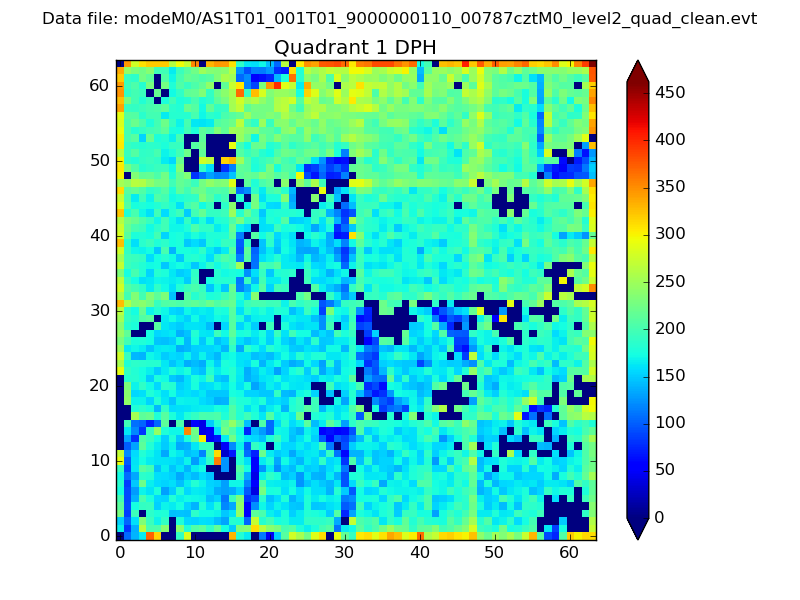 |
Quadrant B |
|---|---|---|---|
| Quadrant D | 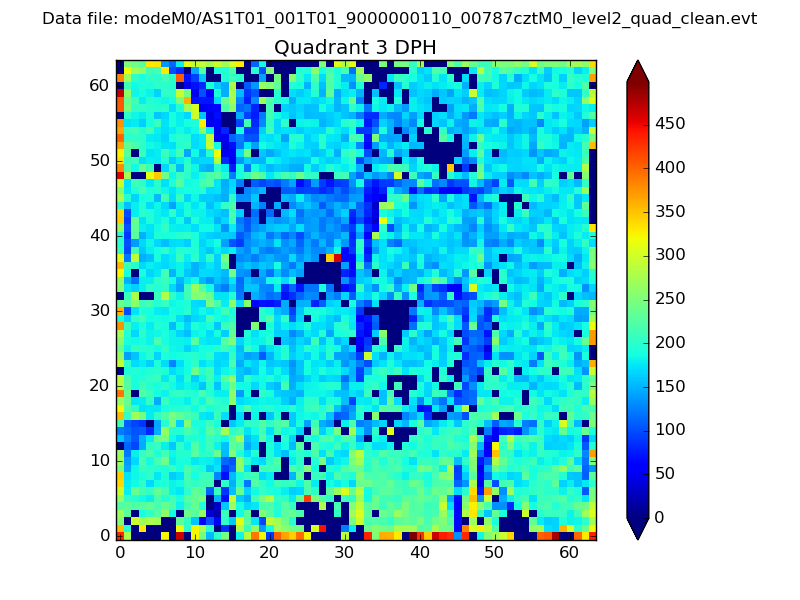 |
 |
Quadrant C |
| Plot type | Count rate plots | Images |
|---|---|---|
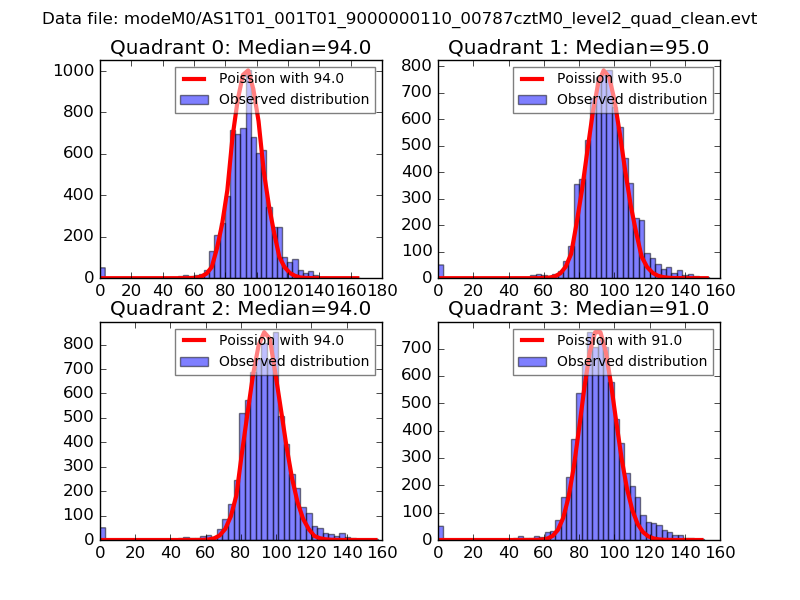
| Comparison with Poisson distribution Blue bars denote a histogram of data divided into 1 sec bins. Red curve is a Poisson curve with rate = median count rate of data. |
 |
 |
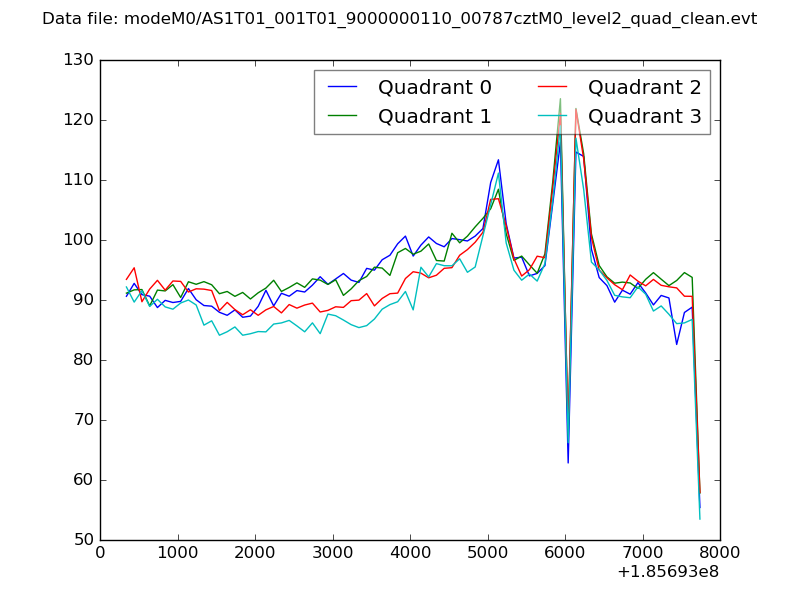
| Quadrant-wise count rates Data is divided into 100 sec bins |
 |
|
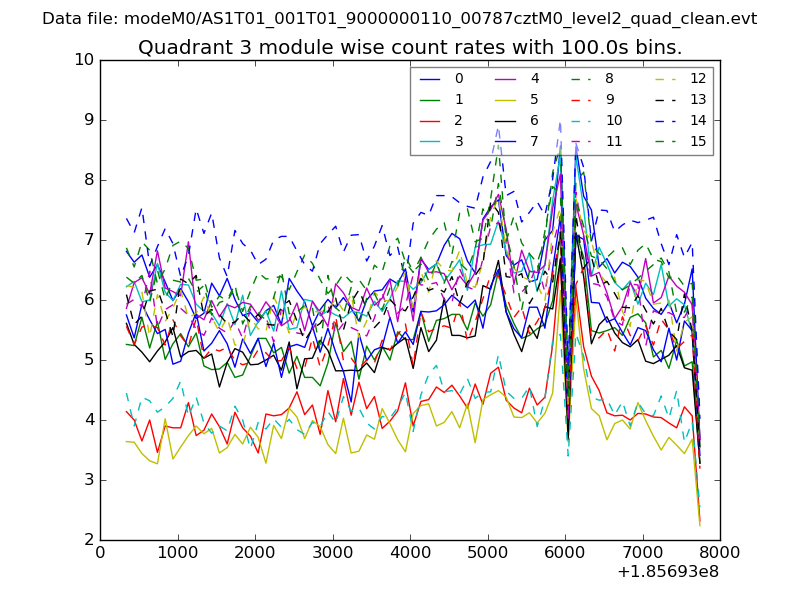
| Module-wise count rates for Quadrant A Data is divided into 100 sec bins |
 |
 |
| Module-wise count rates for Quadrant B Data is divided into 100 sec bins |
 |
 |
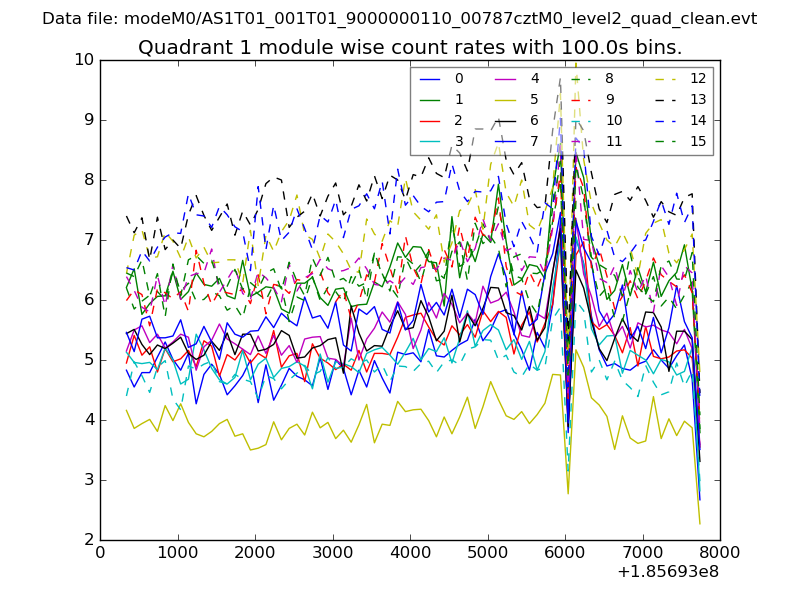
| Module-wise count rates for Quadrant C Data is divided into 100 sec bins |
 |
 |
| Module-wise count rates for Quadrant D Data is divided into 100 sec bins |
 |
 |
| Parameter | Plot |
|---|---|
| CZT HV Monitor | 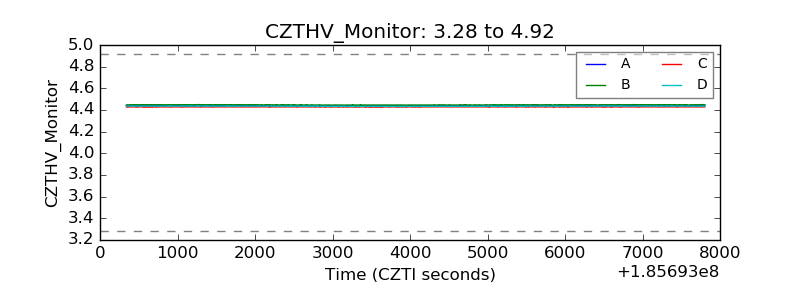 |
| D_VDD |  |
| Temperature 1 | 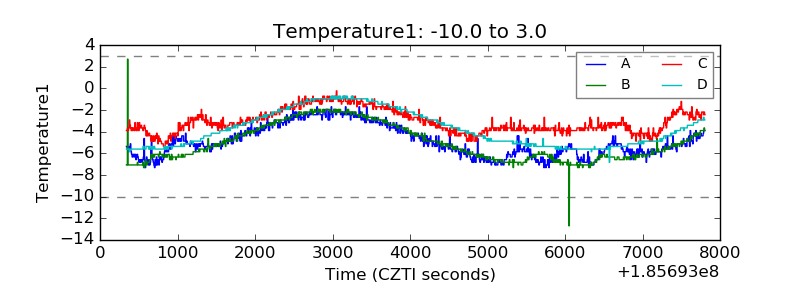 |
| Veto HV Monitor | 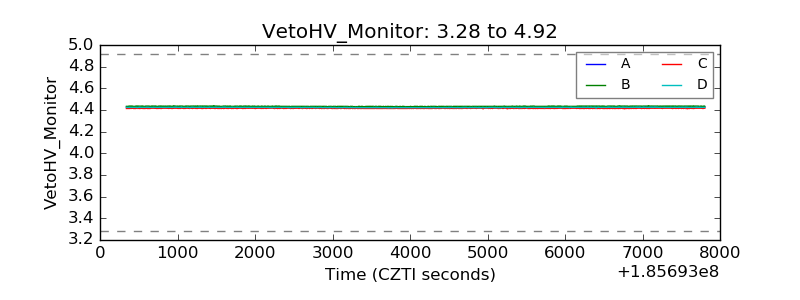 |
| Veto LLD |  |
| Alpha Counter | 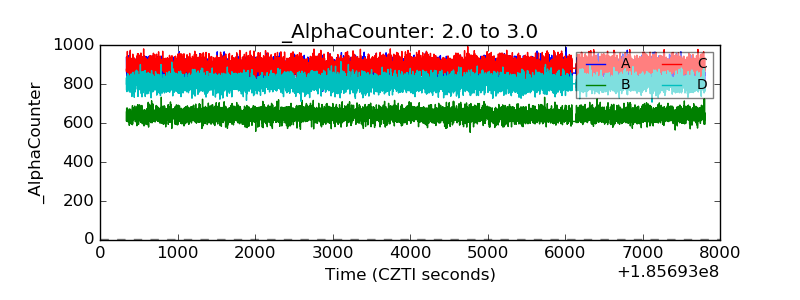 |
| _CPM_Rate | 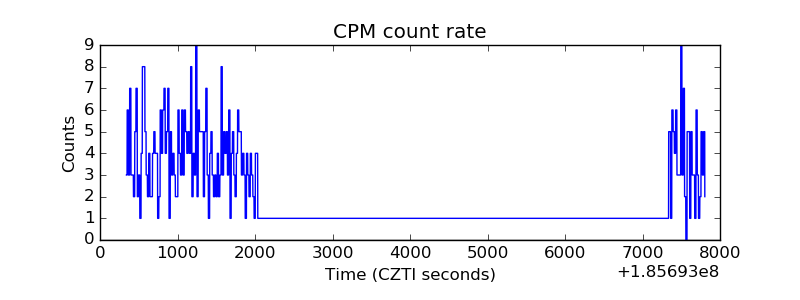 |
| CZT Counter | 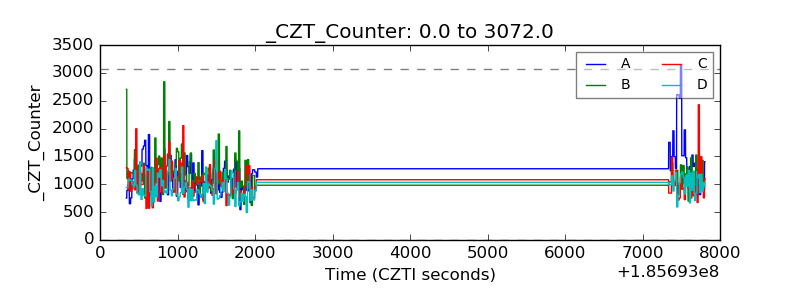 |
| +2.5 Volts monitor |  |
| +5 Volts monitor |  |
| _ROLL_ROT |  |
| _Roll_DEC | 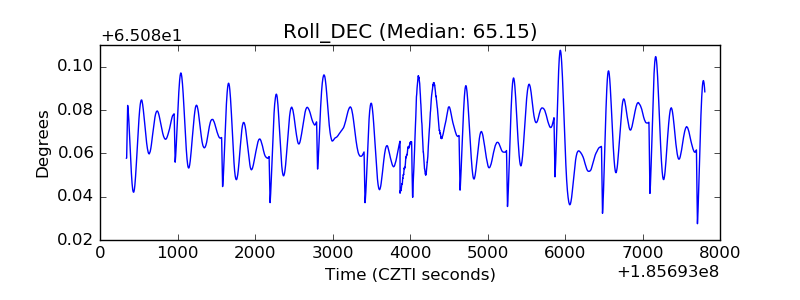 |
| _Roll_RA | 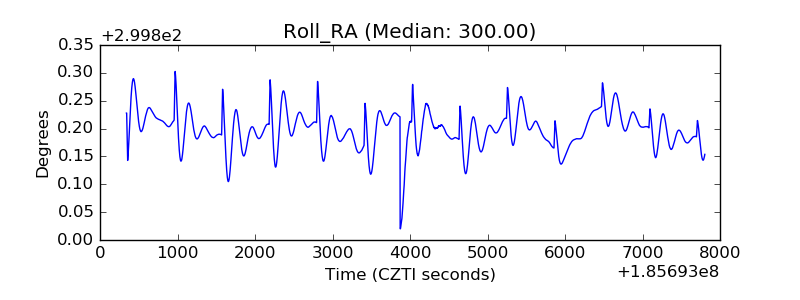 |
| Veto Counter | 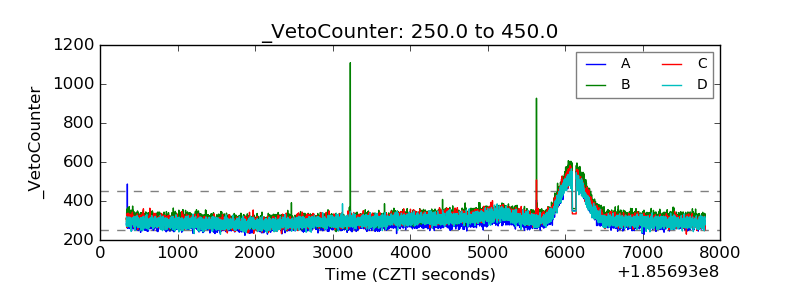 |