| Param | Original file | Final file |
|---|---|---|
| Filename | modeM0/AS1T01_001T01_9000000110_00788cztM0_level2.fits | modeM0/AS1T01_001T01_9000000110_00788cztM0_level2_quad_clean.evt |
| Size (bytes) | 712,506,240 | 84,389,760 |
| Size | 679.5 MB | 80.5 MB |
| Events in quadrant A | 6,744,472 | 557,158 |
| Events in quadrant B | 6,778,957 | 571,001 |
| Events in quadrant C | 6,300,774 | 543,414 |
| Events in quadrant D | 6,125,743 | 495,101 |
| Mode M0 | |||
|---|---|---|---|
| Quadrant | BADHDUFLAG | Total packets | Discarded packets |
| A | 0 | 24019 | 1 |
| B | 0 | 24074 | 1 |
| C | 0 | 22654 | 1 |
| D | 0 | 22167 | 1 |
| Mode SS | |||
|---|---|---|---|
| Quadrant | BADHDUFLAG | Total packets | Discarded packets |
| A | 0 | 112 | 0 |
| B | 0 | 112 | 0 |
| C | 0 | 112 | 0 |
| D | 0 | 112 | 0 |
| Quadrant | Total seconds | Saturated seconds | Saturation percentage |
|---|---|---|---|
| A | 5552 | 77 | 1.386888% |
| B | 5552 | 51 | 0.918588% |
| C | 5552 | 23 | 0.414265% |
| D | 5552 | 77 | 1.386888% |
Noise dominated data is calculated using 1-second bins in cleaned event files. If a bin has >2000 counts, and if more than 50% of those come from <1% of pixels, then it is considered to be noise-dominated and hence unusable.
| Quadrant | # 1 sec bins | Bins with >0 counts | Bins with >2000 counts | High rate bins dominated by noise | Noise dominated (total time) | Noise dominated (detector-on time) | Marked lightcurve |
|---|---|---|---|---|---|---|---|
| A | 5567 | 5553 | 268 | 268 | 4.81% | 4.83% | 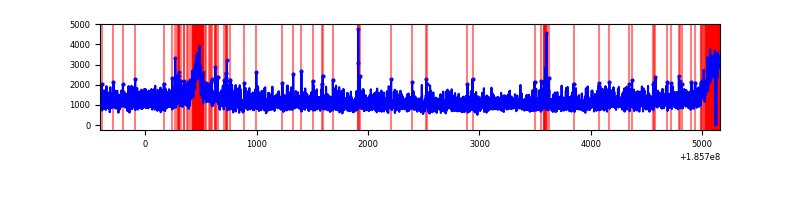 |
| B | 5566 | 5552 | 193 | 193 | 3.47% | 3.48% | 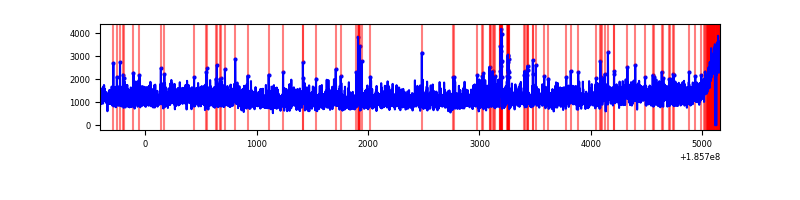 |
| C | 5567 | 5553 | 108 | 108 | 1.94% | 1.94% | 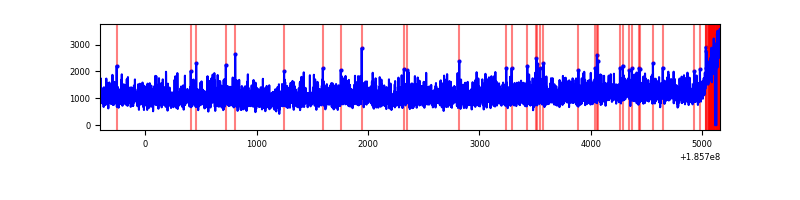 |
| D | 5567 | 5553 | 159 | 159 | 2.86% | 2.86% | 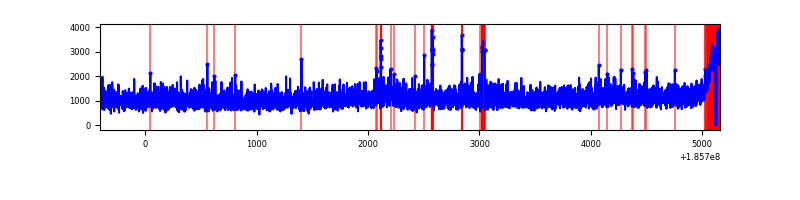 |
Top three noisy pixels from each quadrant. If the there are fewer than three noisy pixels in the level2.evt file, extra rows are filled as -1
| Pixel properties | Quadrant properties | ||||||
|---|---|---|---|---|---|---|---|
| Quadrant | DetID | PixID | Counts | Sigma | Mean | Median | Sigma |
| A | 8 | 192 | 253326 | 619.07 | 1675 | 1683 | 406.5 |
| A | 12 | 236 | 24965 | 57.28 | 1675 | 1683 | 406.5 |
| A | 15 | 233 | 22575 | 51.4 | 1675 | 1683 | 406.5 |
| B | 15 | 22 | 65896 | 156.92 | 1730 | 1738 | 408.8 |
| B | 0 | 23 | 56452 | 133.82 | 1730 | 1738 | 408.8 |
| B | 5 | 191 | 31249 | 72.18 | 1730 | 1738 | 408.8 |
| C | 9 | 83 | 50473 | 110.68 | 1577 | 1636 | 441.3 |
| C | 15 | 241 | 34020 | 73.39 | 1577 | 1636 | 441.3 |
| C | 3 | 111 | 30955 | 66.45 | 1577 | 1636 | 441.3 |
| D | 1 | 4 | 207784 | 433.53 | 1537 | 1590 | 475.6 |
| D | 13 | 25 | 115328 | 239.14 | 1537 | 1590 | 475.6 |
| D | 10 | 85 | 16867 | 32.12 | 1537 | 1590 | 475.6 |
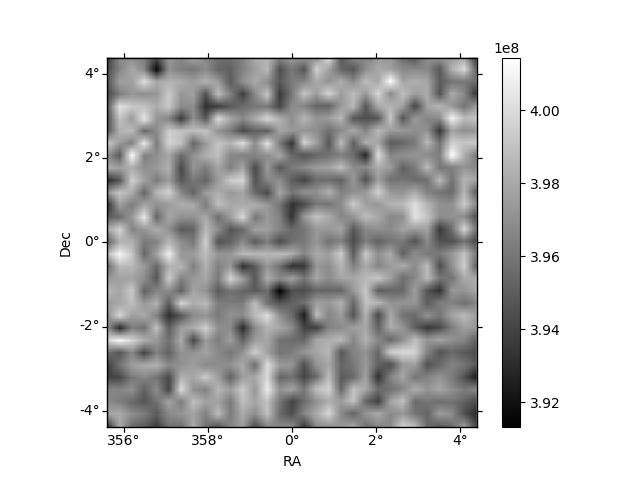
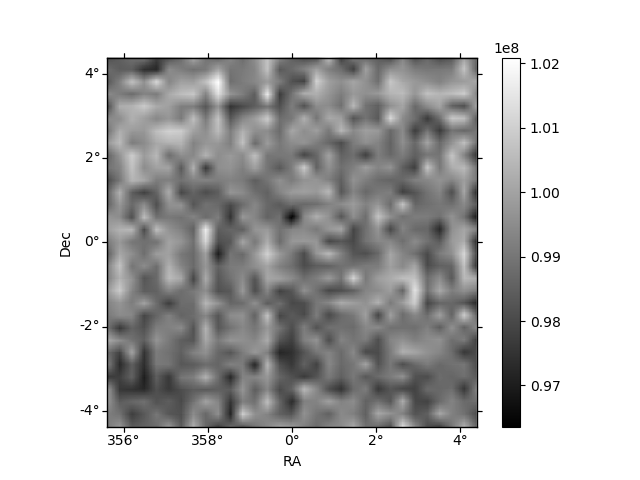
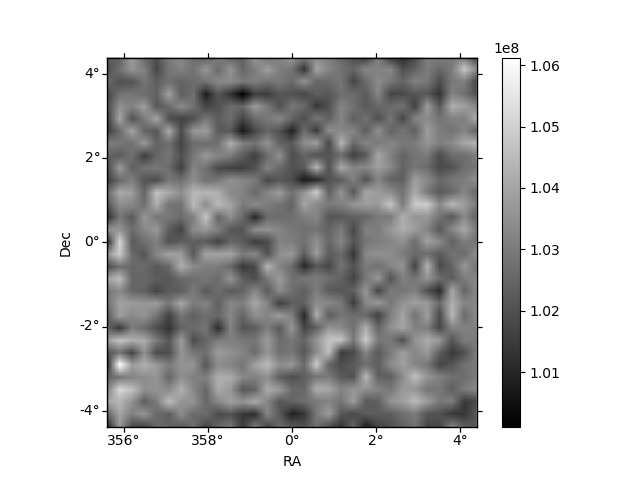
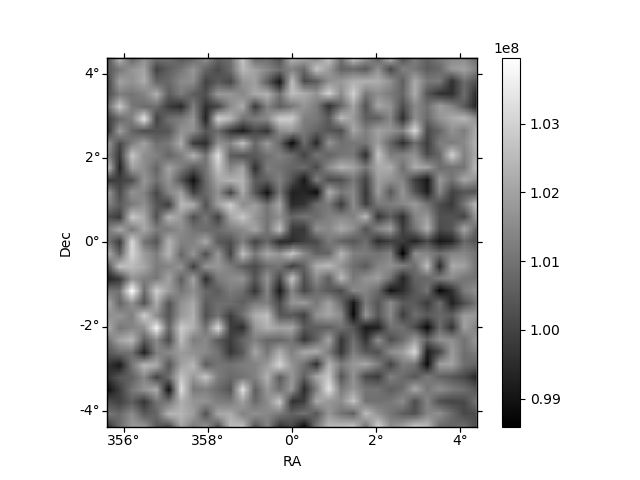
Histogram calculated using DETX and DETY for each event in the final _common_clean file
| Quadrant A | 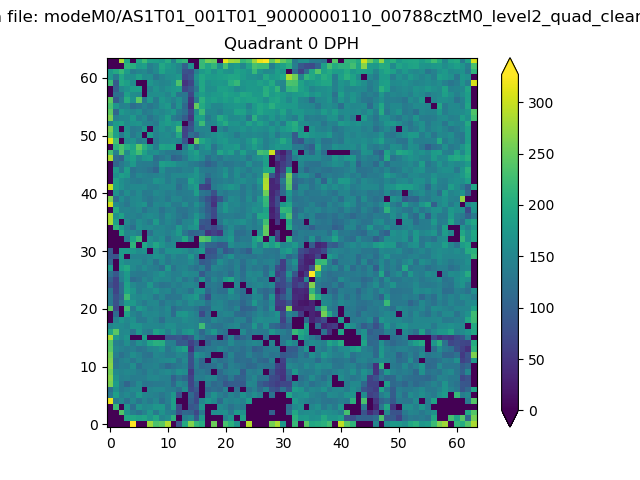 |
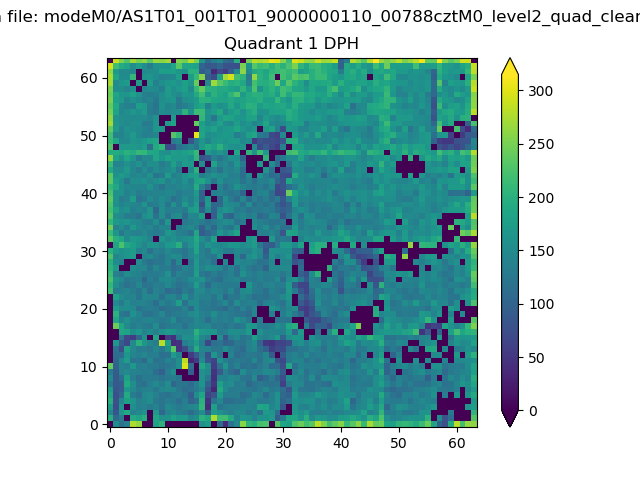 |
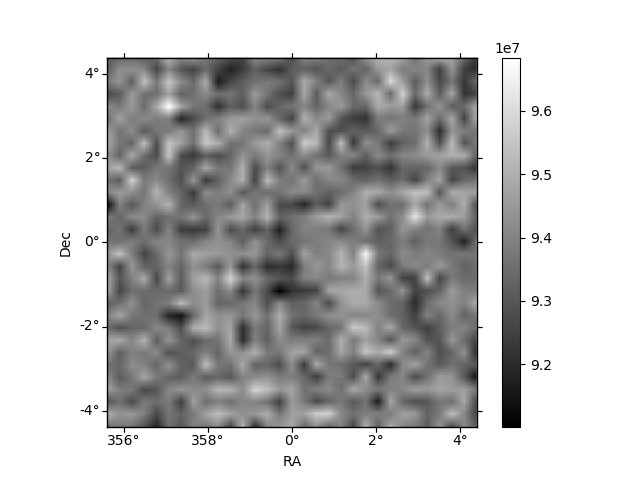
Quadrant B |
|---|---|---|---|
| Quadrant D | 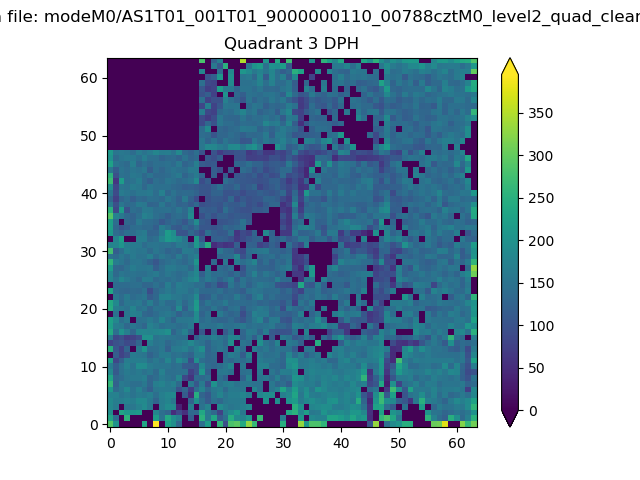 |
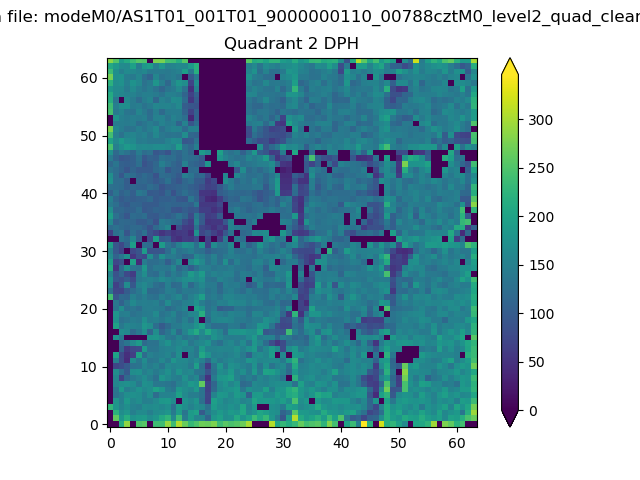 |
Quadrant C |
| Plot type | Count rate plots | Images |
|---|---|---|
| Comparison with Poisson distribution Blue bars denote a histogram of data divided into 1 sec bins. Red curve is a Poisson curve with rate = median count rate of data. |
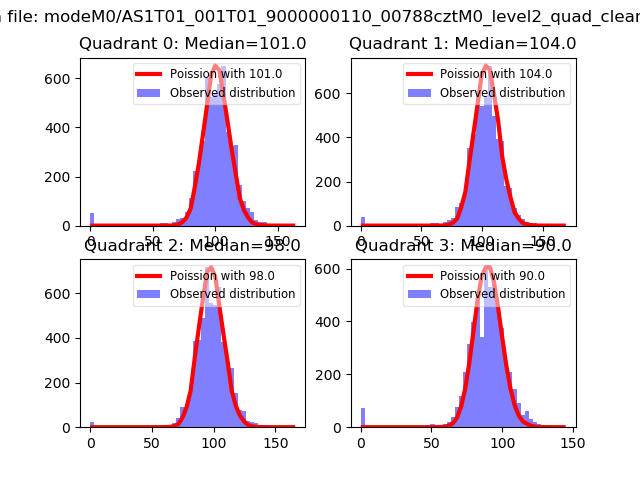 |
 |
| Quadrant-wise count rates Data is divided into 100 sec bins |
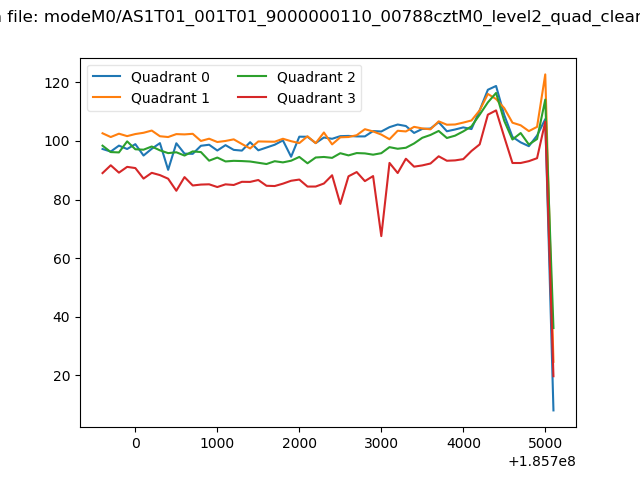 |
|
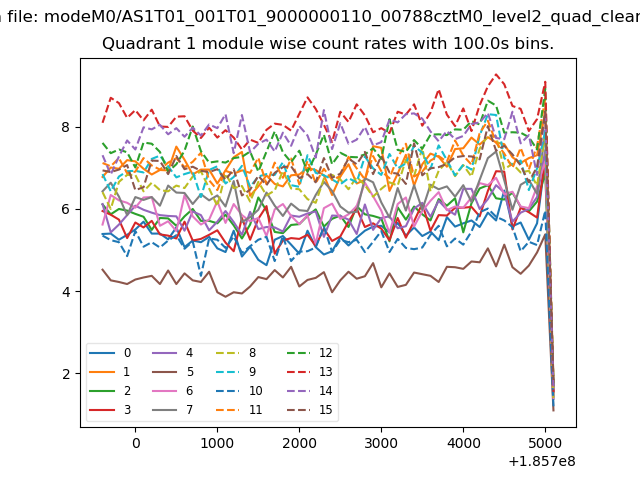
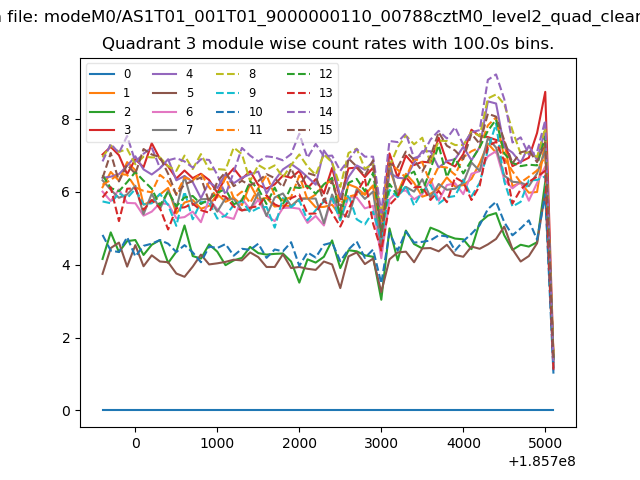
| Module-wise count rates for Quadrant A Data is divided into 100 sec bins |
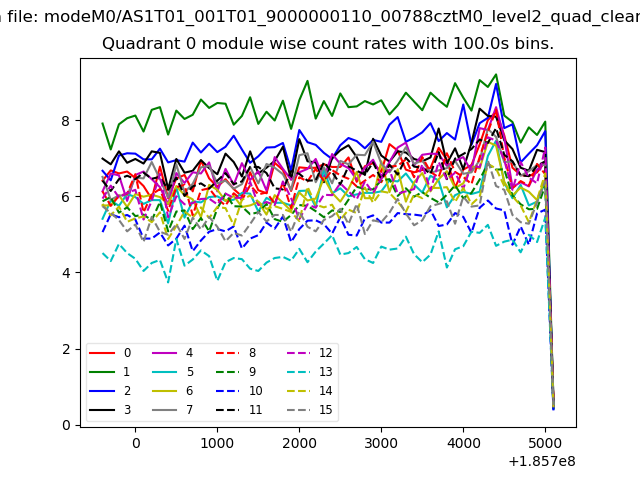 |
 |
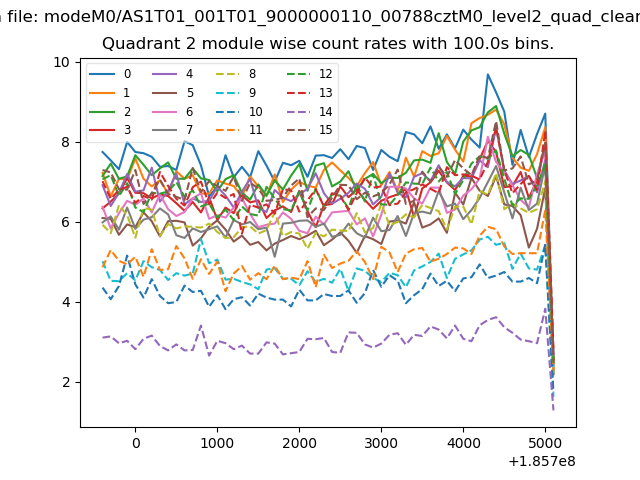
| Module-wise count rates for Quadrant B Data is divided into 100 sec bins |
 |
 |
| Module-wise count rates for Quadrant C Data is divided into 100 sec bins |
 |
 |
| Module-wise count rates for Quadrant D Data is divided into 100 sec bins |
 |
 |
| Parameter | Plot |
|---|---|
| CZT HV Monitor | 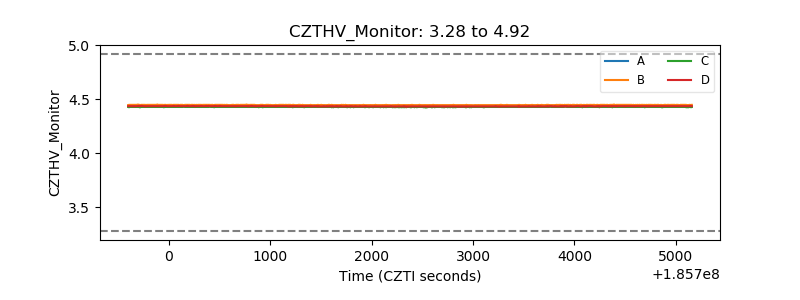 |
| D_VDD | 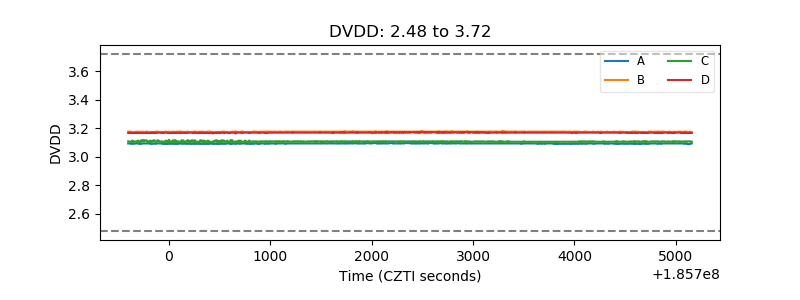 |
| Temperature 1 | 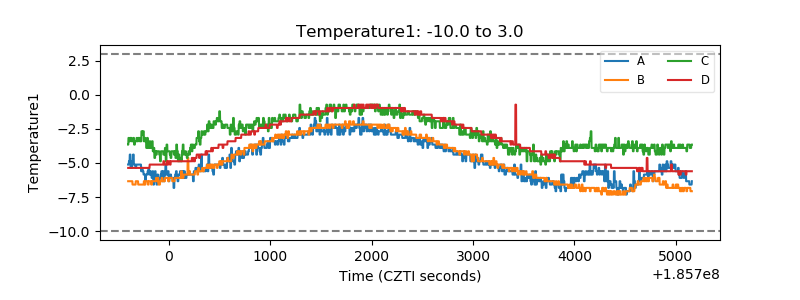 |
| Veto HV Monitor | 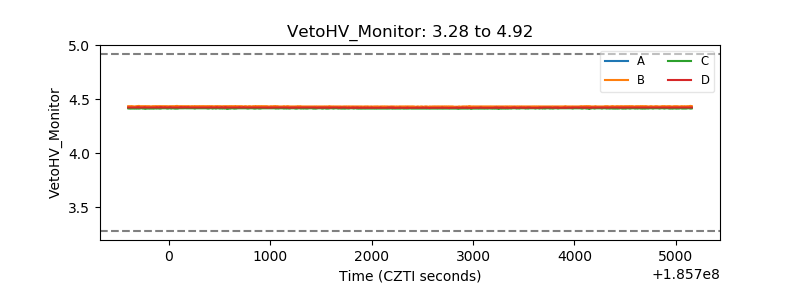 |
| Veto LLD | 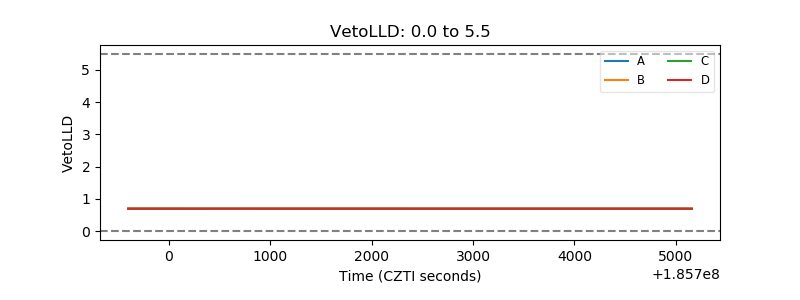 |
| Alpha Counter | 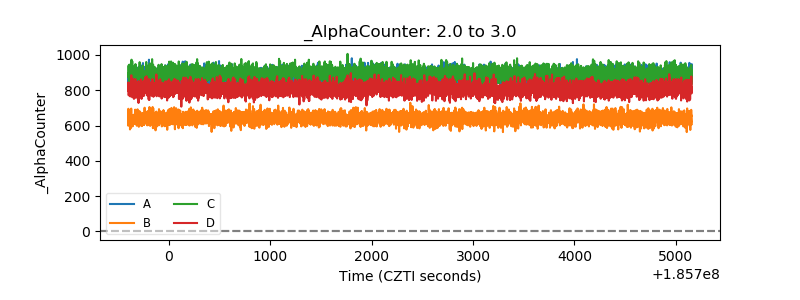 |
| _CPM_Rate | 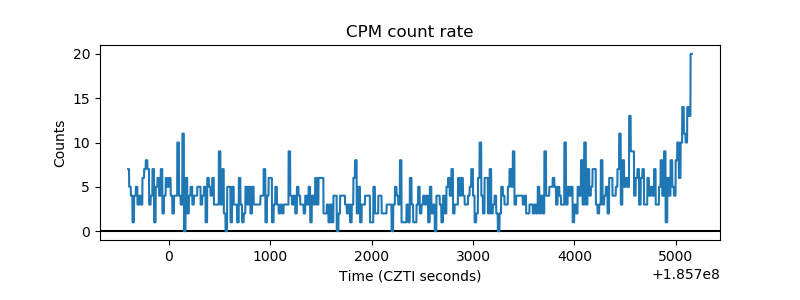 |
| CZT Counter | 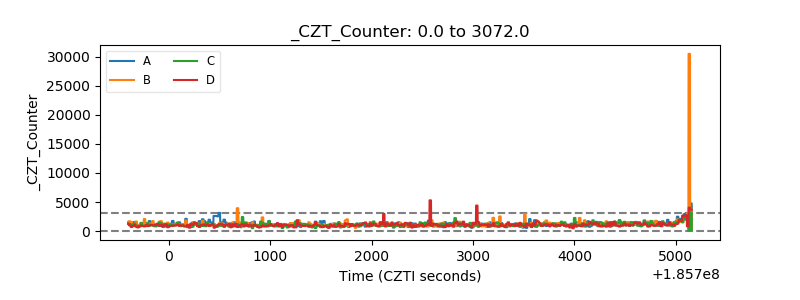 |
| +2.5 Volts monitor |  |
| +5 Volts monitor |  |
| _ROLL_ROT | 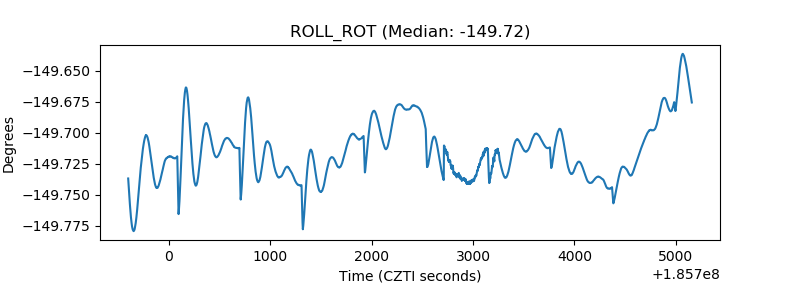 |
| _Roll_DEC | 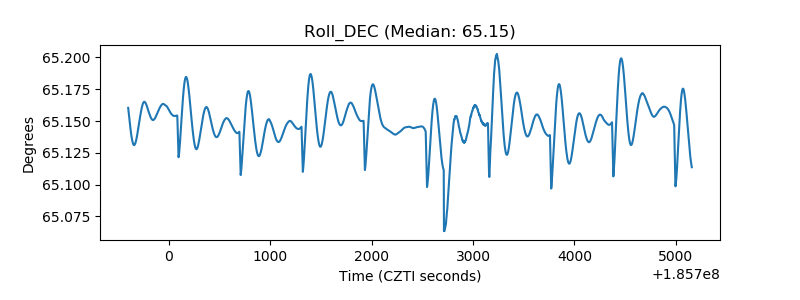 |
| _Roll_RA | 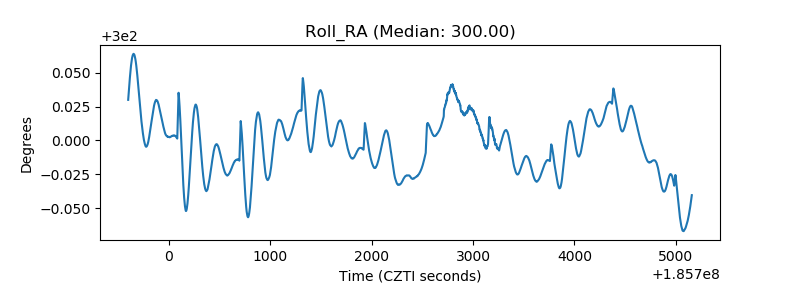 |
| Veto Counter | 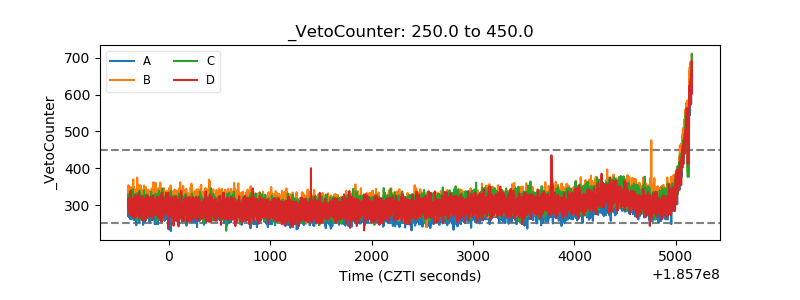 |