| Param | Original file | Final file |
|---|---|---|
| Filename | modeM0/AS1P01_156T01_9000000114cztM0_level2.fits | modeM0/AS1P01_156T01_9000000114cztM0_level2_quad_clean.evt |
| Size (bytes) | 289,474,560 | 199,488,960 |
| Size | 276.1 MB | 190.2 MB |
| Events in quadrant A | 1,686,148 | 956,895 |
| Events in quadrant B | 1,647,460 | 972,164 |
| Events in quadrant C | 1,668,038 | 919,424 |
| Events in quadrant D | 1,392,250 | 819,308 |
| Mode SS | |||
|---|---|---|---|
| Quadrant | BADHDUFLAG | Total packets | Discarded packets |
| A | 0 | 760 | 0 |
| B | 0 | 720 | 0 |
| C | 0 | 694 | 0 |
| D | 0 | 718 | 0 |
| Mode M9 | |||
|---|---|---|---|
| Quadrant | BADHDUFLAG | Total packets | Discarded packets |
| A | 0 | 36 | 0 |
| B | 0 | 36 | 0 |
| C | 0 | 36 | 0 |
| D | 0 | 36 | 0 |
| Mode M0 | |||
|---|---|---|---|
| Quadrant | BADHDUFLAG | Total packets | Discarded packets |
| A | 0 | 149860 | 0 |
| B | 0 | 154594 | 0 |
| C | 0 | 147278 | 0 |
| D | 0 | 156797 | 0 |
| Quadrant | Total seconds | Saturated seconds | Saturation percentage |
|---|---|---|---|
| A | 34585 | 308 | 0.890559% |
| B | 34104 | 387 | 1.134764% |
| C | 34555 | 283 | 0.818984% |
| D | 34570 | 1963 | 5.678334% |
Noise dominated data is calculated using 1-second bins in cleaned event files. If a bin has >2000 counts, and if more than 50% of those come from <1% of pixels, then it is considered to be noise-dominated and hence unusable.
| Quadrant | # 1 sec bins | Bins with >0 counts | Bins with >2000 counts | High rate bins dominated by noise | Noise dominated (total time) | Noise dominated (detector-on time) | Marked lightcurve |
|---|---|---|---|---|---|---|---|
| A | 40872 | 34643 | 0 | 0 | 0.00% | 0.00% | 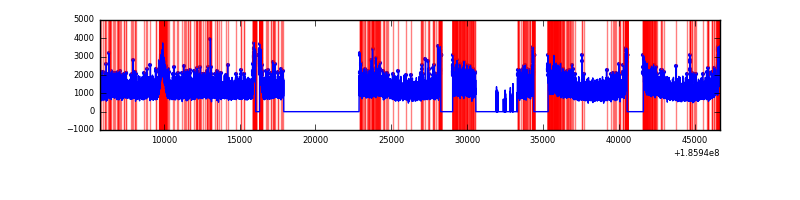 |
| B | 40872 | 34149 | 0 | 0 | 0.00% | 0.00% | 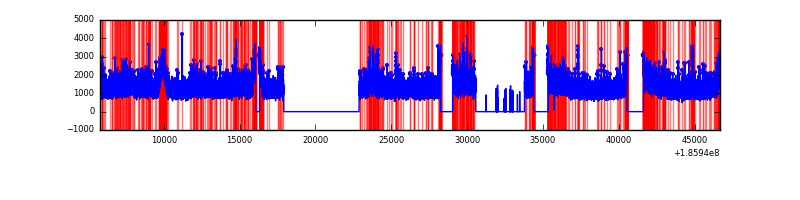 |
| C | 40872 | 34605 | 0 | 0 | 0.00% | 0.00% |  |
| D | 40872 | 34592 | 0 | 0 | 0.00% | 0.00% |  |
Top three noisy pixels from each quadrant. If the there are fewer than three noisy pixels in the level2.evt file, extra rows are filled as -1
| Pixel properties | Quadrant properties | ||||||
|---|---|---|---|---|---|---|---|
| Quadrant | DetID | PixID | Counts | Sigma | Mean | Median | Sigma |
| A | 0 | 29 | 1582 | 11.2 | 436 | 406 | 105.0 |
| A | 7 | 110 | 1527 | 10.68 | 436 | 406 | 105.0 |
| A | 0 | 30 | 1220 | 7.75 | 436 | 406 | 105.0 |
| B | 2 | 9 | 1385 | 11.75 | 434 | 411 | 82.9 |
| B | 5 | 128 | 1106 | 8.38 | 434 | 411 | 82.9 |
| B | 10 | 225 | 1084 | 8.12 | 434 | 411 | 82.9 |
| C | 12 | 241 | 1165 | 6.71 | 441 | 403 | 113.6 |
| C | 2 | 191 | 1120 | 6.31 | 441 | 403 | 113.6 |
| C | 9 | 242 | 1084 | 5.99 | 441 | 403 | 113.6 |
| D | 6 | 114 | 976 | 6.35 | 398 | 362 | 96.8 |
| D | 6 | 231 | 976 | 6.35 | 398 | 362 | 96.8 |
| D | 11 | 82 | 975 | 6.33 | 398 | 362 | 96.8 |
Histogram calculated using DETX and DETY for each event in the final _common_clean file
| Quadrant A | 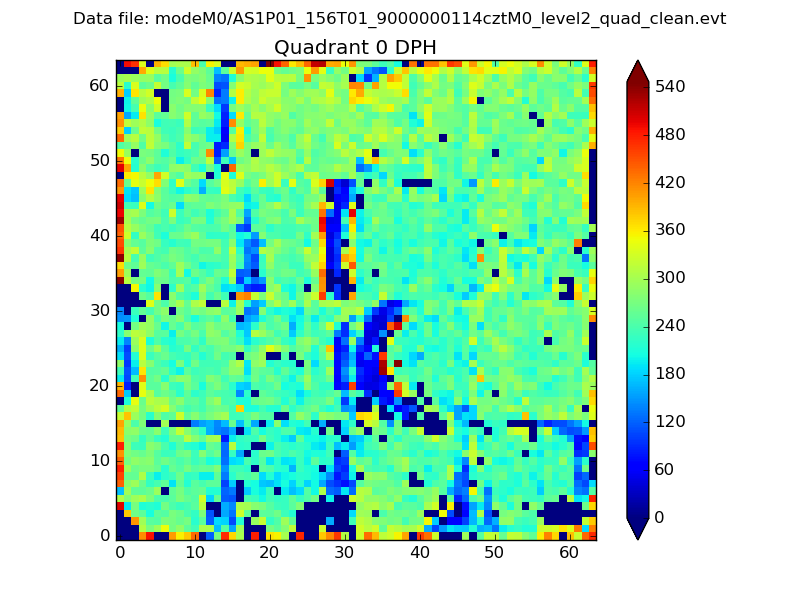 |
 |
Quadrant B |
|---|---|---|---|
| Quadrant D | 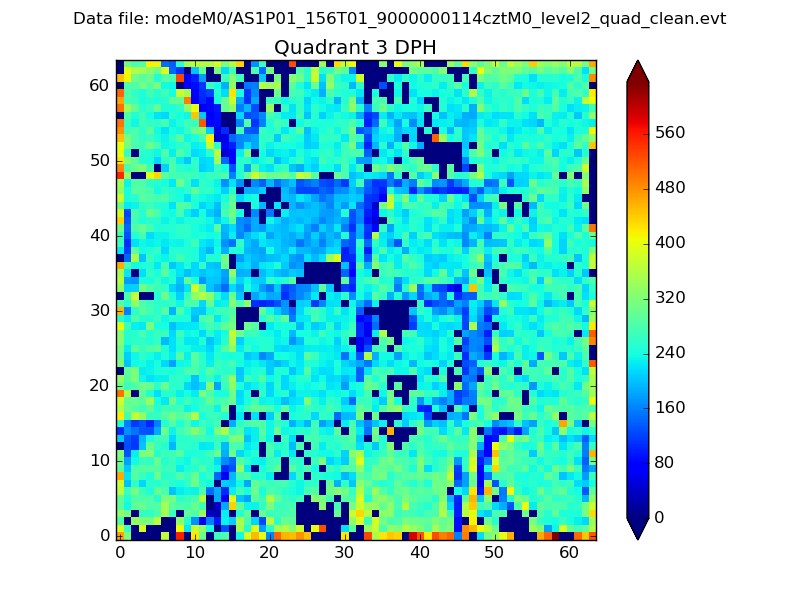 |
 |
Quadrant C |
| Plot type | Count rate plots | Images |
|---|---|---|
| Comparison with Poisson distribution Blue bars denote a histogram of data divided into 1 sec bins. Red curve is a Poisson curve with rate = median count rate of data. |
 |
 |
| Quadrant-wise count rates Data is divided into 100 sec bins |
 |
|
| Module-wise count rates for Quadrant A Data is divided into 100 sec bins |
 |
 |
| Module-wise count rates for Quadrant B Data is divided into 100 sec bins |
 |
 |
| Module-wise count rates for Quadrant C Data is divided into 100 sec bins |
 |
 |
| Module-wise count rates for Quadrant D Data is divided into 100 sec bins |
 |
 |
| Parameter | Plot |
|---|---|
| CZT HV Monitor |  |
| D_VDD |  |
| Temperature 1 |  |
| Veto HV Monitor |  |
| Veto LLD |  |
| Alpha Counter |  |
| _CPM_Rate |  |
| CZT Counter |  |
| +2.5 Volts monitor |  |
| +5 Volts monitor | 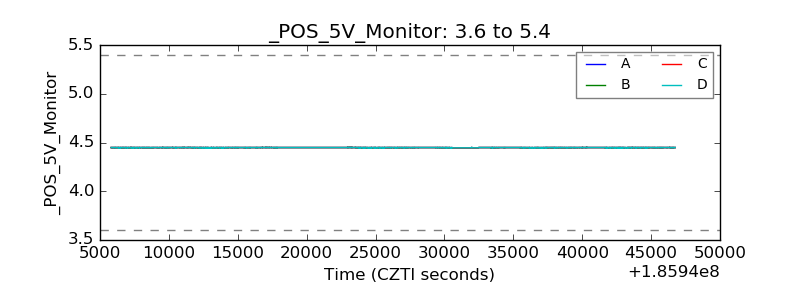 |
| _ROLL_ROT | 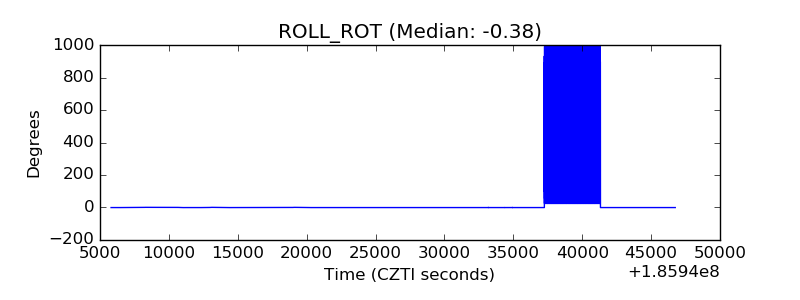 |
| _Roll_DEC |  |
| _Roll_RA | 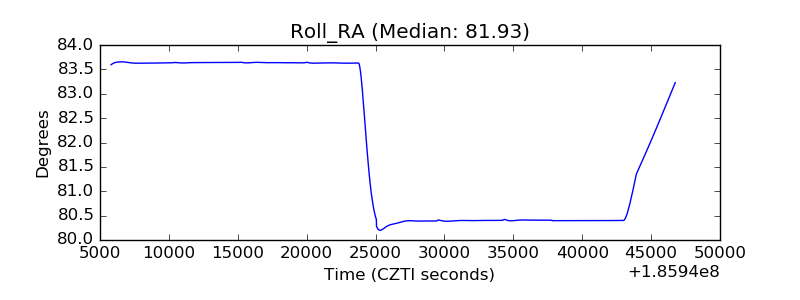 |
| Veto Counter |  |