| Param | Original file | Final file |
|---|---|---|
| Filename | modeM0/AS1P01_156T01_9000000114_00832cztM0_level2.evt | modeM0/AS1P01_156T01_9000000114_00832cztM0_level2_quad_clean.evt |
| Size (bytes) | 1,131,272,640 | 53,775,360 |
| Size | 1.1 GB | 51.3 MB |
| Events in quadrant A | 8,211,132 | 293,944 |
| Events in quadrant B | 8,554,038 | 296,614 |
| Events in quadrant C | 7,947,075 | 290,232 |
| Events in quadrant D | 9,103,028 | 278,187 |
| Mode SS | |||
|---|---|---|---|
| Quadrant | BADHDUFLAG | Total packets | Discarded packets |
| A | 0 | 136 | 0 |
| B | 0 | 136 | 0 |
| C | 0 | 136 | 0 |
| D | 0 | 136 | 0 |
| Mode M9 | |||
|---|---|---|---|
| Quadrant | BADHDUFLAG | Total packets | Discarded packets |
| A | 0 | 6 | 0 |
| B | 0 | 6 | 0 |
| C | 0 | 6 | 0 |
| D | 0 | 6 | 0 |
| Mode M0 | |||
|---|---|---|---|
| Quadrant | BADHDUFLAG | Total packets | Discarded packets |
| A | 0 | 29181 | 1 |
| B | 0 | 30197 | 1 |
| C | 0 | 28399 | 1 |
| D | 0 | 31946 | 11 |
| Quadrant | Total seconds | Saturated seconds | Saturation percentage |
|---|---|---|---|
| A | 6727 | 49 | 0.728408% |
| B | 6727 | 56 | 0.832466% |
| C | 6727 | 42 | 0.624350% |
| D | 6726 | 607 | 9.024680% |
Noise dominated data is calculated using 1-second bins in cleaned event files. If a bin has >2000 counts, and if more than 50% of those come from <1% of pixels, then it is considered to be noise-dominated and hence unusable.
| Quadrant | # 1 sec bins | Bins with >0 counts | Bins with >2000 counts | High rate bins dominated by noise | Noise dominated (total time) | Noise dominated (detector-on time) | Marked lightcurve |
|---|---|---|---|---|---|---|---|
| A | 7277 | 6727 | 236 | 236 | 3.24% | 3.51% | 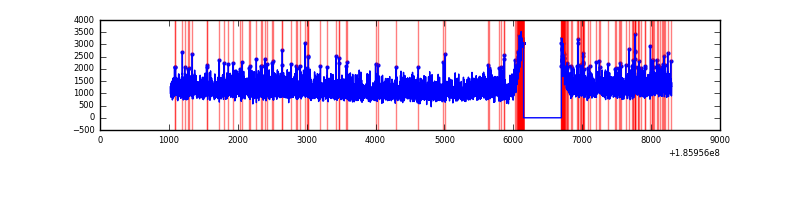 |
| B | 7277 | 6727 | 270 | 270 | 3.71% | 4.01% | 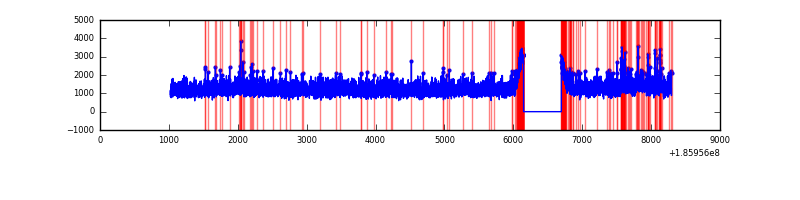 |
| C | 7277 | 6727 | 172 | 172 | 2.36% | 2.56% | 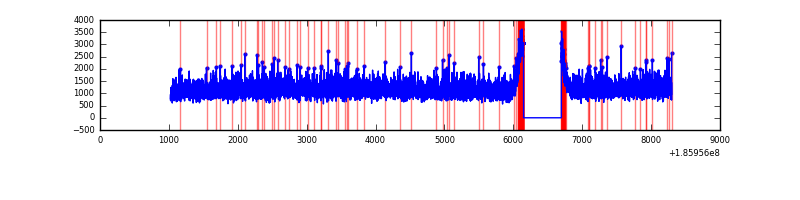 |
| D | 7276 | 6726 | 906 | 906 | 12.45% | 13.47% | 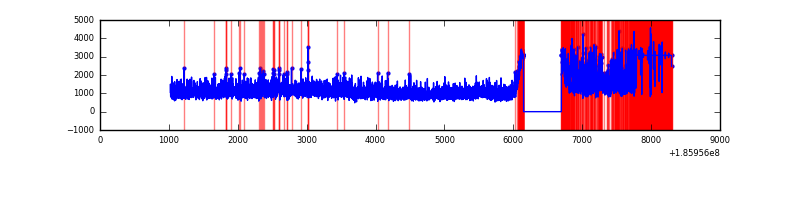 |
Top three noisy pixels from each quadrant. If the there are fewer than three noisy pixels in the level2.evt file, extra rows are filled as -1
| Pixel properties | Quadrant properties | ||||||
|---|---|---|---|---|---|---|---|
| Quadrant | DetID | PixID | Counts | Sigma | Mean | Median | Sigma |
| A | 15 | 17 | 40987 | 75.24 | 2125 | 2144 | 516.2 |
| A | 3 | 80 | 12082 | 19.25 | 2125 | 2144 | 516.2 |
| A | 0 | 214 | 8745 | 12.79 | 2125 | 2144 | 516.2 |
| B | 2 | 2 | 87121 | 163.79 | 2190 | 2204 | 518.5 |
| B | 5 | 249 | 48926 | 90.12 | 2190 | 2204 | 518.5 |
| B | 8 | 219 | 31399 | 56.31 | 2190 | 2204 | 518.5 |
| C | 15 | 241 | 44364 | 75.17 | 2001 | 2073 | 562.6 |
| C | 3 | 111 | 30447 | 50.43 | 2001 | 2073 | 562.6 |
| C | 3 | 79 | 20515 | 32.78 | 2001 | 2073 | 562.6 |
| D | 7 | 70 | 1779668 | 3023.73 | 1877 | 1948 | 587.9 |
| D | 2 | 16 | 63406 | 104.53 | 1877 | 1948 | 587.9 |
| D | 13 | 200 | 53029 | 86.88 | 1877 | 1948 | 587.9 |
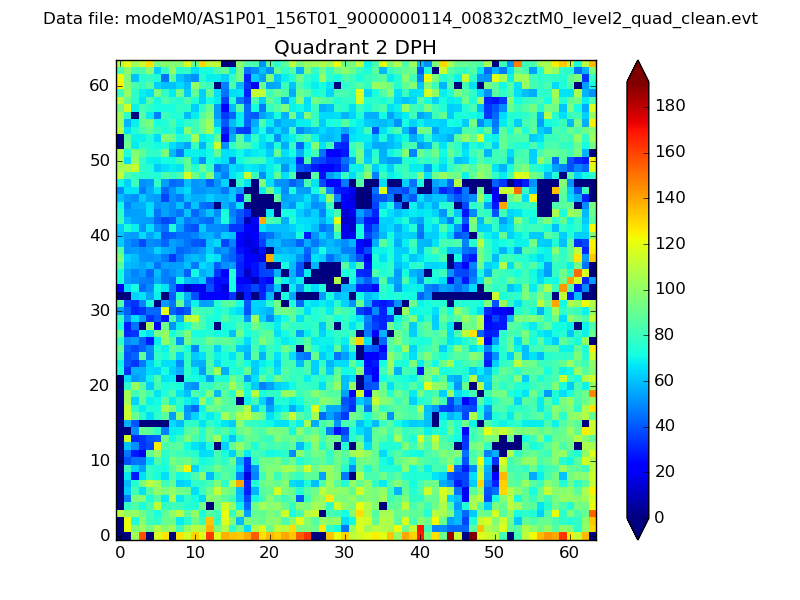
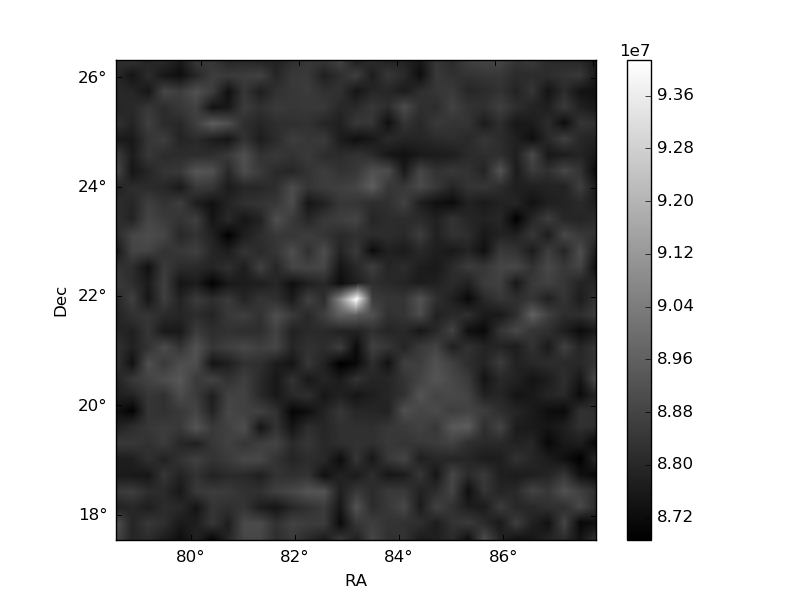
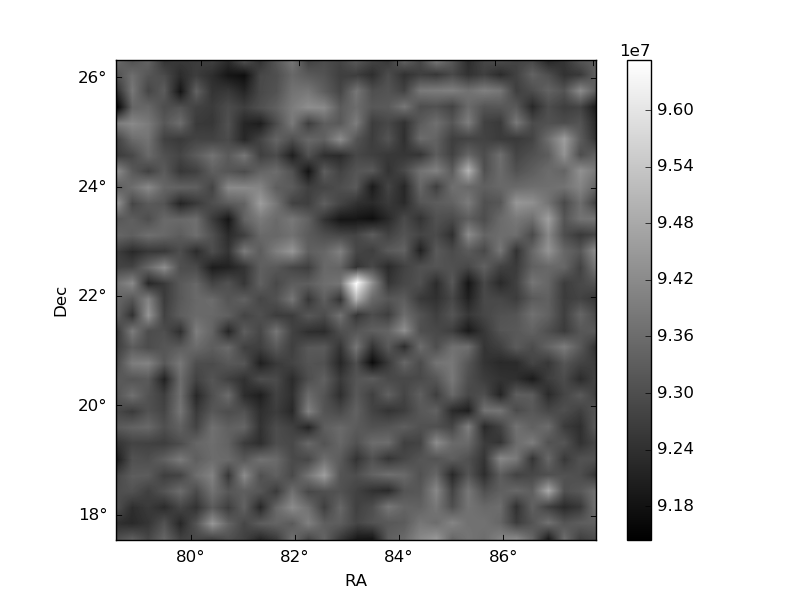
Histogram calculated using DETX and DETY for each event in the final _common_clean file
| Quadrant A | 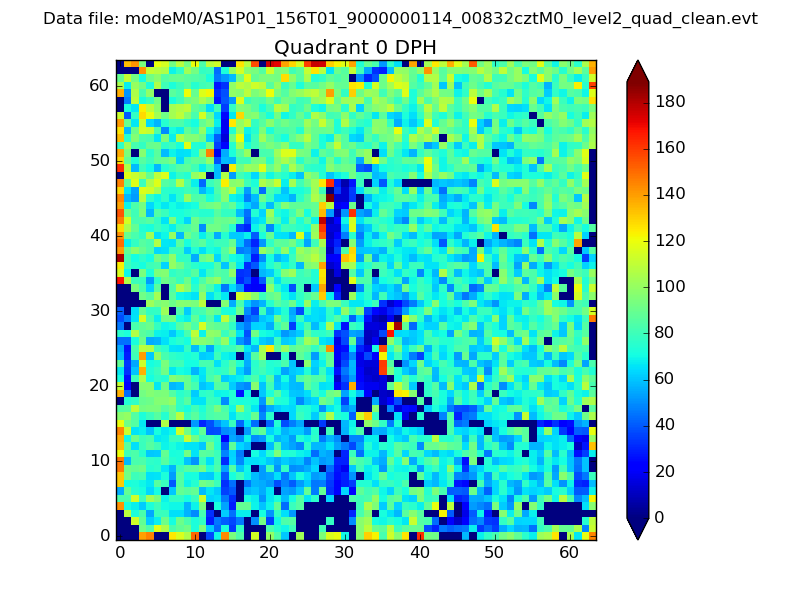 |
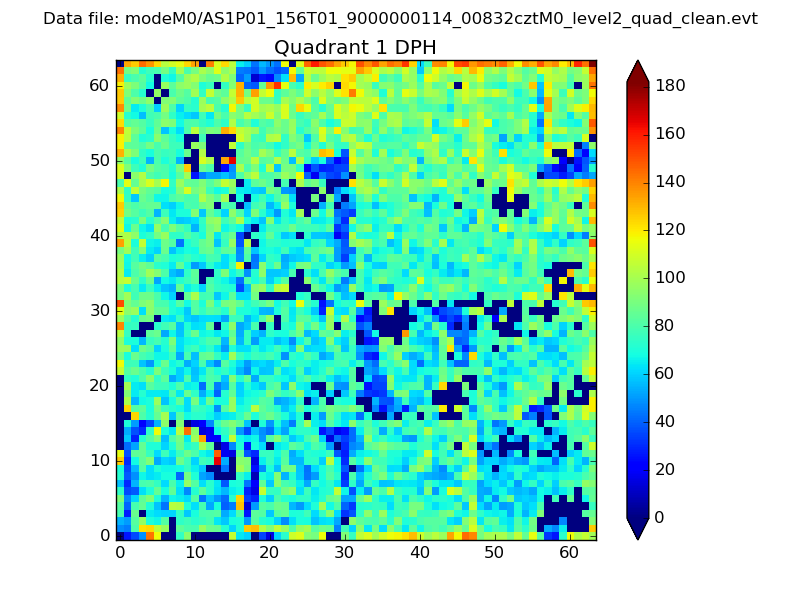 |
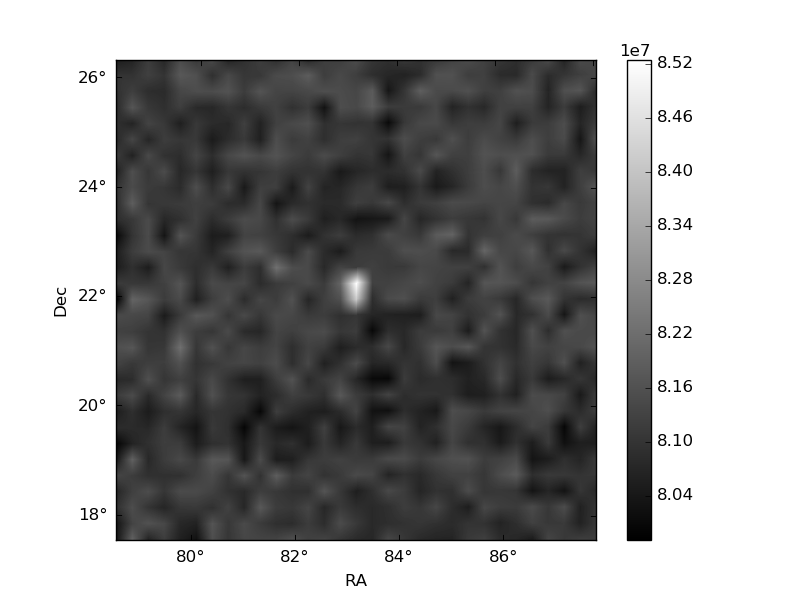
Quadrant B |
|---|---|---|---|
| Quadrant D | 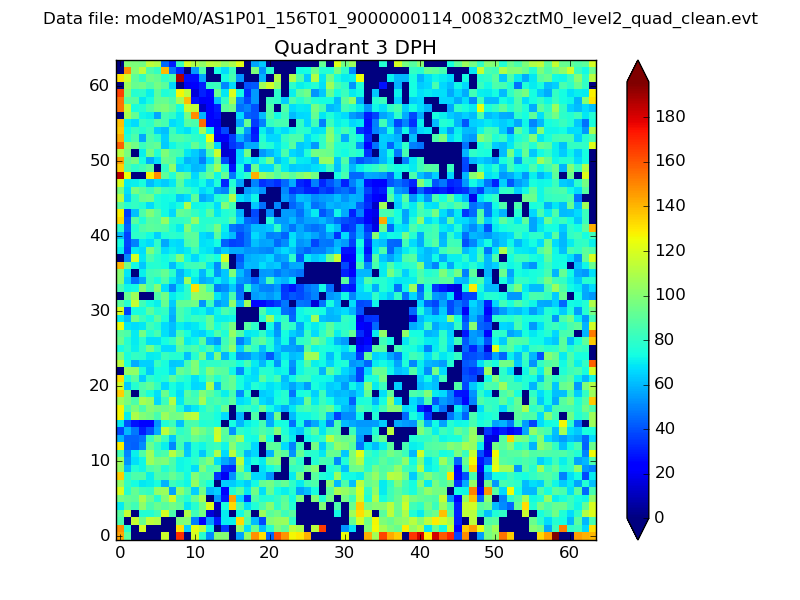 |
 |
Quadrant C |
| Plot type | Count rate plots | Images |
|---|---|---|
| Comparison with Poisson distribution Blue bars denote a histogram of data divided into 1 sec bins. Red curve is a Poisson curve with rate = median count rate of data. |
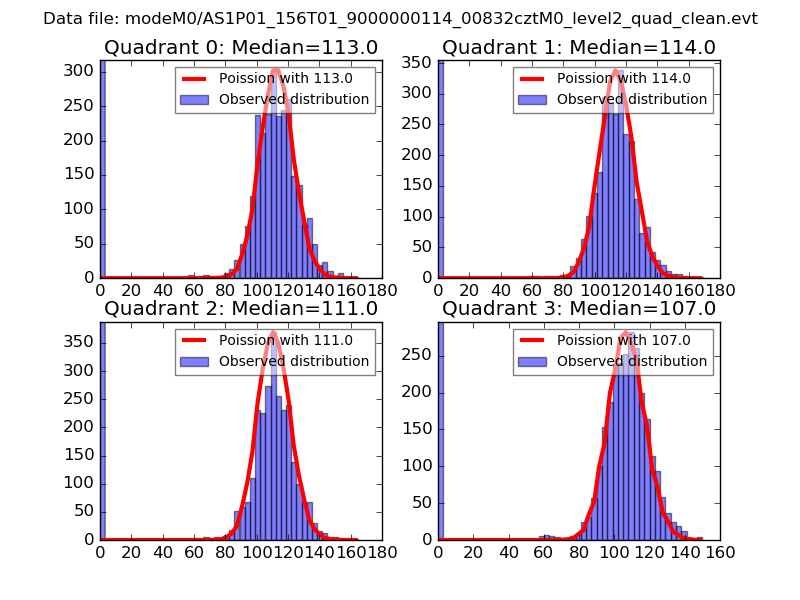 |
 |
| Quadrant-wise count rates Data is divided into 100 sec bins |
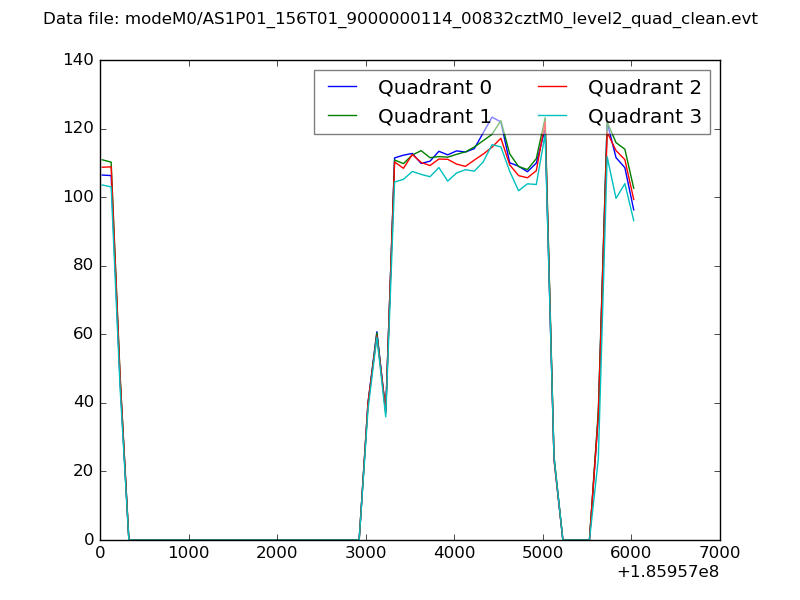 |
|
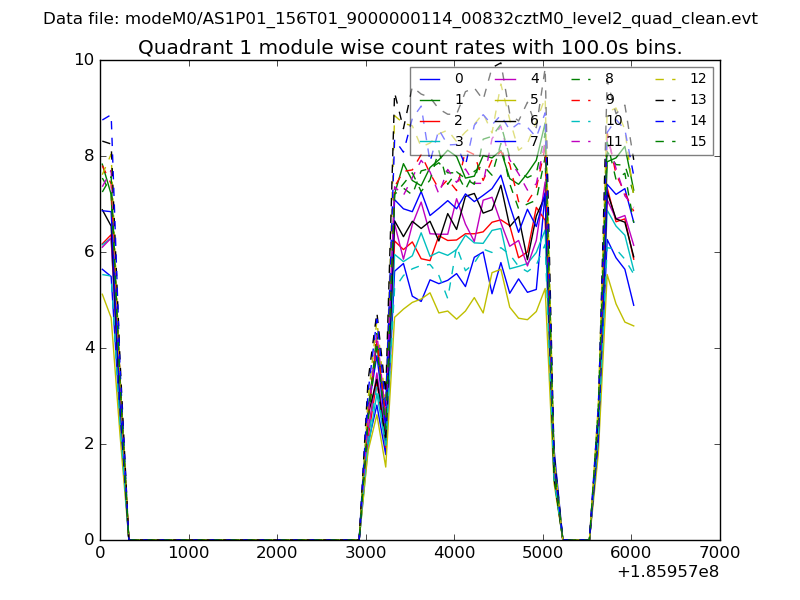
| Module-wise count rates for Quadrant A Data is divided into 100 sec bins |
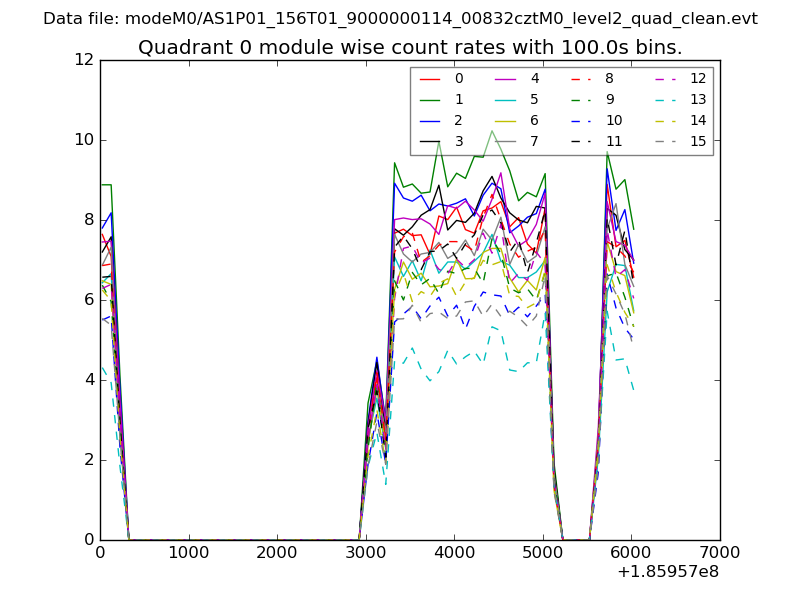 |
 |
| Module-wise count rates for Quadrant B Data is divided into 100 sec bins |
 |
 |
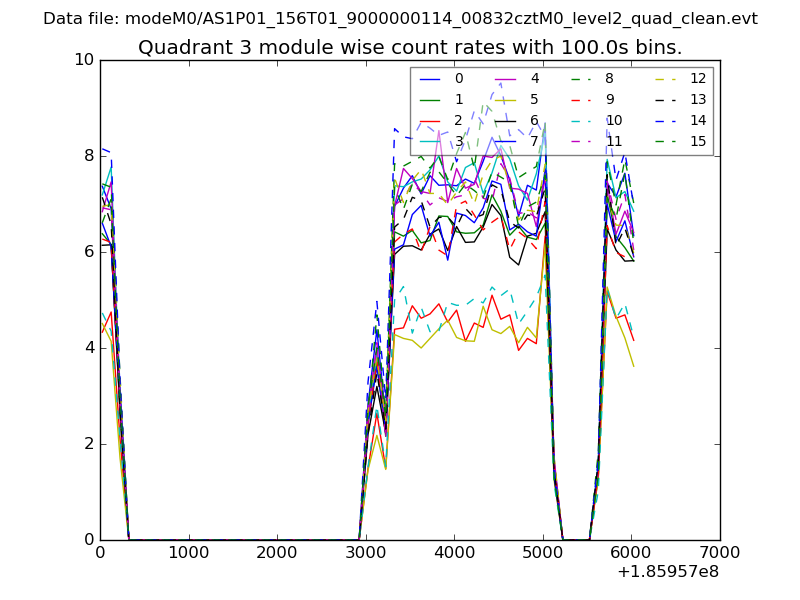
| Module-wise count rates for Quadrant C Data is divided into 100 sec bins |
 |
 |
| Module-wise count rates for Quadrant D Data is divided into 100 sec bins |
 |
 |
| Parameter | Plot |
|---|---|
| CZT HV Monitor | 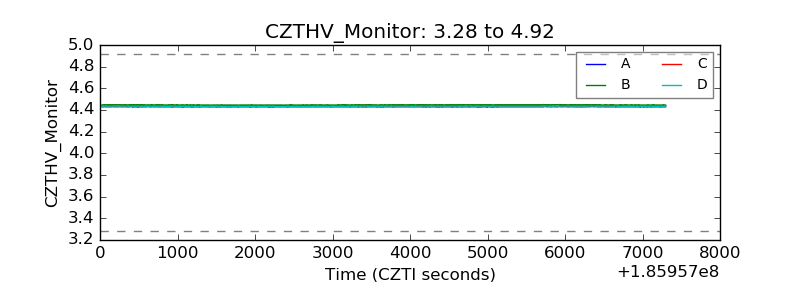 |
| D_VDD |  |
| Temperature 1 | 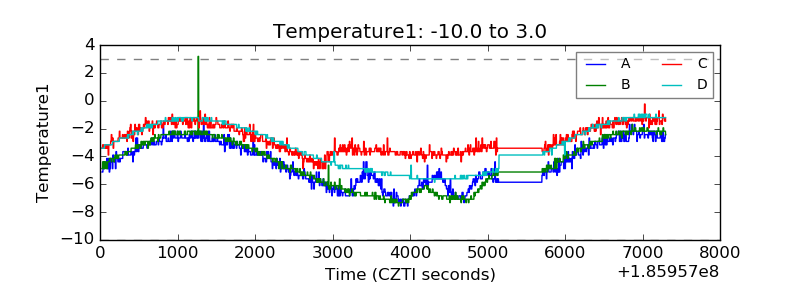 |
| Veto HV Monitor | 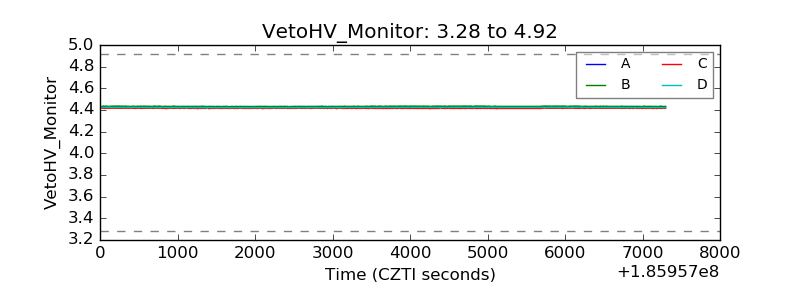 |
| Veto LLD | 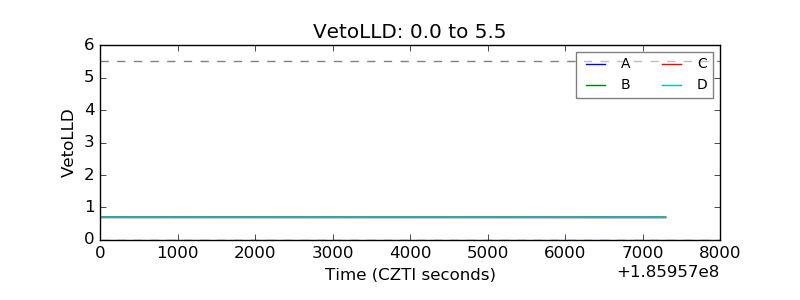 |
| Alpha Counter | 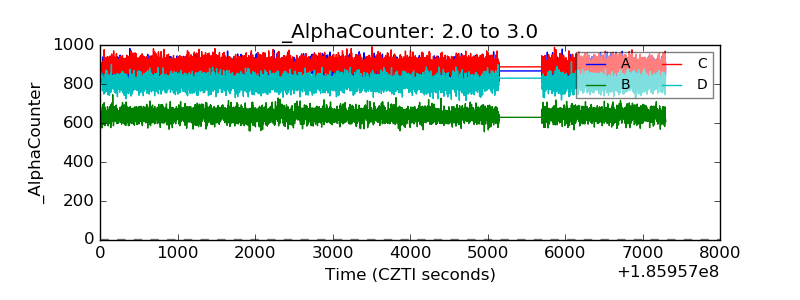 |
| _CPM_Rate | 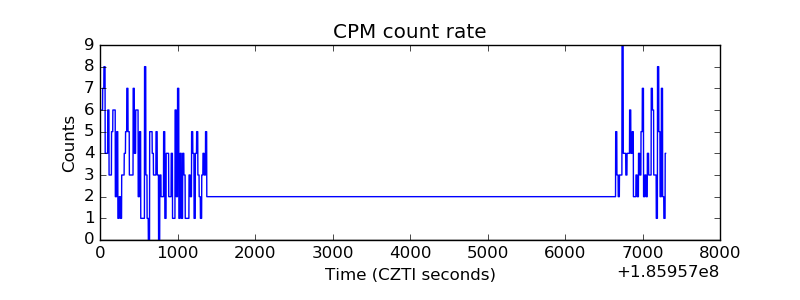 |
| CZT Counter | 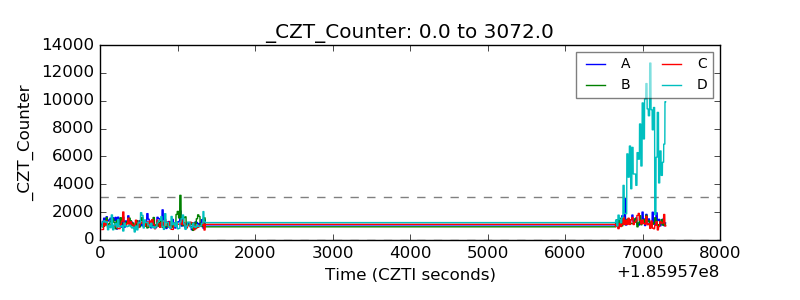 |
| +2.5 Volts monitor |  |
| +5 Volts monitor |  |
| _ROLL_ROT | 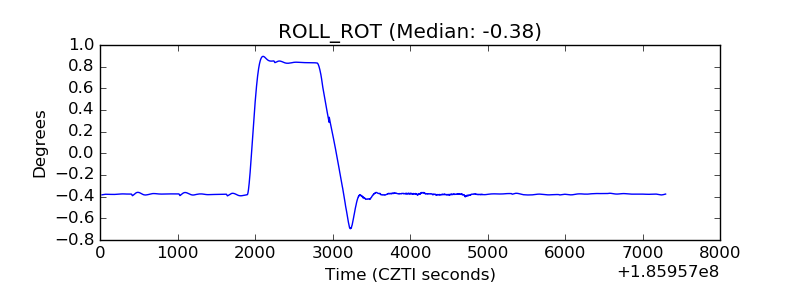 |
| _Roll_DEC | 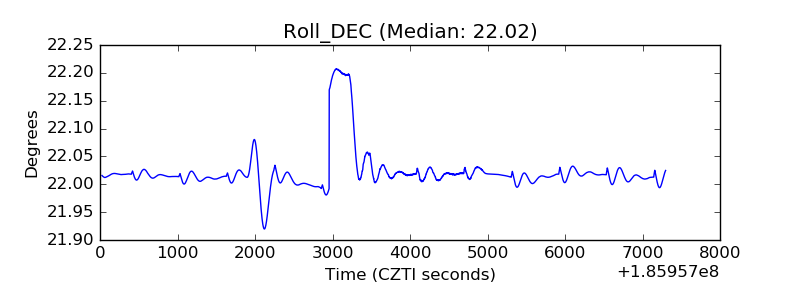 |
| _Roll_RA |  |
| Veto Counter | 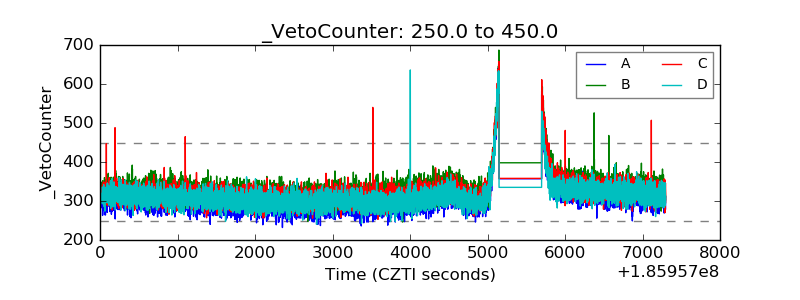 |