| Param | Original file | Final file |
|---|---|---|
| Filename | modeM0/AS1P01_156T01_9000000114_00836cztM0_level2.evt | modeM0/AS1P01_156T01_9000000114_00836cztM0_level2_quad_clean.evt |
| Size (bytes) | 1,723,795,200 | 80,818,560 |
| Size | 1.6 GB | 77.1 MB |
| Events in quadrant A | 12,657,001 | 435,554 |
| Events in quadrant B | 13,285,650 | 435,286 |
| Events in quadrant C | 12,453,889 | 431,603 |
| Events in quadrant D | 13,111,170 | 413,485 |
| Mode SS | |||
|---|---|---|---|
| Quadrant | BADHDUFLAG | Total packets | Discarded packets |
| A | 0 | 216 | 0 |
| B | 0 | 216 | 0 |
| C | 0 | 216 | 0 |
| D | 0 | 216 | 0 |
| Mode M9 | |||
|---|---|---|---|
| Quadrant | BADHDUFLAG | Total packets | Discarded packets |
| A | 0 | 20 | 0 |
| B | 0 | 20 | 0 |
| C | 0 | 20 | 0 |
| D | 0 | 20 | 0 |
| Mode M0 | |||
|---|---|---|---|
| Quadrant | BADHDUFLAG | Total packets | Discarded packets |
| A | 0 | 45080 | 0 |
| B | 0 | 46887 | 0 |
| C | 0 | 44477 | 0 |
| D | 0 | 46493 | 0 |
| Quadrant | Total seconds | Saturated seconds | Saturation percentage |
|---|---|---|---|
| A | 10551 | 75 | 0.710833% |
| B | 10551 | 103 | 0.976211% |
| C | 10552 | 86 | 0.815011% |
| D | 10552 | 430 | 4.075057% |
Noise dominated data is calculated using 1-second bins in cleaned event files. If a bin has >2000 counts, and if more than 50% of those come from <1% of pixels, then it is considered to be noise-dominated and hence unusable.
| Quadrant | # 1 sec bins | Bins with >0 counts | Bins with >2000 counts | High rate bins dominated by noise | Noise dominated (total time) | Noise dominated (detector-on time) | Marked lightcurve |
|---|---|---|---|---|---|---|---|
| A | 12581 | 10551 | 372 | 372 | 2.96% | 3.53% | 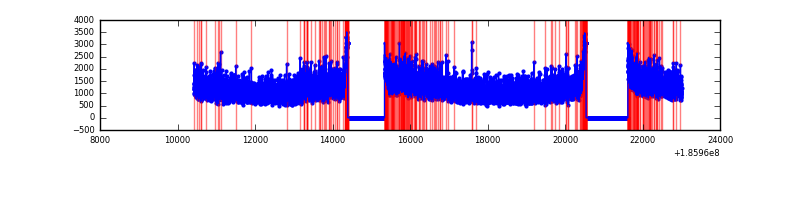 |
| B | 12582 | 10552 | 448 | 448 | 3.56% | 4.25% |  |
| C | 12582 | 10552 | 308 | 308 | 2.45% | 2.92% | 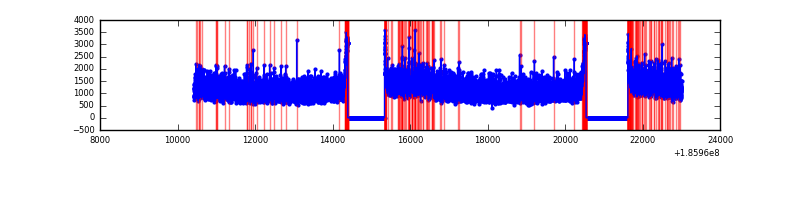 |
| D | 12582 | 10552 | 936 | 936 | 7.44% | 8.87% | 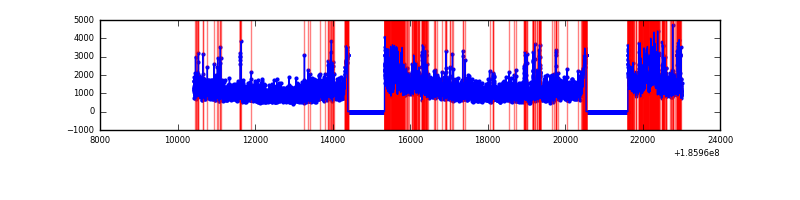 |
Top three noisy pixels from each quadrant. If the there are fewer than three noisy pixels in the level2.evt file, extra rows are filled as -1
| Pixel properties | Quadrant properties | ||||||
|---|---|---|---|---|---|---|---|
| Quadrant | DetID | PixID | Counts | Sigma | Mean | Median | Sigma |
| A | 15 | 127 | 152585 | 190.49 | 3248 | 3272 | 783.8 |
| A | 15 | 233 | 16133 | 16.41 | 3248 | 3272 | 783.8 |
| A | 11 | 79 | 12884 | 12.26 | 3248 | 3272 | 783.8 |
| B | 0 | 220 | 97605 | 118.7 | 3397 | 3419 | 793.5 |
| B | 2 | 2 | 85935 | 104.0 | 3397 | 3419 | 793.5 |
| B | 15 | 22 | 44268 | 51.48 | 3397 | 3419 | 793.5 |
| C | 9 | 83 | 55133 | 59.68 | 3124 | 3245 | 869.4 |
| C | 7 | 87 | 50641 | 54.52 | 3124 | 3245 | 869.4 |
| C | 3 | 111 | 44676 | 47.65 | 3124 | 3245 | 869.4 |
| D | 7 | 70 | 1361815 | 1482.87 | 2957 | 3056 | 916.3 |
| D | 13 | 200 | 214481 | 230.74 | 2957 | 3056 | 916.3 |
| D | 13 | 169 | 95653 | 101.05 | 2957 | 3056 | 916.3 |
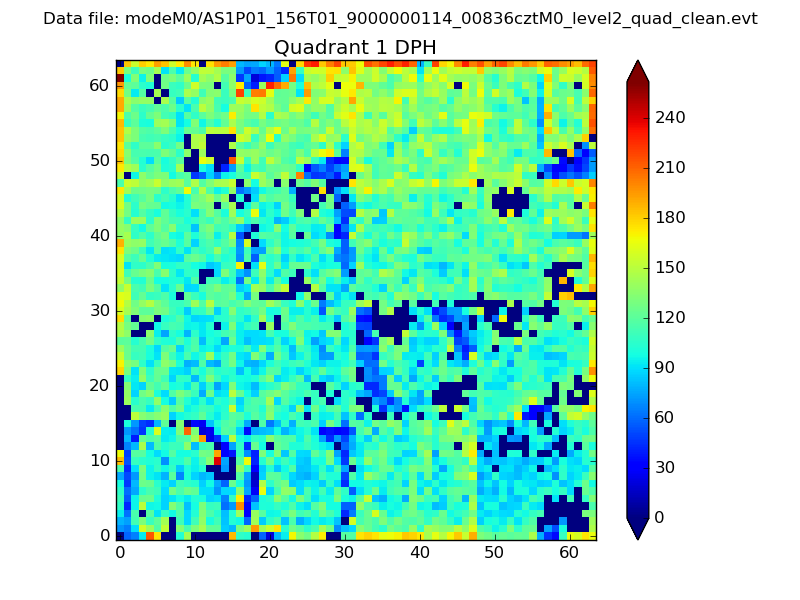
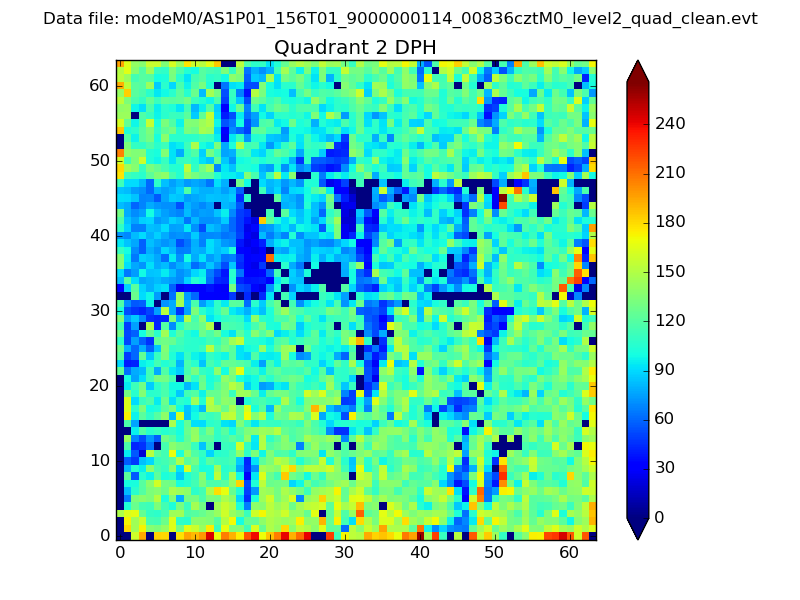
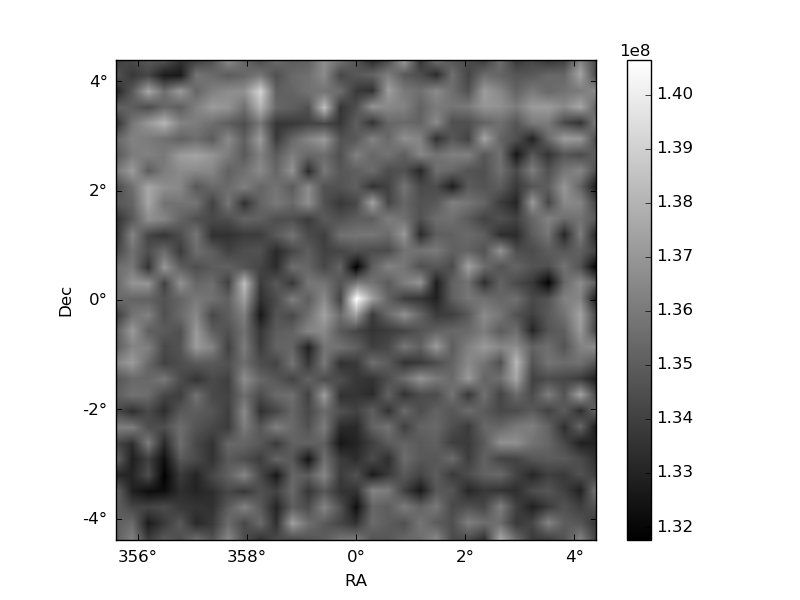
Histogram calculated using DETX and DETY for each event in the final _common_clean file
| Quadrant A | 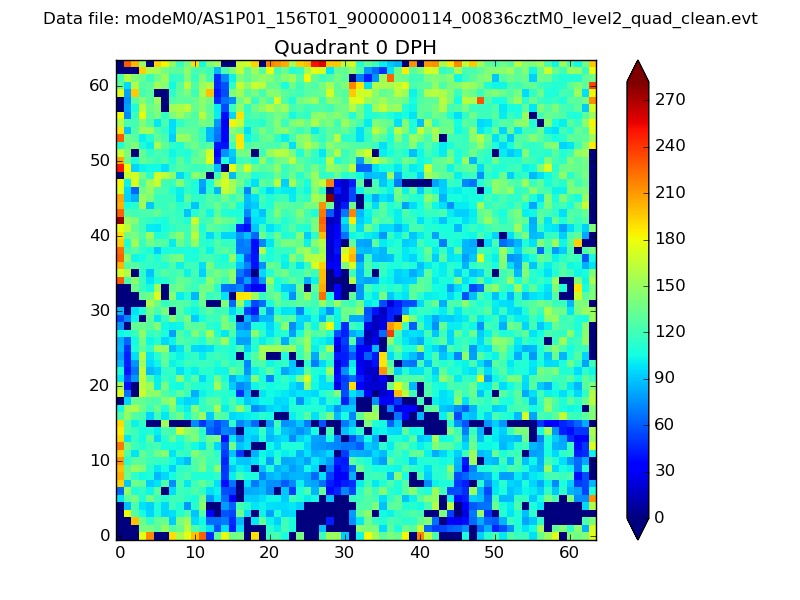 |
 |
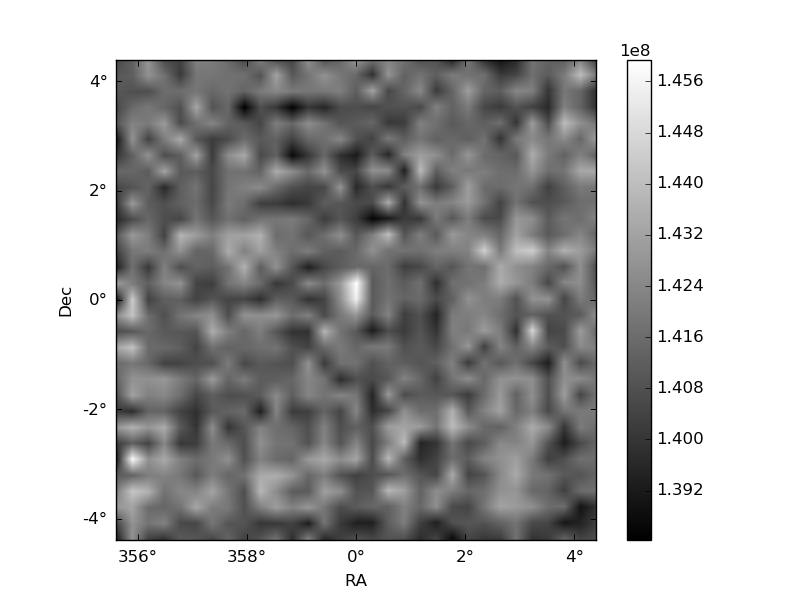
Quadrant B |
|---|---|---|---|
| Quadrant D | 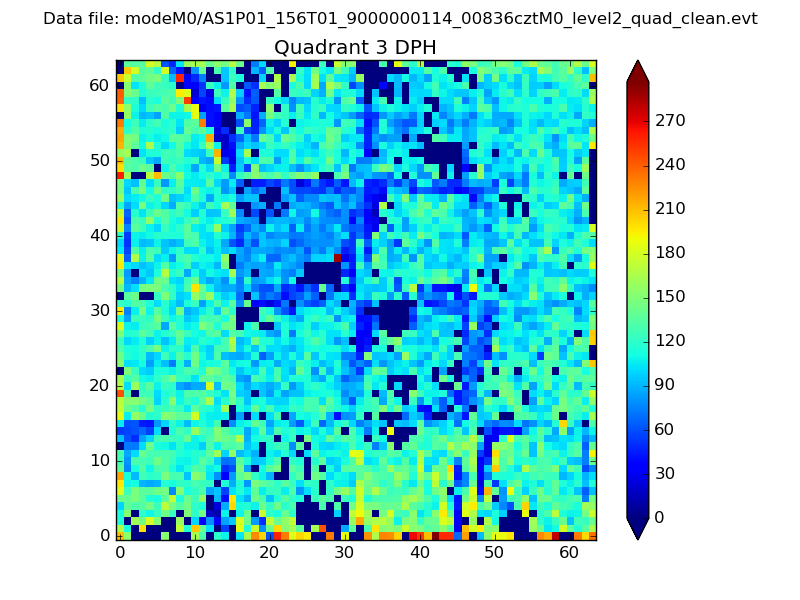 |
 |
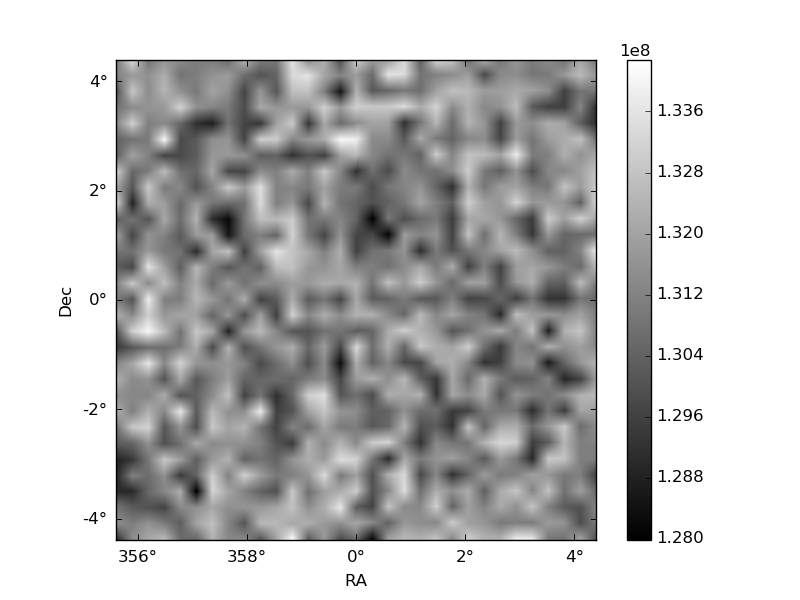
Quadrant C |
| Plot type | Count rate plots | Images |
|---|---|---|
| Comparison with Poisson distribution Blue bars denote a histogram of data divided into 1 sec bins. Red curve is a Poisson curve with rate = median count rate of data. |
 |
 |
| Quadrant-wise count rates Data is divided into 100 sec bins |
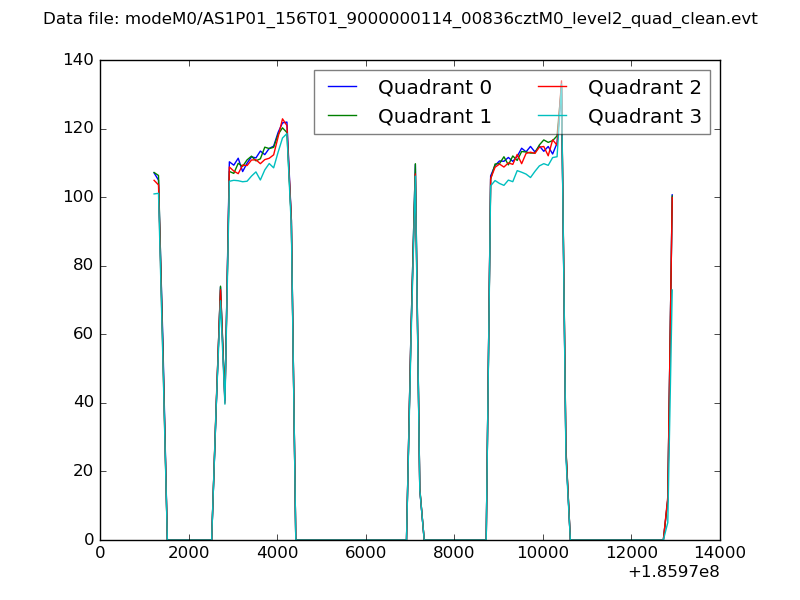 |
|
| Module-wise count rates for Quadrant A Data is divided into 100 sec bins |
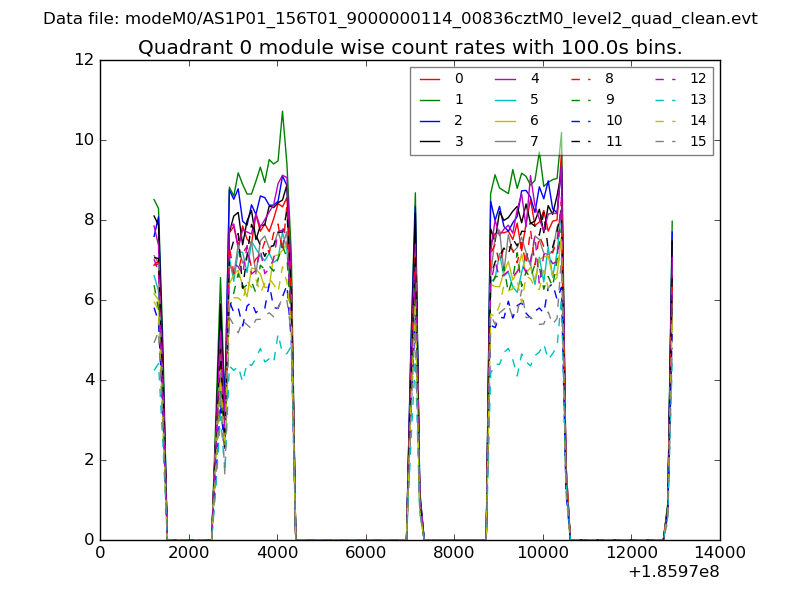 |
 |
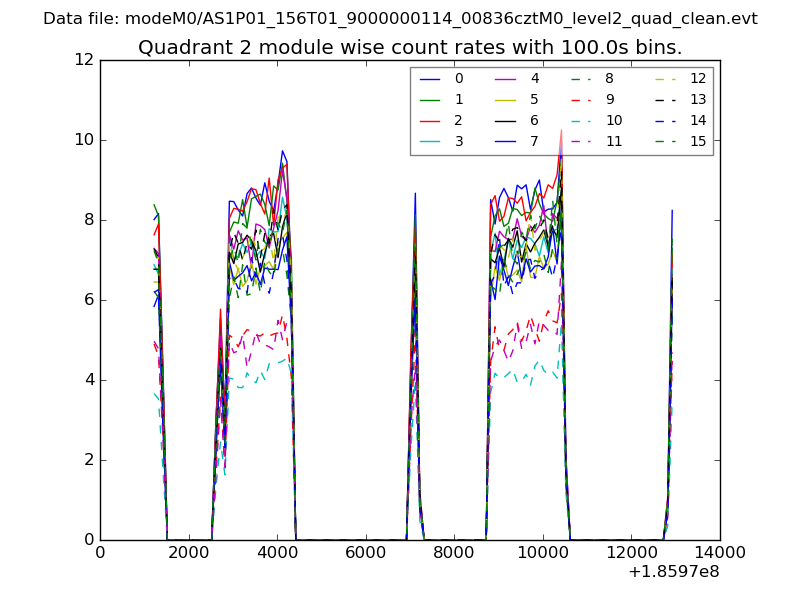
| Module-wise count rates for Quadrant B Data is divided into 100 sec bins |
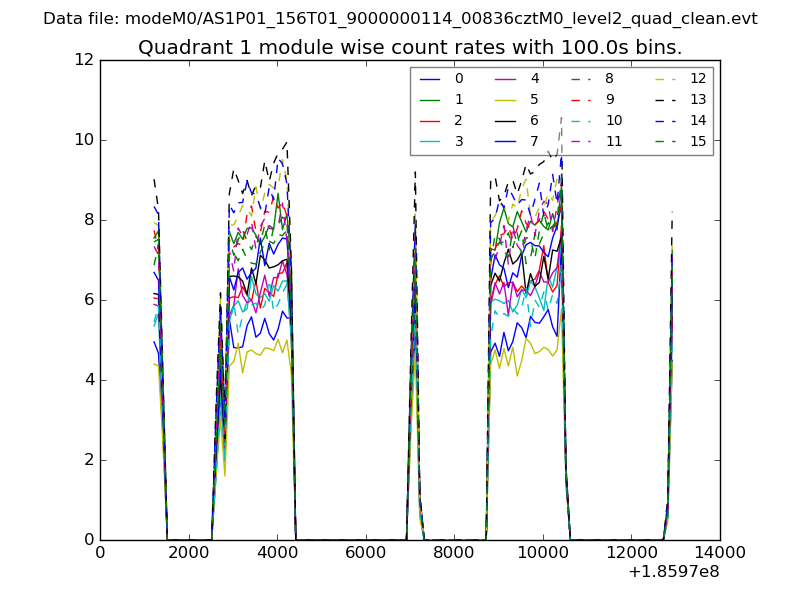 |
 |
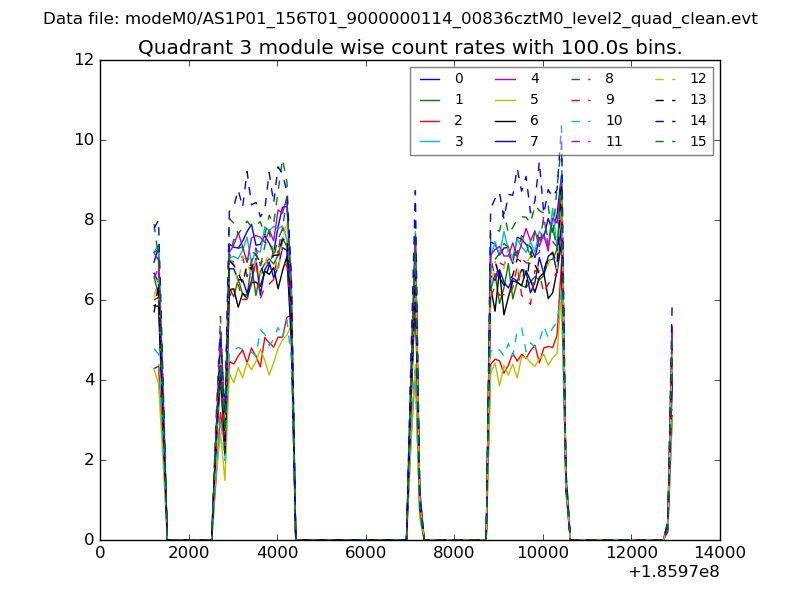
| Module-wise count rates for Quadrant C Data is divided into 100 sec bins |
 |
 |
| Module-wise count rates for Quadrant D Data is divided into 100 sec bins |
 |
 |
| Parameter | Plot |
|---|---|
| CZT HV Monitor | 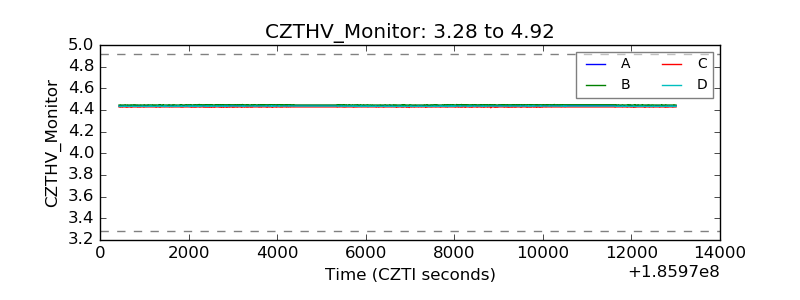 |
| D_VDD | 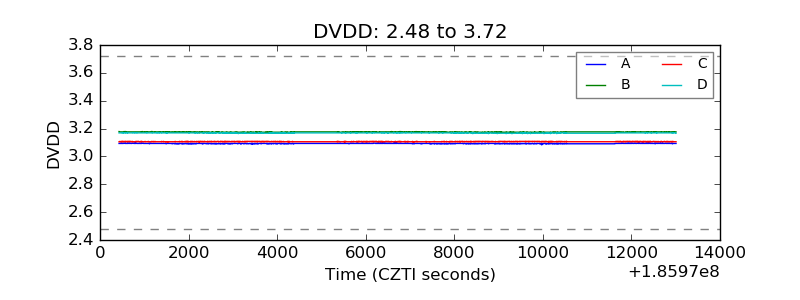 |
| Temperature 1 | 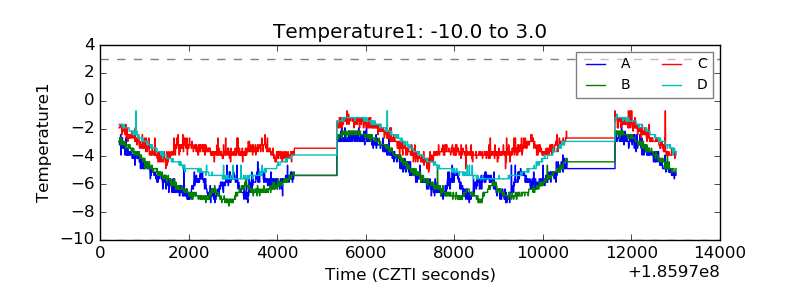 |
| Veto HV Monitor | 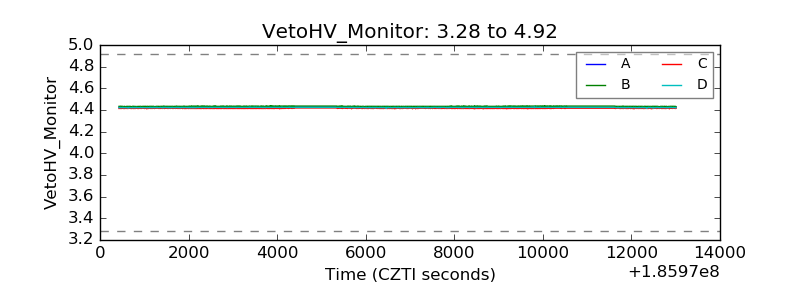 |
| Veto LLD | 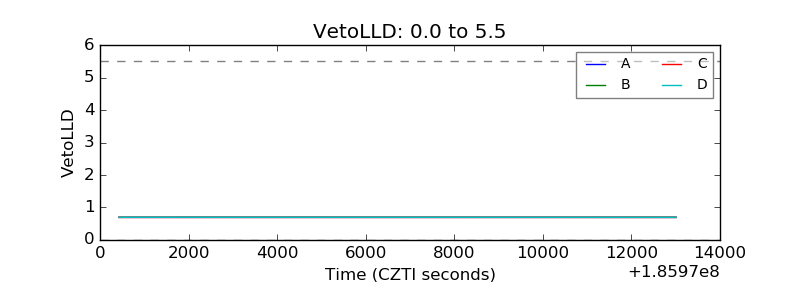 |
| Alpha Counter | 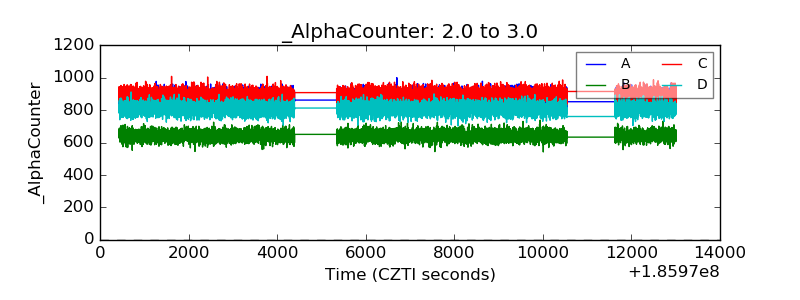 |
| _CPM_Rate | 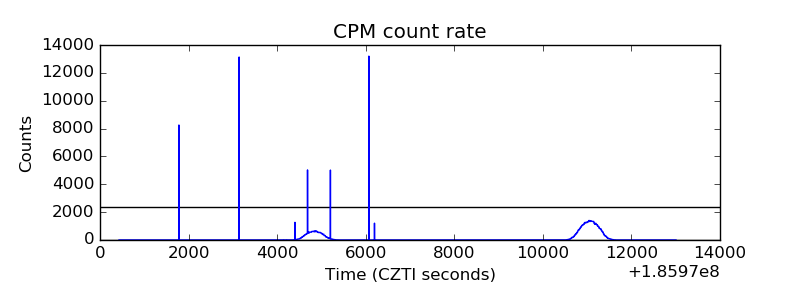 |
| CZT Counter | 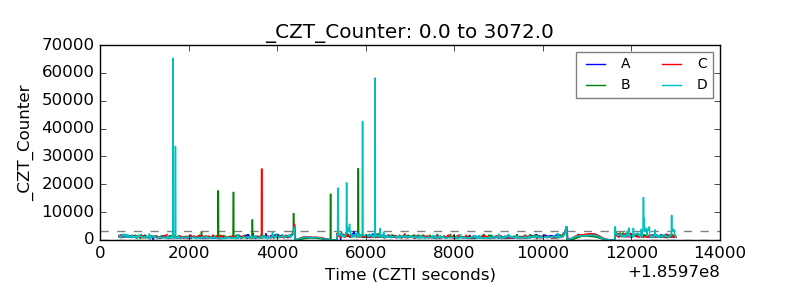 |
| +2.5 Volts monitor |  |
| +5 Volts monitor |  |
| _ROLL_ROT | 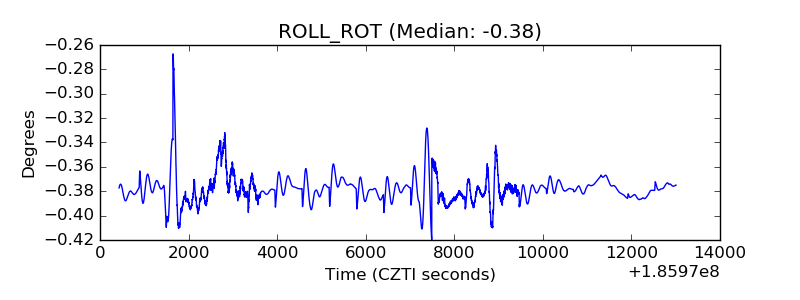 |
| _Roll_DEC | 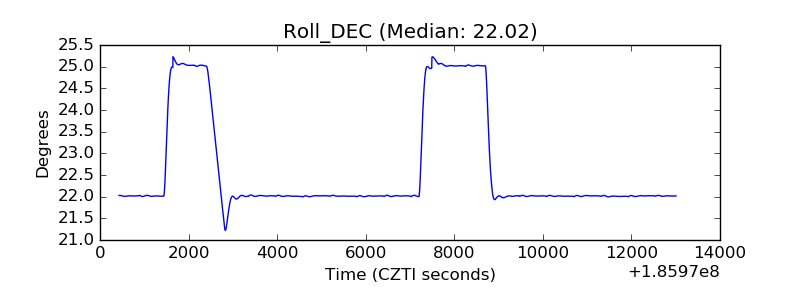 |
| _Roll_RA | 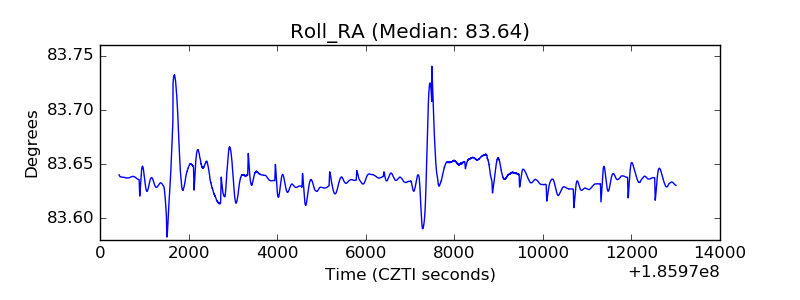 |
| Veto Counter | 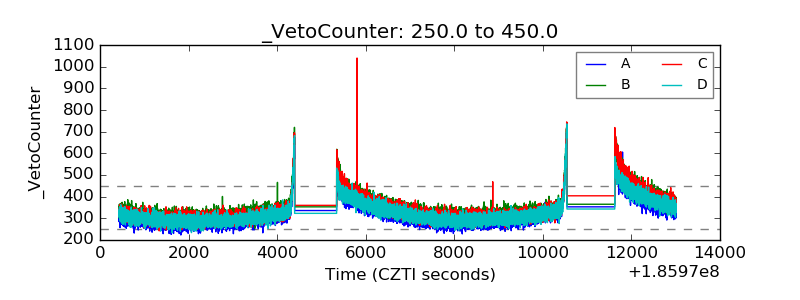 |