| Param | Original file | Final file |
|---|---|---|
| Filename | modeM0/AS1P01_165T02_9000000116_00838cztM0_level2.evt | modeM0/AS1P01_165T02_9000000116_00838cztM0_level2_quad_clean.evt |
| Size (bytes) | 899,038,080 | 57,902,400 |
| Size | 857.4 MB | 55.2 MB |
| Events in quadrant A | 6,822,371 | 347,281 |
| Events in quadrant B | 7,013,041 | 344,816 |
| Events in quadrant C | 6,518,229 | 341,784 |
| Events in quadrant D | 6,513,379 | 338,786 |
| Mode M9 | |||
|---|---|---|---|
| Quadrant | BADHDUFLAG | Total packets | Discarded packets |
| A | 0 | 13 | 0 |
| B | 0 | 13 | 0 |
| C | 0 | 13 | 0 |
| D | 0 | 13 | 0 |
| Mode SS | |||
|---|---|---|---|
| Quadrant | BADHDUFLAG | Total packets | Discarded packets |
| A | 0 | 110 | 0 |
| B | 0 | 110 | 0 |
| C | 0 | 110 | 0 |
| D | 0 | 110 | 0 |
| Mode M0 | |||
|---|---|---|---|
| Quadrant | BADHDUFLAG | Total packets | Discarded packets |
| A | 0 | 24117 | 0 |
| B | 0 | 24688 | 0 |
| C | 0 | 23211 | 0 |
| D | 0 | 23220 | 0 |
| Quadrant | Total seconds | Saturated seconds | Saturation percentage |
|---|---|---|---|
| A | 5434 | 44 | 0.809717% |
| B | 5434 | 40 | 0.736106% |
| C | 5435 | 31 | 0.570377% |
| D | 5435 | 44 | 0.809568% |
Noise dominated data is calculated using 1-second bins in cleaned event files. If a bin has >2000 counts, and if more than 50% of those come from <1% of pixels, then it is considered to be noise-dominated and hence unusable.
| Quadrant | # 1 sec bins | Bins with >0 counts | Bins with >2000 counts | High rate bins dominated by noise | Noise dominated (total time) | Noise dominated (detector-on time) | Marked lightcurve |
|---|---|---|---|---|---|---|---|
| A | 6704 | 5434 | 334 | 334 | 4.98% | 6.15% | 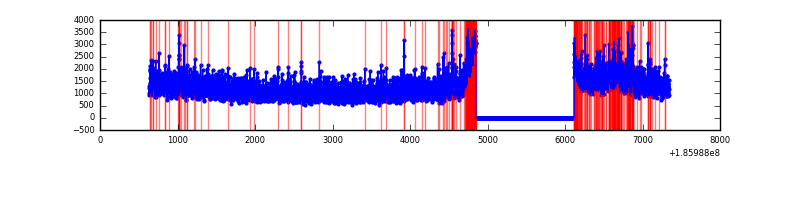 |
| B | 6704 | 5434 | 324 | 324 | 4.83% | 5.96% | 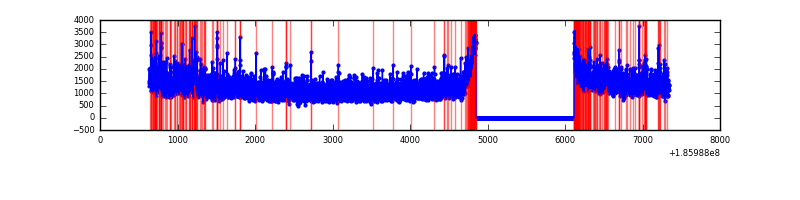 |
| C | 6705 | 5435 | 175 | 175 | 2.61% | 3.22% | 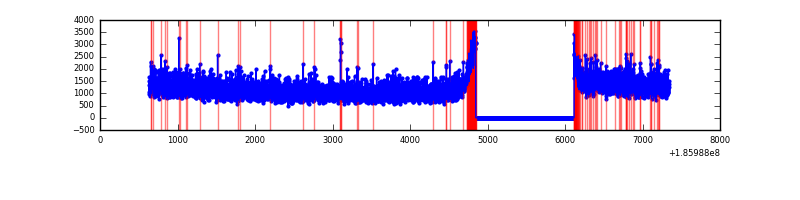 |
| D | 6705 | 5435 | 264 | 264 | 3.94% | 4.86% | 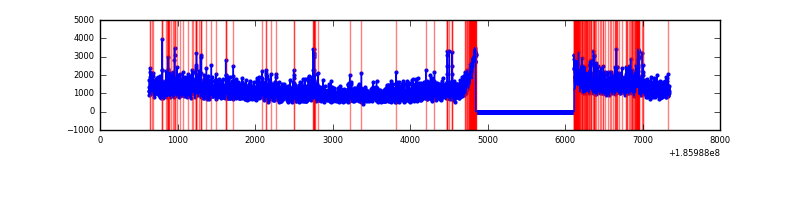 |
Top three noisy pixels from each quadrant. If the there are fewer than three noisy pixels in the level2.evt file, extra rows are filled as -1
| Pixel properties | Quadrant properties | ||||||
|---|---|---|---|---|---|---|---|
| Quadrant | DetID | PixID | Counts | Sigma | Mean | Median | Sigma |
| A | 15 | 127 | 290512 | 709.6 | 1694 | 1709 | 407.0 |
| A | 15 | 171 | 23313 | 53.08 | 1694 | 1709 | 407.0 |
| A | 7 | 16 | 8173 | 15.88 | 1694 | 1709 | 407.0 |
| B | 5 | 191 | 111685 | 266.25 | 1776 | 1785 | 412.8 |
| B | 8 | 38 | 99869 | 237.62 | 1776 | 1785 | 412.8 |
| B | 0 | 220 | 15640 | 33.57 | 1776 | 1785 | 412.8 |
| C | 8 | 208 | 51131 | 109.48 | 1634 | 1693 | 451.6 |
| C | 3 | 111 | 26840 | 55.69 | 1634 | 1693 | 451.6 |
| C | 3 | 79 | 21625 | 44.14 | 1634 | 1693 | 451.6 |
| D | 13 | 200 | 383754 | 786.86 | 1578 | 1635 | 485.6 |
| D | 10 | 157 | 50146 | 99.89 | 1578 | 1635 | 485.6 |
| D | 1 | 4 | 34163 | 66.98 | 1578 | 1635 | 485.6 |
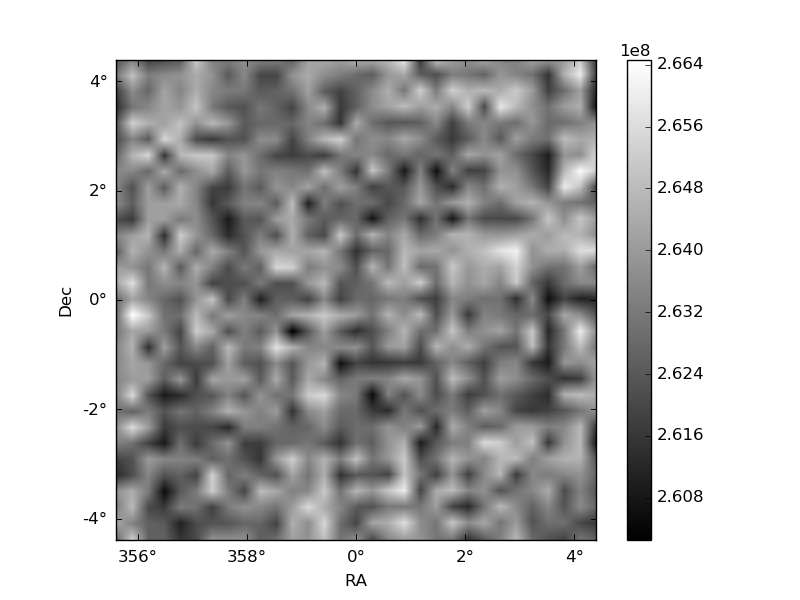
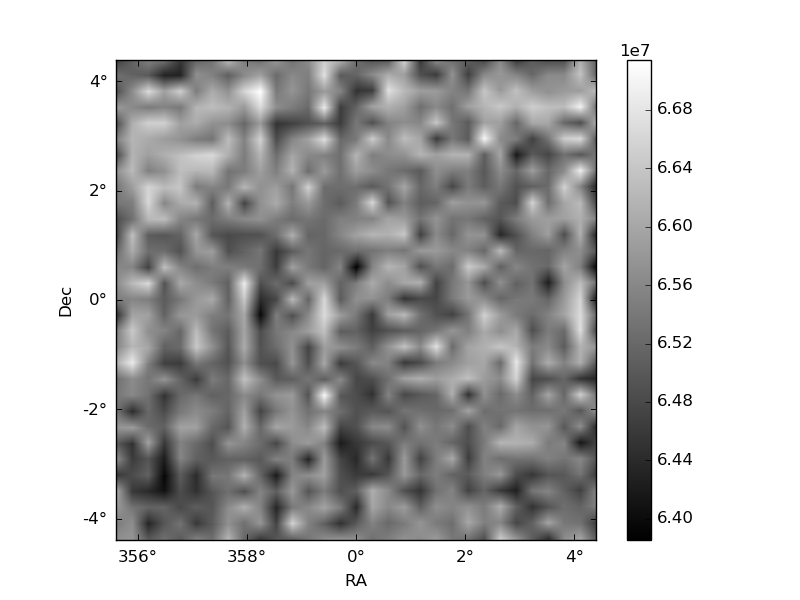
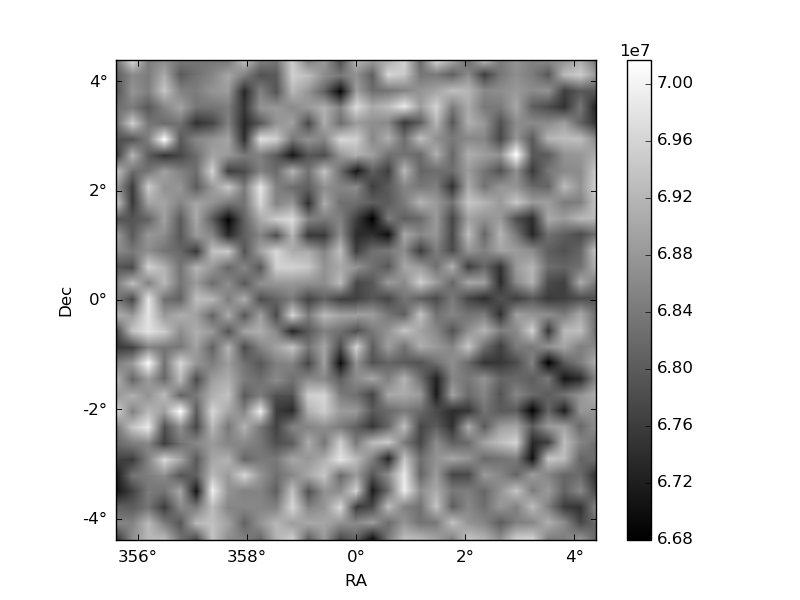
Histogram calculated using DETX and DETY for each event in the final _common_clean file
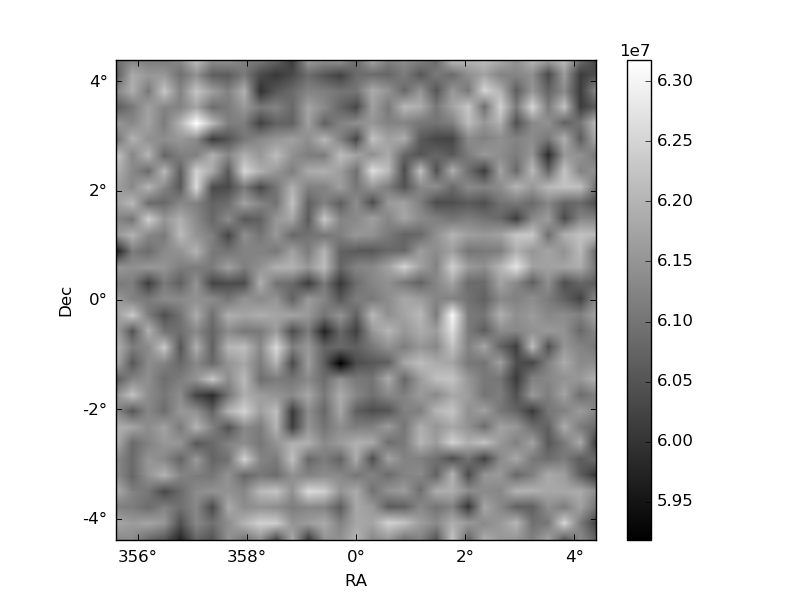
| Quadrant A | 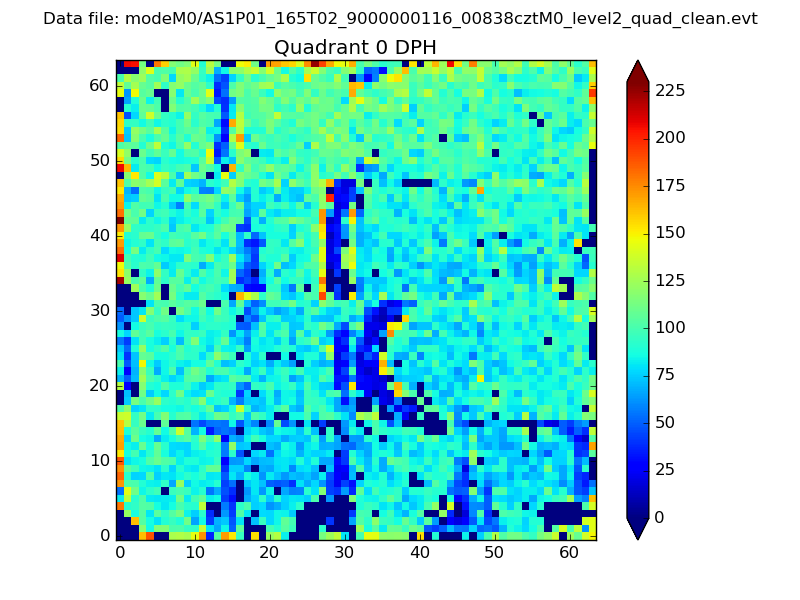 |
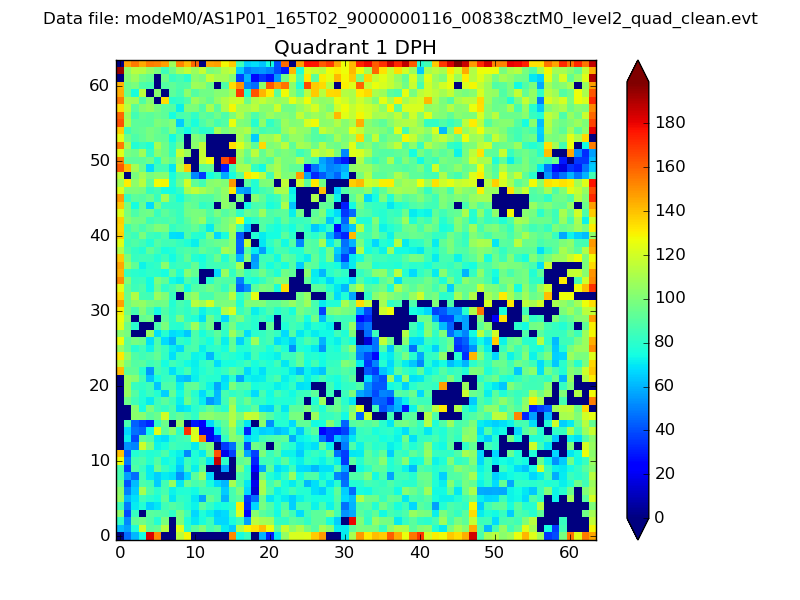 |
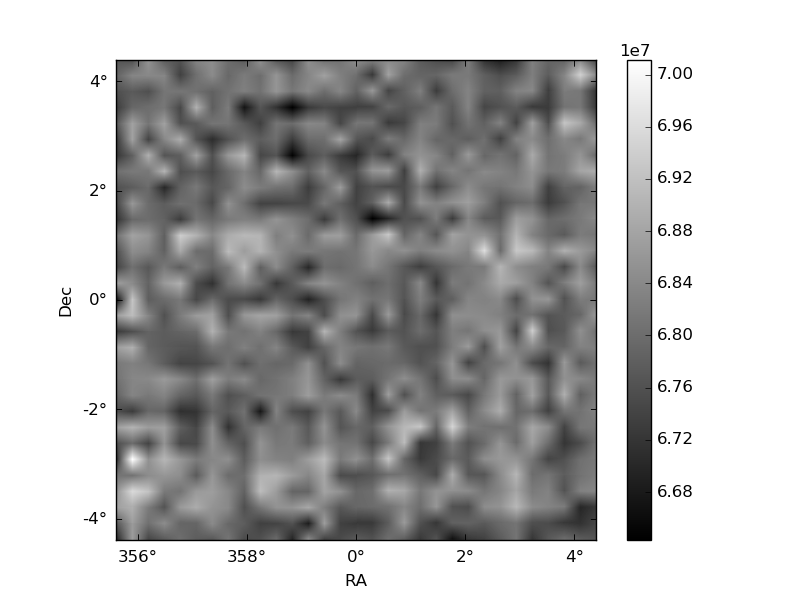
Quadrant B |
|---|---|---|---|
| Quadrant D | 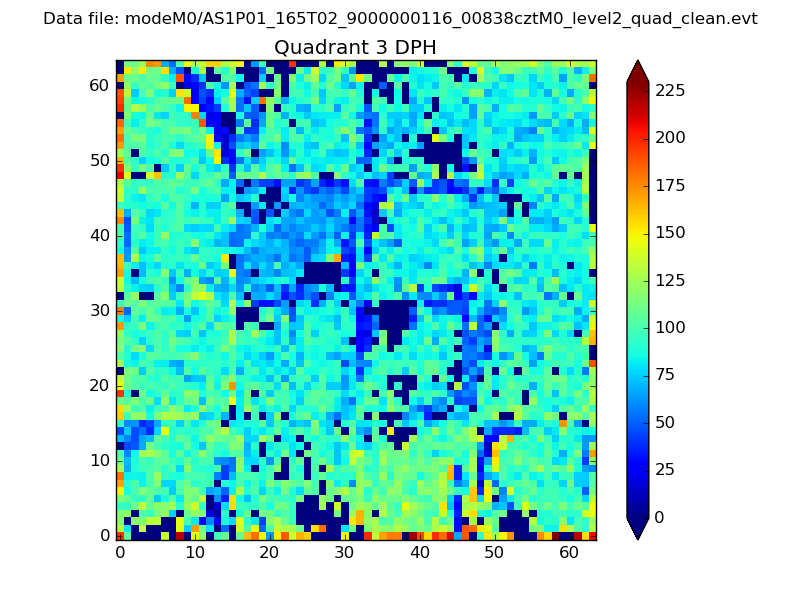 |
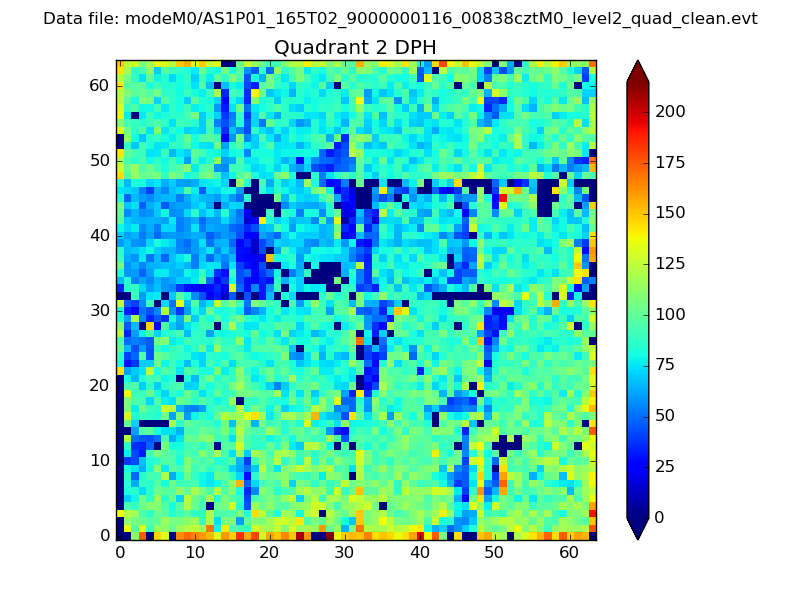 |
Quadrant C |
| Plot type | Count rate plots | Images |
|---|---|---|
| Comparison with Poisson distribution Blue bars denote a histogram of data divided into 1 sec bins. Red curve is a Poisson curve with rate = median count rate of data. |
 |
 |
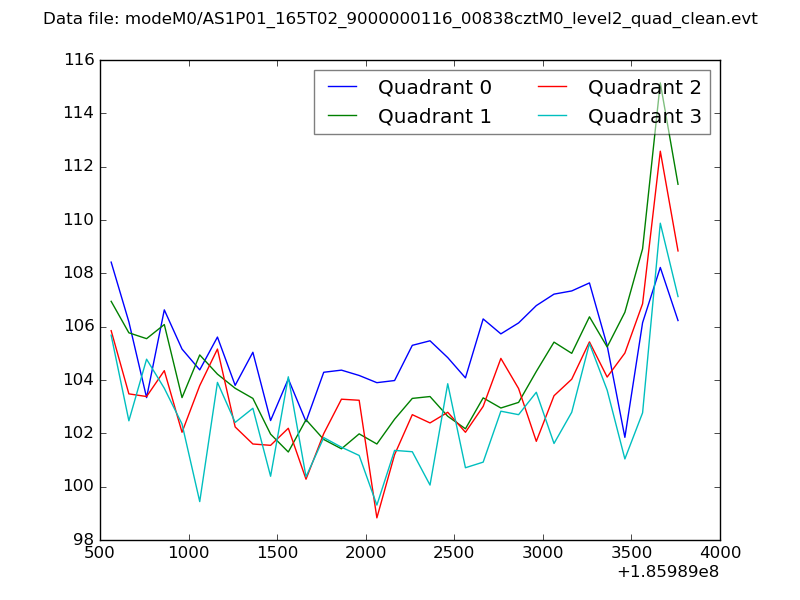
| Quadrant-wise count rates Data is divided into 100 sec bins |
 |
|
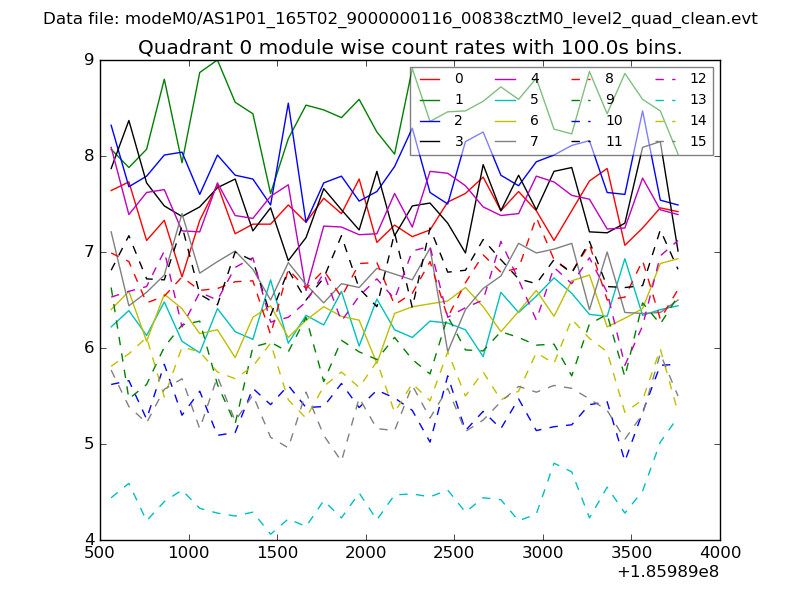
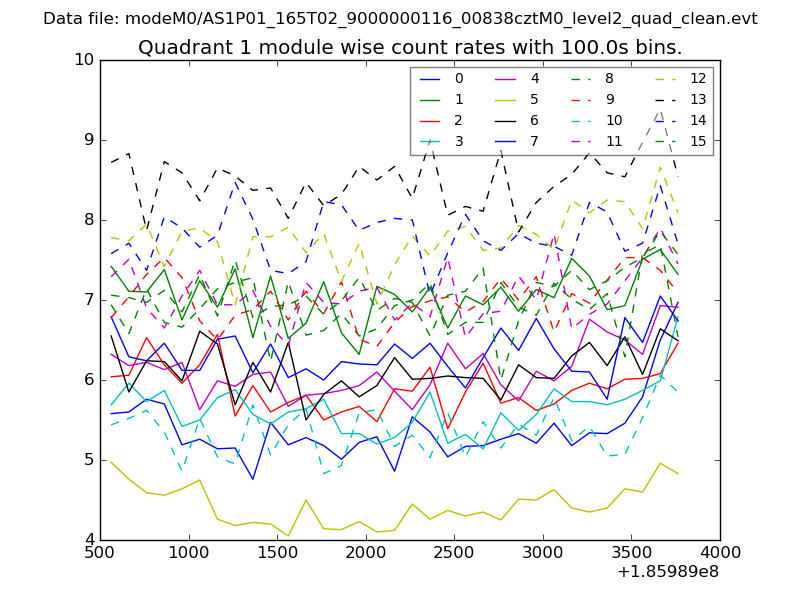
| Module-wise count rates for Quadrant A Data is divided into 100 sec bins |
 |
 |
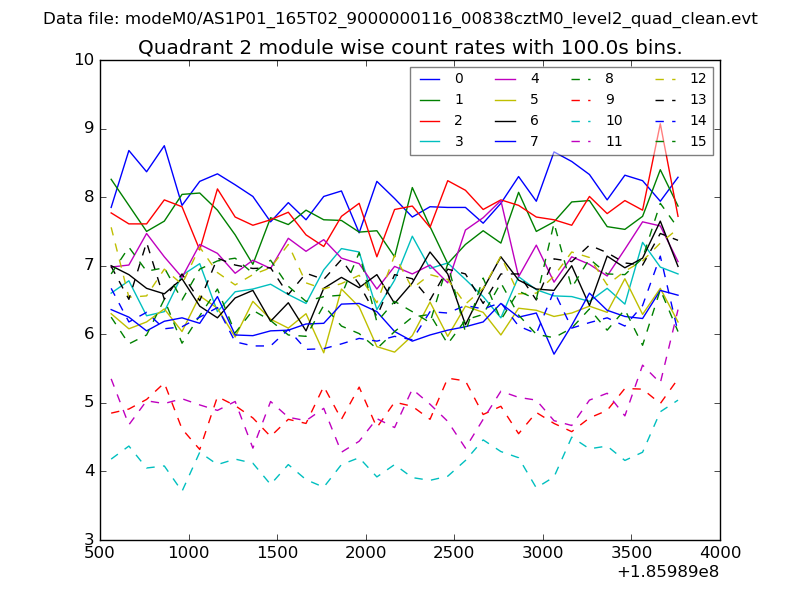
| Module-wise count rates for Quadrant B Data is divided into 100 sec bins |
 |
 |
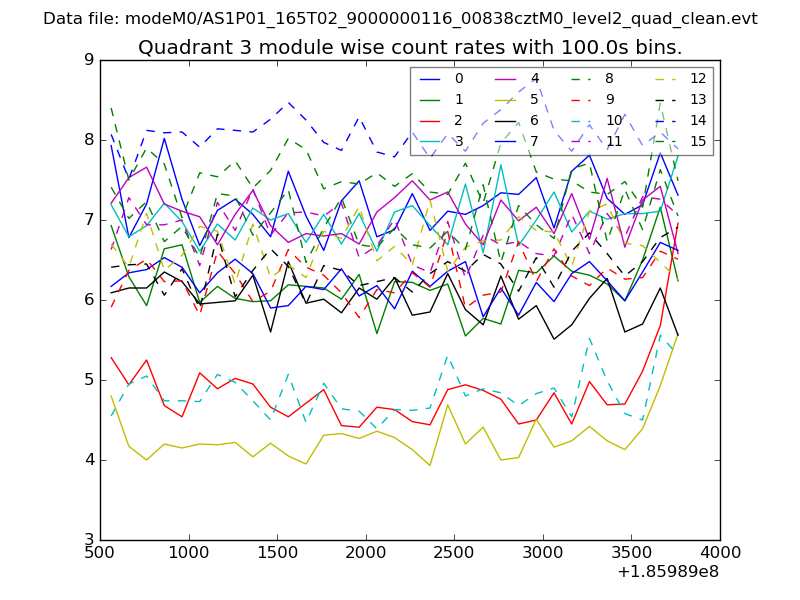
| Module-wise count rates for Quadrant C Data is divided into 100 sec bins |
 |
 |
| Module-wise count rates for Quadrant D Data is divided into 100 sec bins |
 |
 |
| Parameter | Plot |
|---|---|
| CZT HV Monitor | 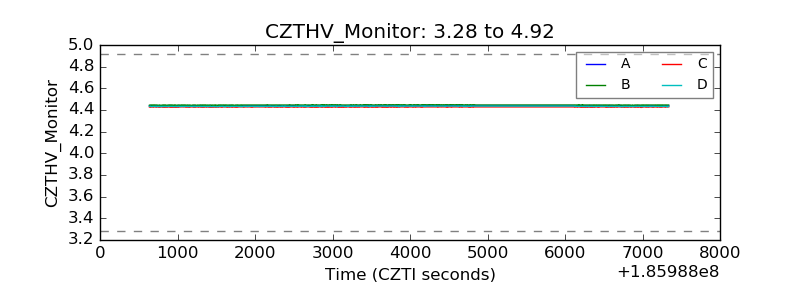 |
| D_VDD |  |
| Temperature 1 | 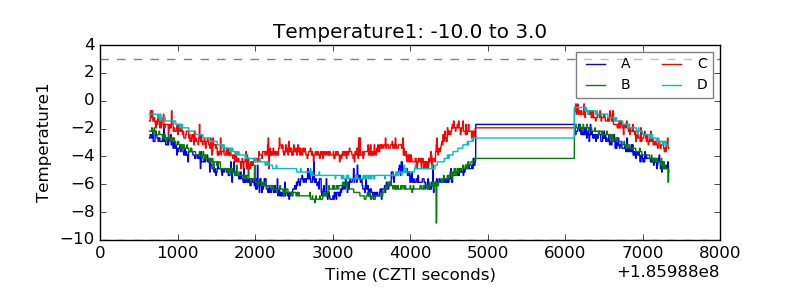 |
| Veto HV Monitor | 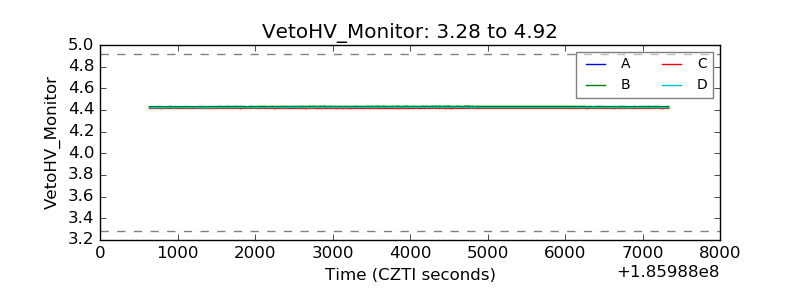 |
| Veto LLD | 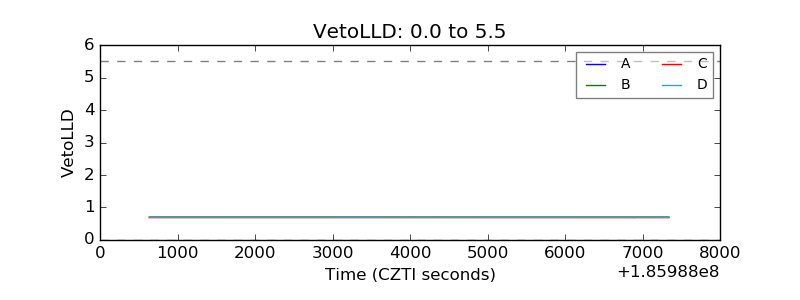 |
| Alpha Counter | 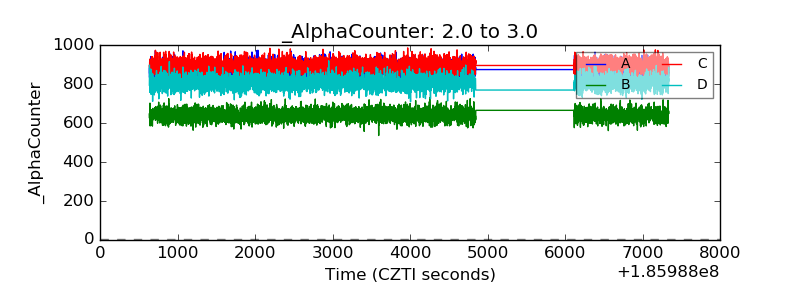 |
| _CPM_Rate | 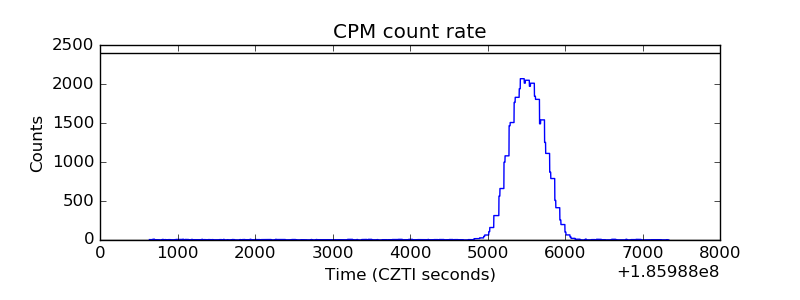 |
| CZT Counter | 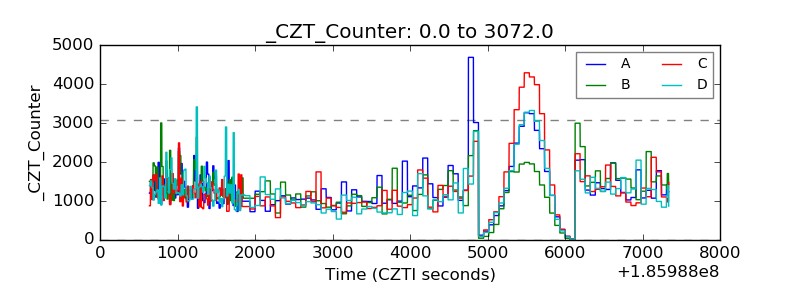 |
| +2.5 Volts monitor |  |
| +5 Volts monitor |  |
| _ROLL_ROT | 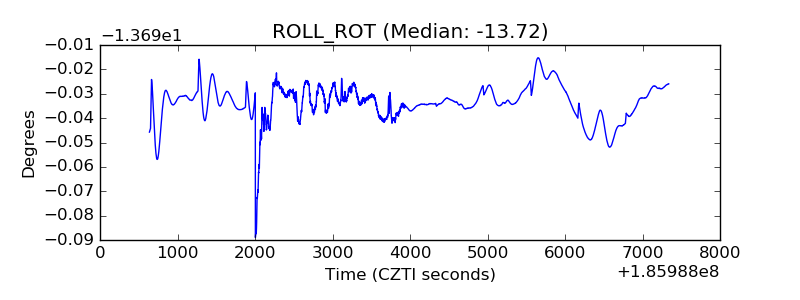 |
| _Roll_DEC | 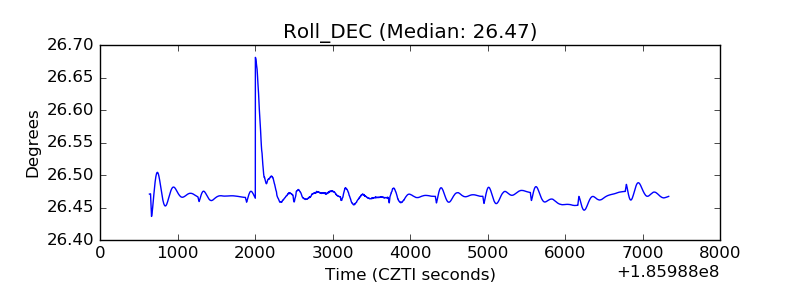 |
| _Roll_RA | 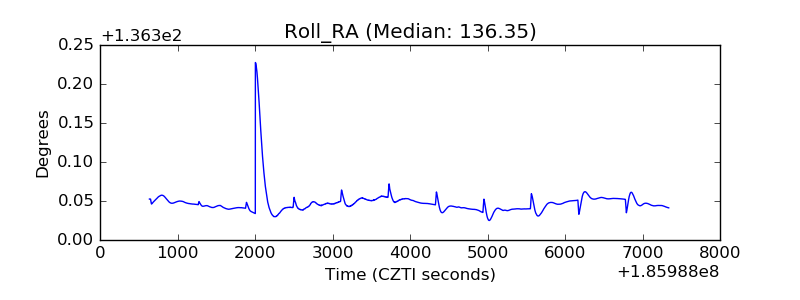 |
| Veto Counter | 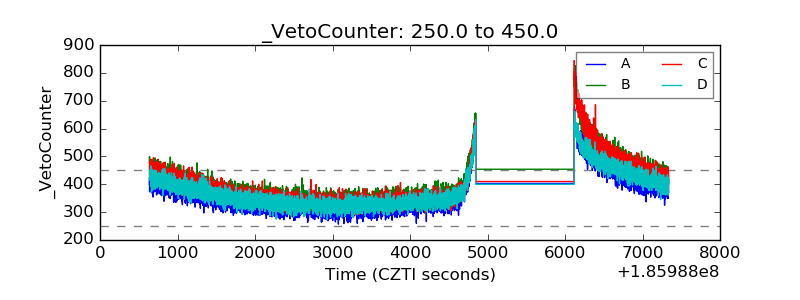 |