| Param | Original file | Final file |
|---|---|---|
| Filename | modeM0/AS1P01_165T02_9000000116_00839cztM0_level2.evt | modeM0/AS1P01_165T02_9000000116_00839cztM0_level2_quad_clean.evt |
| Size (bytes) | 1,042,758,720 | 72,011,520 |
| Size | 994.5 MB | 68.7 MB |
| Events in quadrant A | 8,052,905 | 439,505 |
| Events in quadrant B | 8,093,296 | 438,830 |
| Events in quadrant C | 7,609,040 | 436,450 |
| Events in quadrant D | 7,412,129 | 430,571 |
| Mode M9 | |||
|---|---|---|---|
| Quadrant | BADHDUFLAG | Total packets | Discarded packets |
| A | 0 | 20 | 0 |
| B | 0 | 20 | 0 |
| C | 0 | 20 | 0 |
| D | 0 | 20 | 0 |
| Mode SS | |||
|---|---|---|---|
| Quadrant | BADHDUFLAG | Total packets | Discarded packets |
| A | 0 | 126 | 0 |
| B | 0 | 126 | 0 |
| C | 0 | 126 | 0 |
| D | 0 | 126 | 0 |
| Mode M0 | |||
|---|---|---|---|
| Quadrant | BADHDUFLAG | Total packets | Discarded packets |
| A | 0 | 28370 | 0 |
| B | 0 | 28396 | 0 |
| C | 0 | 27043 | 0 |
| D | 0 | 26465 | 0 |
| Quadrant | Total seconds | Saturated seconds | Saturation percentage |
|---|---|---|---|
| A | 6237 | 25 | 0.400834% |
| B | 6237 | 33 | 0.529101% |
| C | 6236 | 16 | 0.256575% |
| D | 6236 | 50 | 0.801796% |
Noise dominated data is calculated using 1-second bins in cleaned event files. If a bin has >2000 counts, and if more than 50% of those come from <1% of pixels, then it is considered to be noise-dominated and hence unusable.
| Quadrant | # 1 sec bins | Bins with >0 counts | Bins with >2000 counts | High rate bins dominated by noise | Noise dominated (total time) | Noise dominated (detector-on time) | Marked lightcurve |
|---|---|---|---|---|---|---|---|
| A | 7582 | 6238 | 411 | 411 | 5.42% | 6.59% | 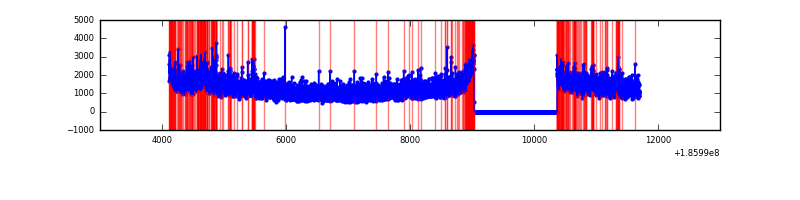 |
| B | 7582 | 6238 | 355 | 355 | 4.68% | 5.69% | 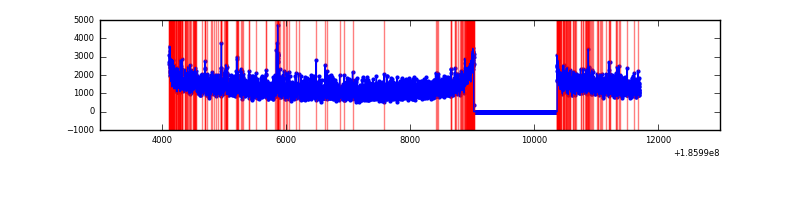 |
| C | 7581 | 6237 | 242 | 242 | 3.19% | 3.88% | 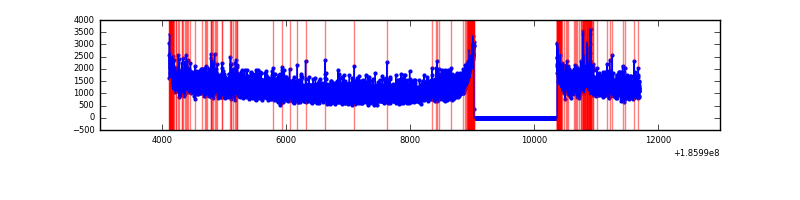 |
| D | 7581 | 6237 | 319 | 319 | 4.21% | 5.11% | 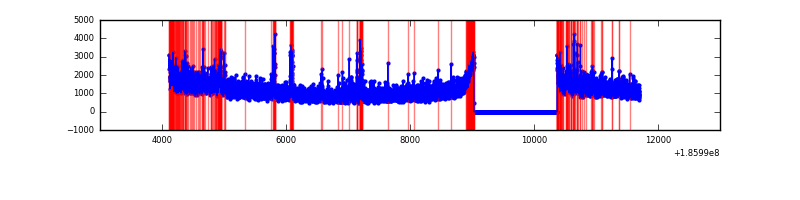 |
Top three noisy pixels from each quadrant. If the there are fewer than three noisy pixels in the level2.evt file, extra rows are filled as -1
| Pixel properties | Quadrant properties | ||||||
|---|---|---|---|---|---|---|---|
| Quadrant | DetID | PixID | Counts | Sigma | Mean | Median | Sigma |
| A | 15 | 127 | 356464 | 748.12 | 1973 | 1986 | 473.8 |
| A | 15 | 171 | 81350 | 167.5 | 1973 | 1986 | 473.8 |
| A | 0 | 253 | 29952 | 59.02 | 1973 | 1986 | 473.8 |
| B | 5 | 191 | 42533 | 84.41 | 2075 | 2086 | 479.2 |
| B | 0 | 220 | 39074 | 77.19 | 2075 | 2086 | 479.2 |
| B | 4 | 222 | 38232 | 75.43 | 2075 | 2086 | 479.2 |
| C | 8 | 208 | 60193 | 111.22 | 1903 | 1970 | 523.5 |
| C | 10 | 34 | 39101 | 70.93 | 1903 | 1970 | 523.5 |
| C | 3 | 111 | 29629 | 52.83 | 1903 | 1970 | 523.5 |
| D | 13 | 200 | 268421 | 478.55 | 1829 | 1889 | 557.0 |
| D | 2 | 16 | 73909 | 129.31 | 1829 | 1889 | 557.0 |
| D | 12 | 188 | 55660 | 96.54 | 1829 | 1889 | 557.0 |
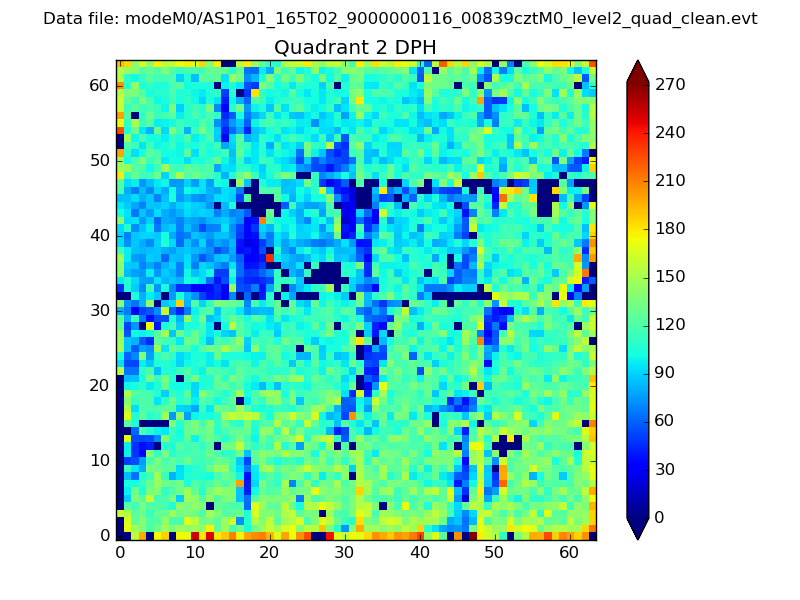
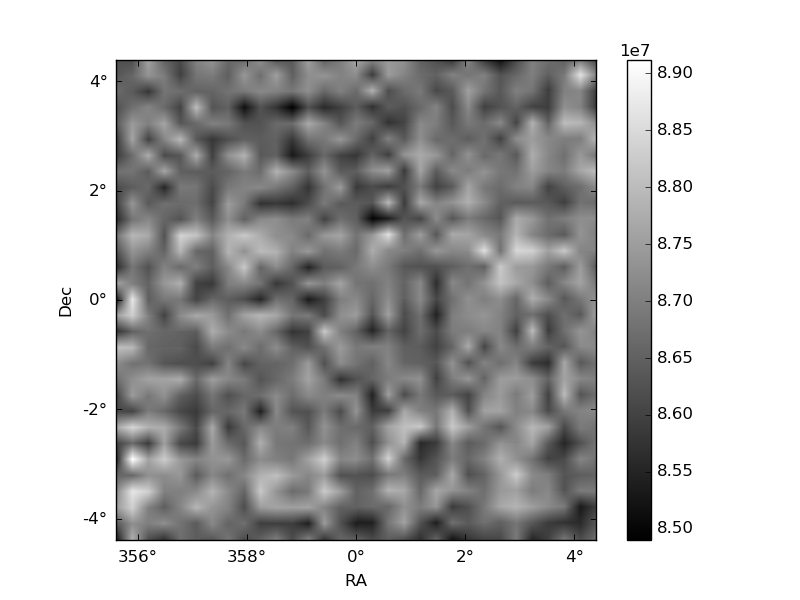
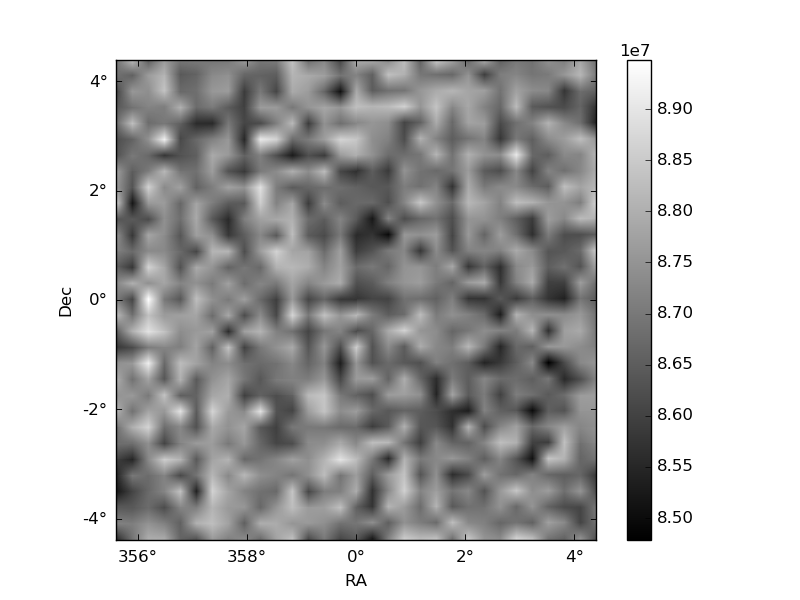
Histogram calculated using DETX and DETY for each event in the final _common_clean file
| Quadrant A | 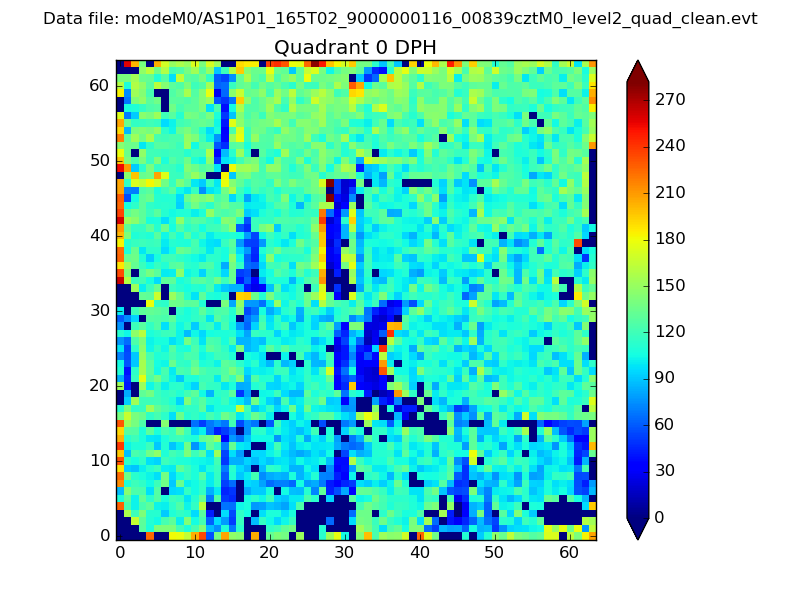 |
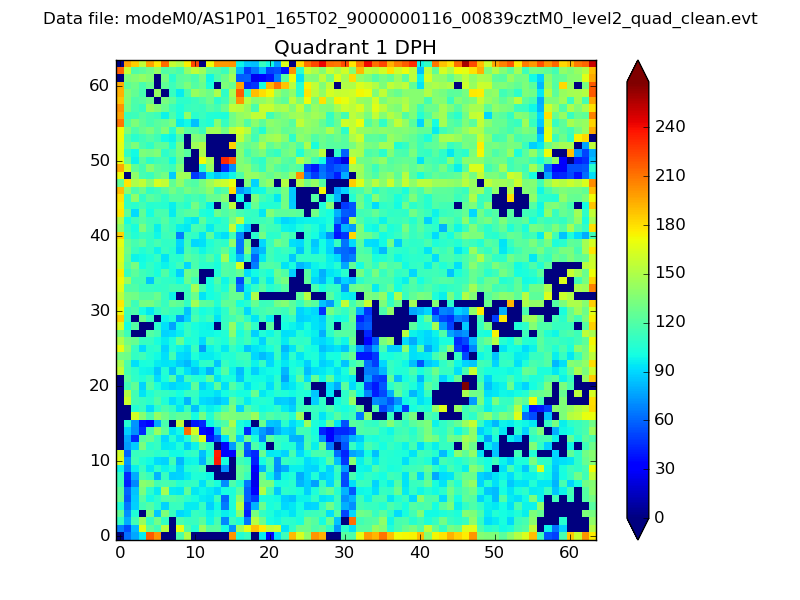 |
Quadrant B |
|---|---|---|---|
| Quadrant D | 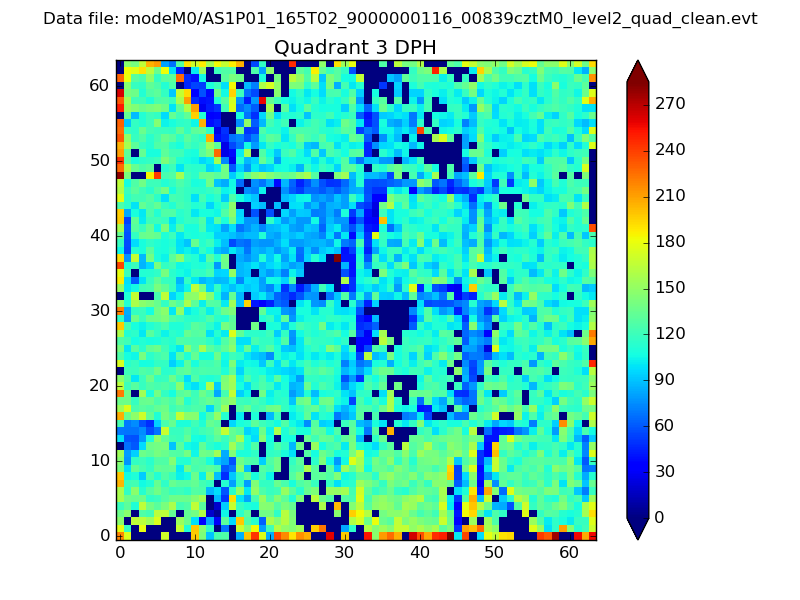 |
 |
Quadrant C |
| Plot type | Count rate plots | Images |
|---|---|---|
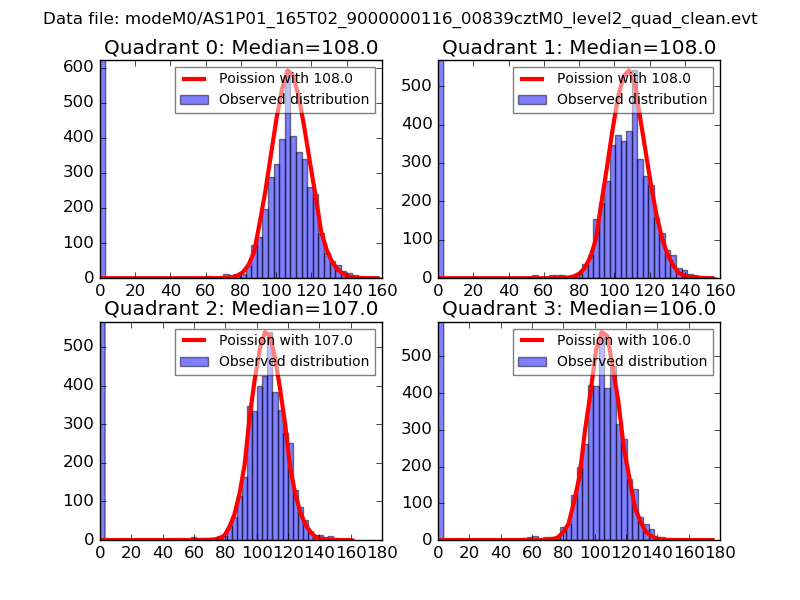
| Comparison with Poisson distribution Blue bars denote a histogram of data divided into 1 sec bins. Red curve is a Poisson curve with rate = median count rate of data. |
 |
 |
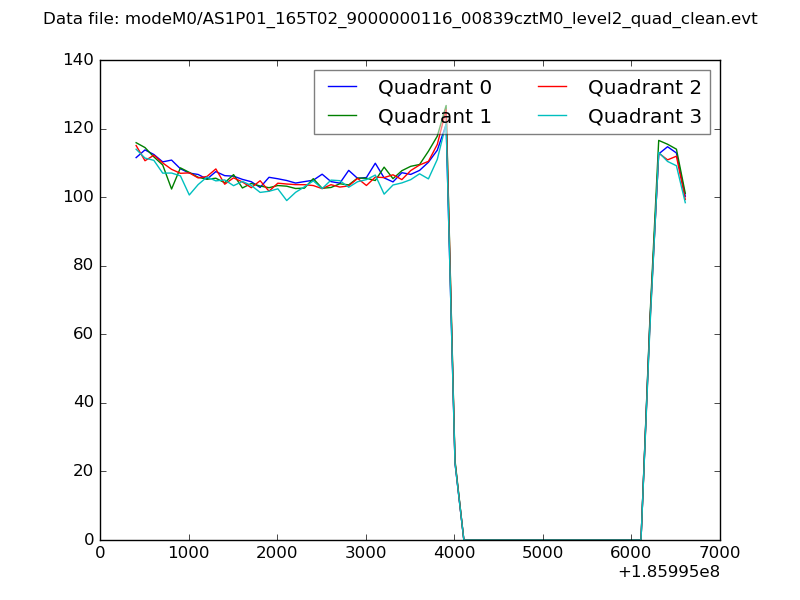
| Quadrant-wise count rates Data is divided into 100 sec bins |
 |
|
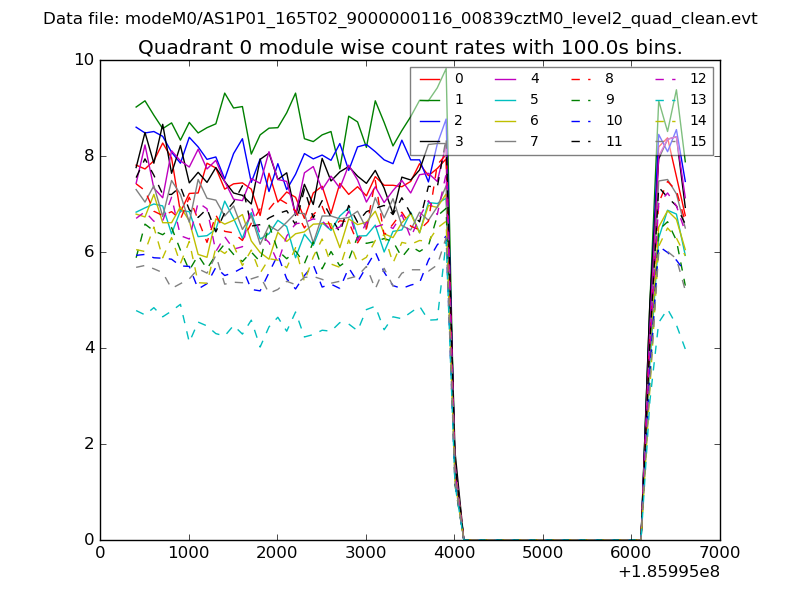
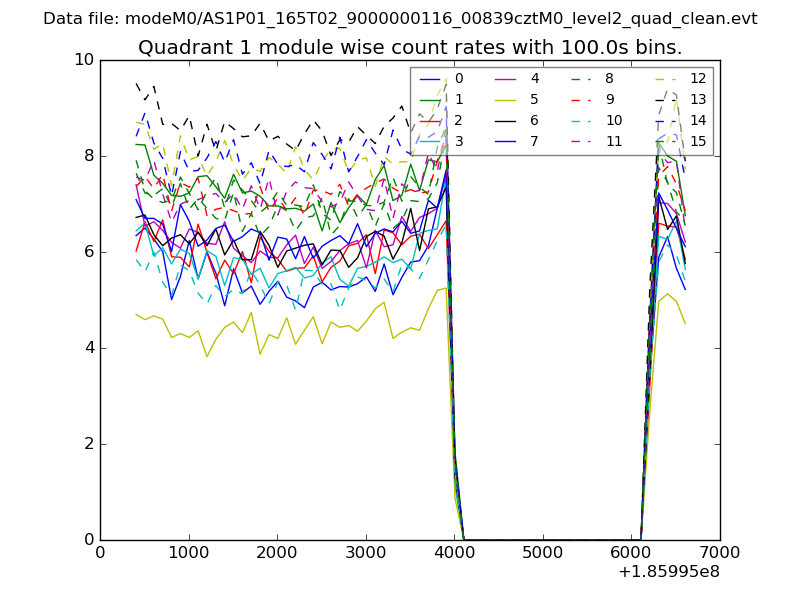
| Module-wise count rates for Quadrant A Data is divided into 100 sec bins |
 |
 |
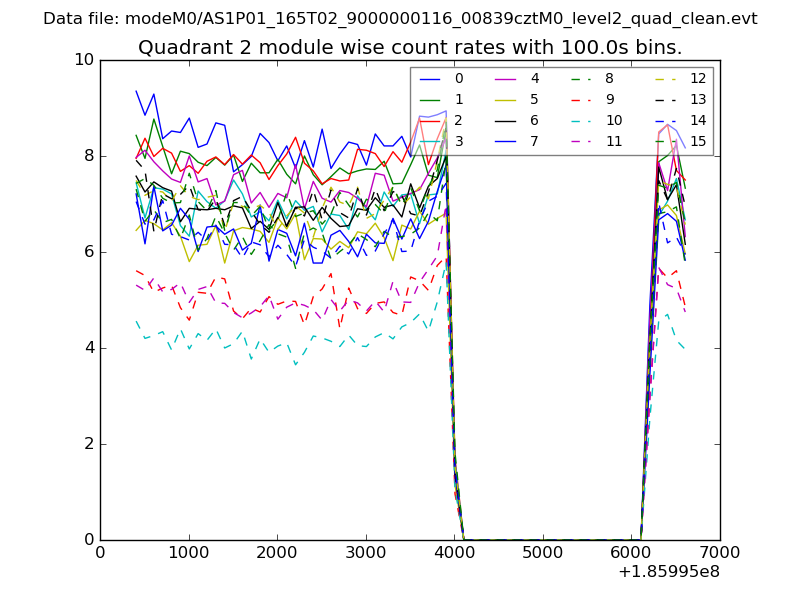
| Module-wise count rates for Quadrant B Data is divided into 100 sec bins |
 |
 |
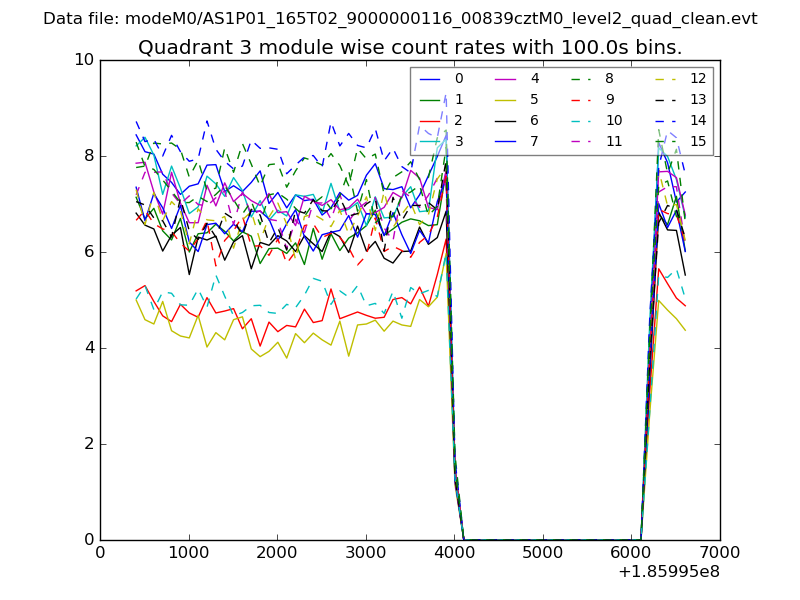
| Module-wise count rates for Quadrant C Data is divided into 100 sec bins |
 |
 |
| Module-wise count rates for Quadrant D Data is divided into 100 sec bins |
 |
 |
| Parameter | Plot |
|---|---|
| CZT HV Monitor | 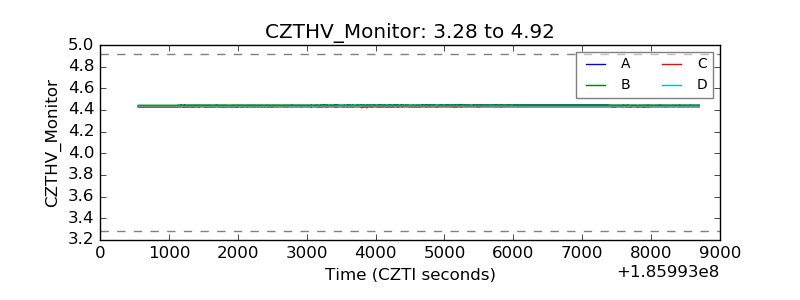 |
| D_VDD |  |
| Temperature 1 | 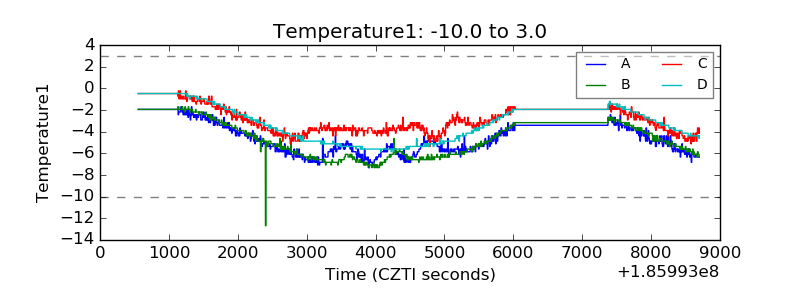 |
| Veto HV Monitor | 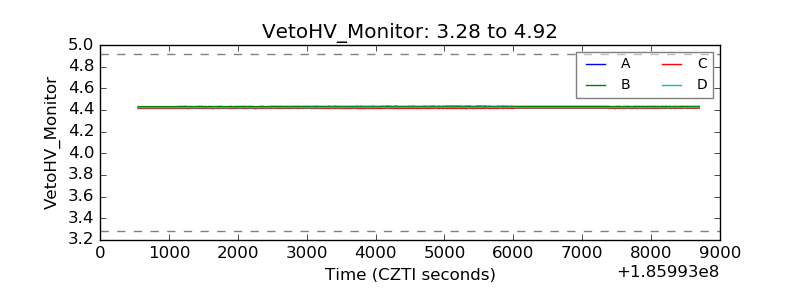 |
| Veto LLD | 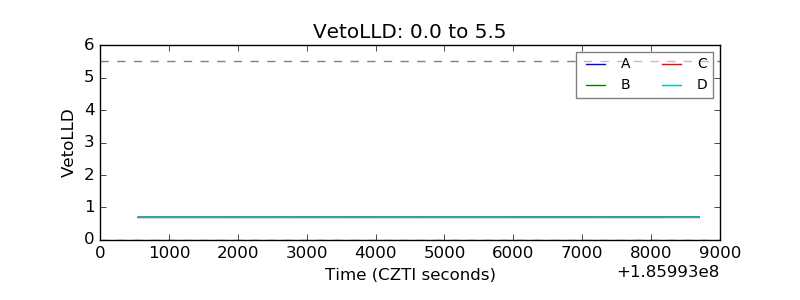 |
| Alpha Counter | 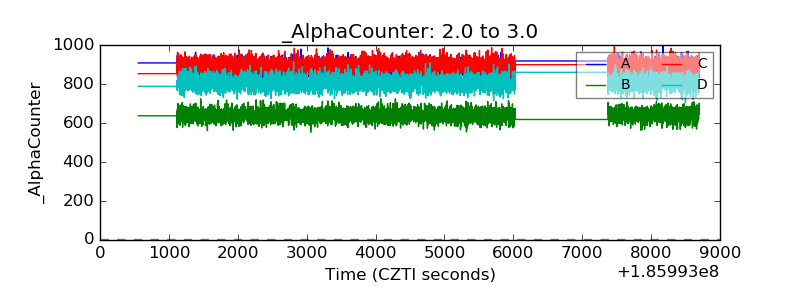 |
| _CPM_Rate | 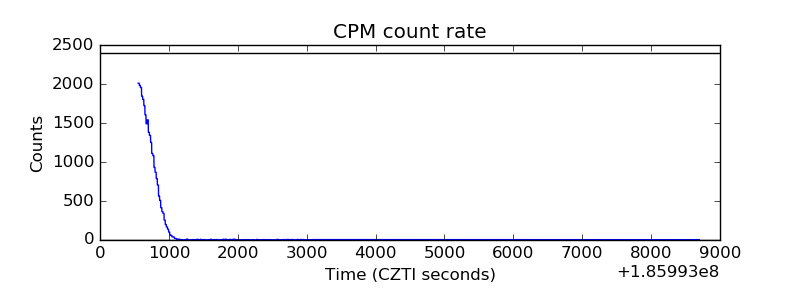 |
| CZT Counter | 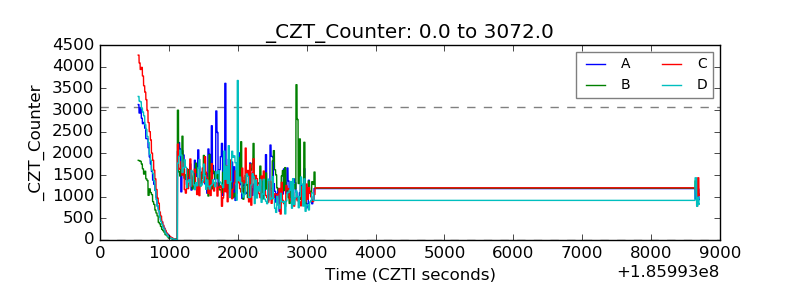 |
| +2.5 Volts monitor |  |
| +5 Volts monitor | 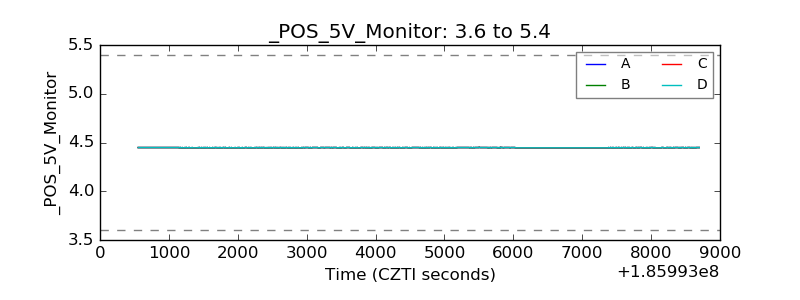 |
| _ROLL_ROT | 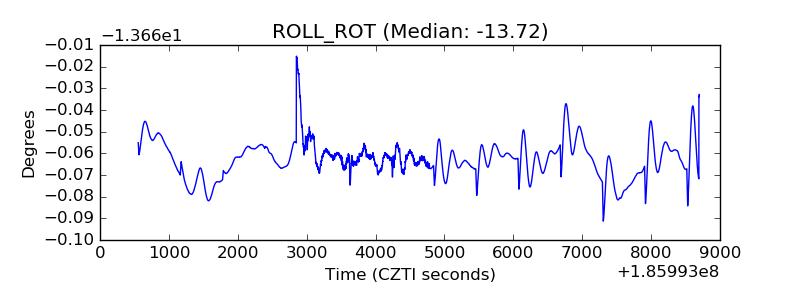 |
| _Roll_DEC | 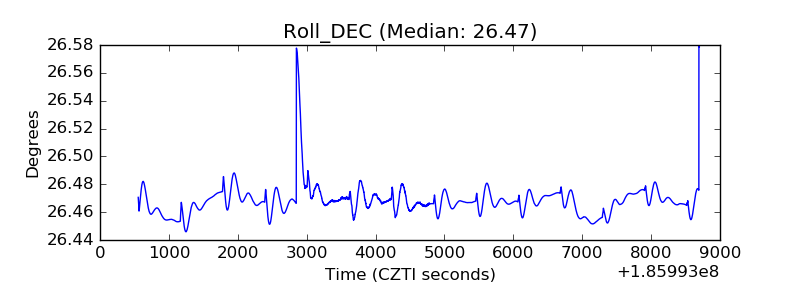 |
| _Roll_RA | 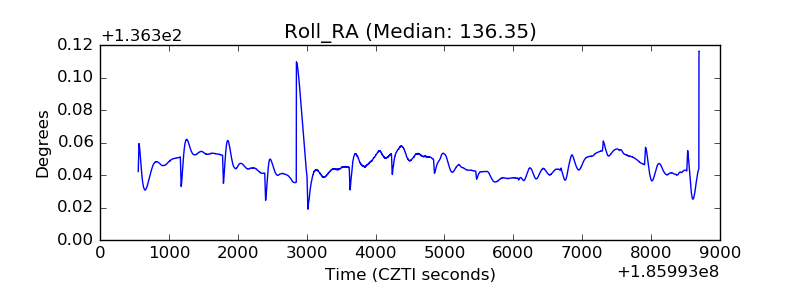 |
| Veto Counter | 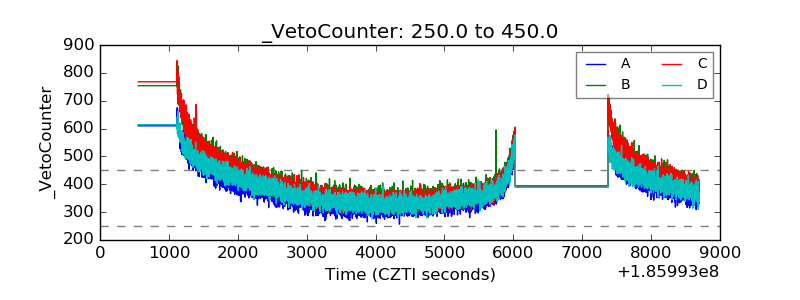 |