| Param | Original file | Final file |
|---|---|---|
| Filename | modeM0/AS1P01_165T02_9000000116_00840cztM0_level2.evt | modeM0/AS1P01_165T02_9000000116_00840cztM0_level2_quad_clean.evt |
| Size (bytes) | 1,175,711,040 | 74,338,560 |
| Size | 1.1 GB | 70.9 MB |
| Events in quadrant A | 11,743,294 | 414,446 |
| Events in quadrant B | 8,430,728 | 468,221 |
| Events in quadrant C | 7,693,846 | 463,725 |
| Events in quadrant D | 7,317,892 | 460,510 |
| Mode M9 | |||
|---|---|---|---|
| Quadrant | BADHDUFLAG | Total packets | Discarded packets |
| A | 0 | 13 | 0 |
| B | 0 | 13 | 0 |
| C | 0 | 13 | 0 |
| D | 0 | 13 | 0 |
| Mode SS | |||
|---|---|---|---|
| Quadrant | BADHDUFLAG | Total packets | Discarded packets |
| A | 0 | 128 | 0 |
| B | 0 | 128 | 0 |
| C | 0 | 128 | 0 |
| D | 0 | 128 | 0 |
| Mode M0 | |||
|---|---|---|---|
| Quadrant | BADHDUFLAG | Total packets | Discarded packets |
| A | 0 | 39733 | 0 |
| B | 0 | 29559 | 0 |
| C | 0 | 27368 | 0 |
| D | 0 | 26322 | 0 |
| Quadrant | Total seconds | Saturated seconds | Saturation percentage |
|---|---|---|---|
| A | 6362 | 1986 | 31.216599% |
| B | 6361 | 65 | 1.021852% |
| C | 6358 | 39 | 0.613400% |
| D | 6362 | 37 | 0.581578% |
Noise dominated data is calculated using 1-second bins in cleaned event files. If a bin has >2000 counts, and if more than 50% of those come from <1% of pixels, then it is considered to be noise-dominated and hence unusable.
| Quadrant | # 1 sec bins | Bins with >0 counts | Bins with >2000 counts | High rate bins dominated by noise | Noise dominated (total time) | Noise dominated (detector-on time) | Marked lightcurve |
|---|---|---|---|---|---|---|---|
| A | 7571 | 6361 | 2409 | 2409 | 31.82% | 37.87% | 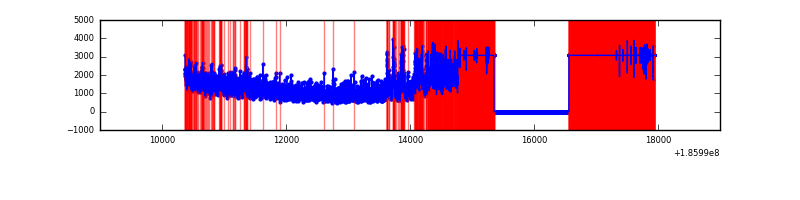 |
| B | 7572 | 6363 | 468 | 468 | 6.18% | 7.36% |  |
| C | 7572 | 6361 | 320 | 320 | 4.23% | 5.03% | 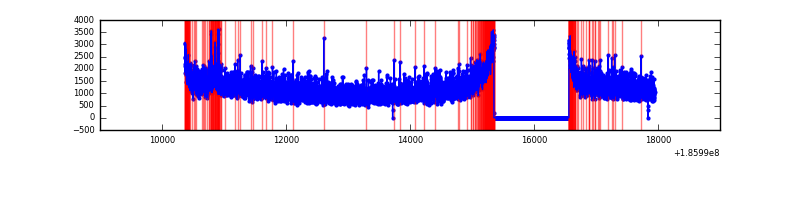 |
| D | 7572 | 6363 | 314 | 314 | 4.15% | 4.93% |  |
Top three noisy pixels from each quadrant. If the there are fewer than three noisy pixels in the level2.evt file, extra rows are filled as -1
| Pixel properties | Quadrant properties | ||||||
|---|---|---|---|---|---|---|---|
| Quadrant | DetID | PixID | Counts | Sigma | Mean | Median | Sigma |
| A | 15 | 127 | 5293256 | 13246.73 | 1658 | 1672 | 399.5 |
| A | 15 | 171 | 48662 | 117.63 | 1658 | 1672 | 399.5 |
| A | 0 | 253 | 32492 | 77.15 | 1658 | 1672 | 399.5 |
| B | 0 | 207 | 147982 | 299.93 | 2096 | 2108 | 486.4 |
| B | 0 | 220 | 96202 | 193.46 | 2096 | 2108 | 486.4 |
| B | 7 | 221 | 68018 | 135.51 | 2096 | 2108 | 486.4 |
| C | 8 | 208 | 47358 | 85.19 | 1928 | 1997 | 532.5 |
| C | 10 | 34 | 42239 | 75.57 | 1928 | 1997 | 532.5 |
| C | 3 | 111 | 24349 | 41.98 | 1928 | 1997 | 532.5 |
| D | 13 | 200 | 131748 | 226.82 | 1854 | 1917 | 572.4 |
| D | 12 | 22 | 60959 | 103.15 | 1854 | 1917 | 572.4 |
| D | 12 | 188 | 57921 | 97.84 | 1854 | 1917 | 572.4 |
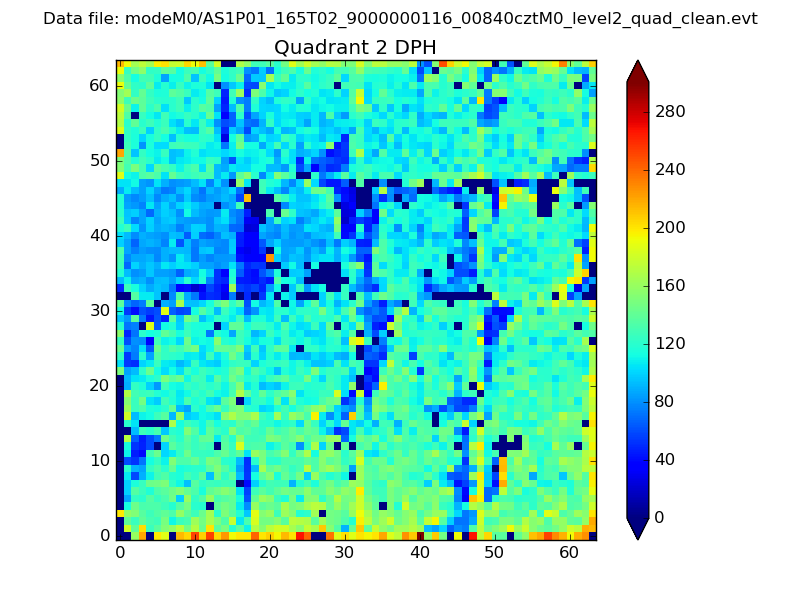
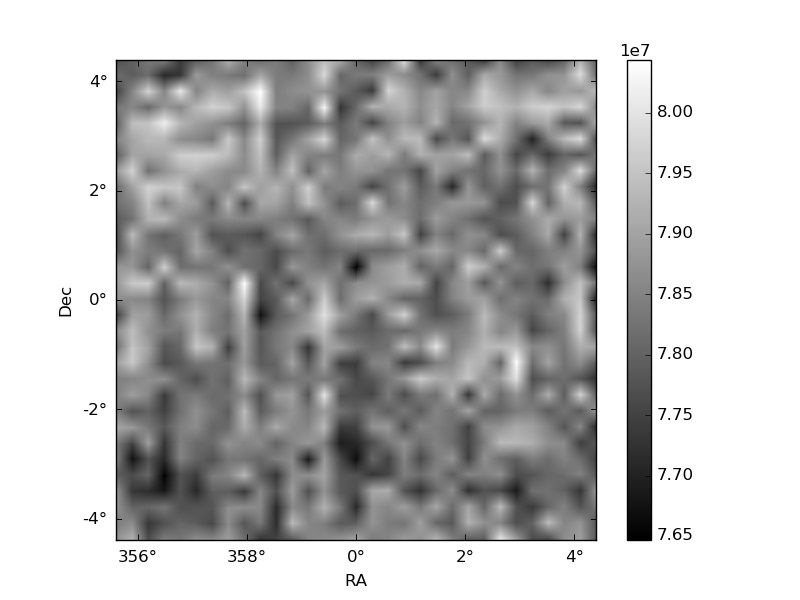
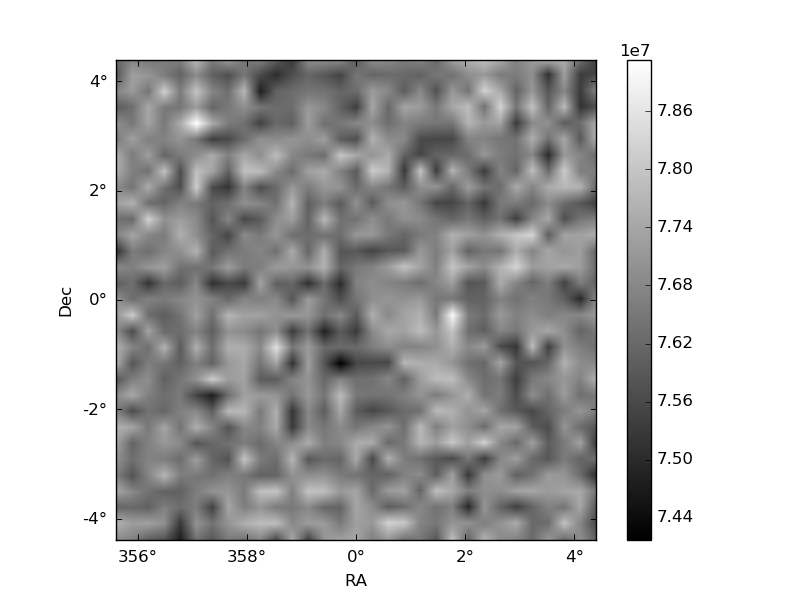
Histogram calculated using DETX and DETY for each event in the final _common_clean file
| Quadrant A | 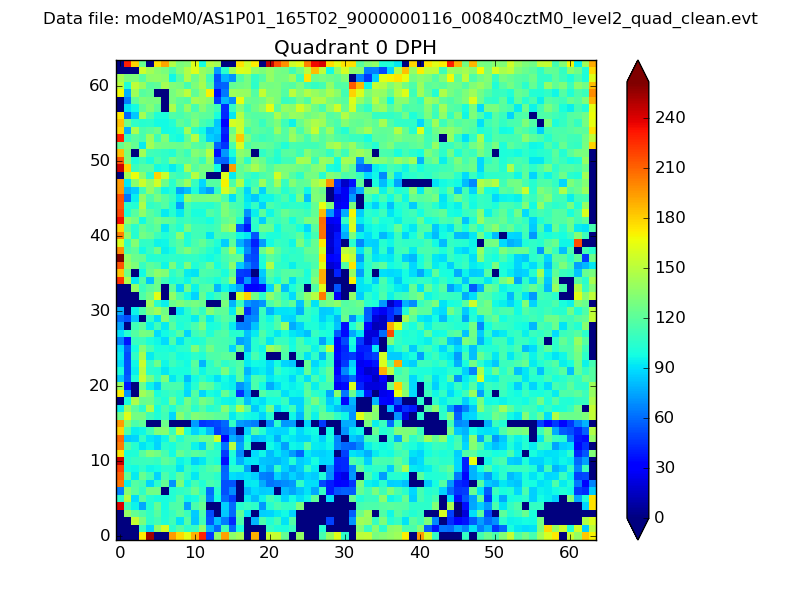 |
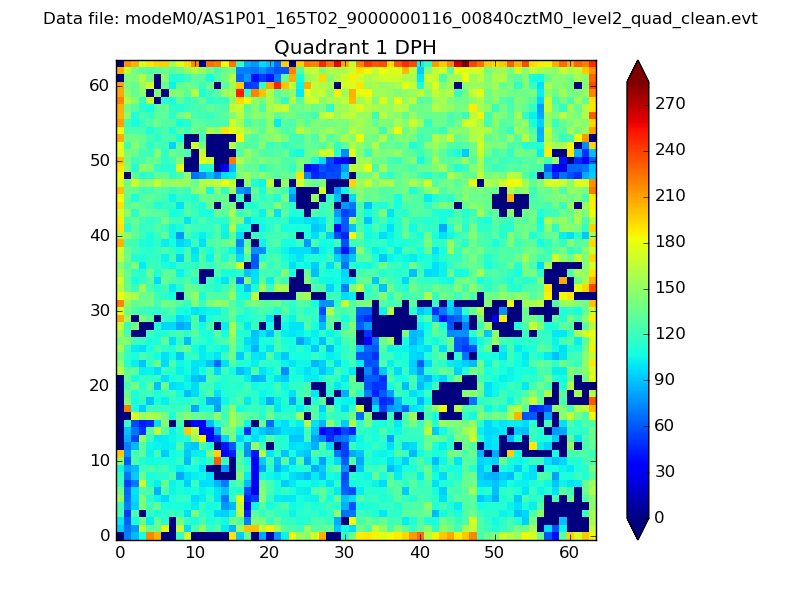 |
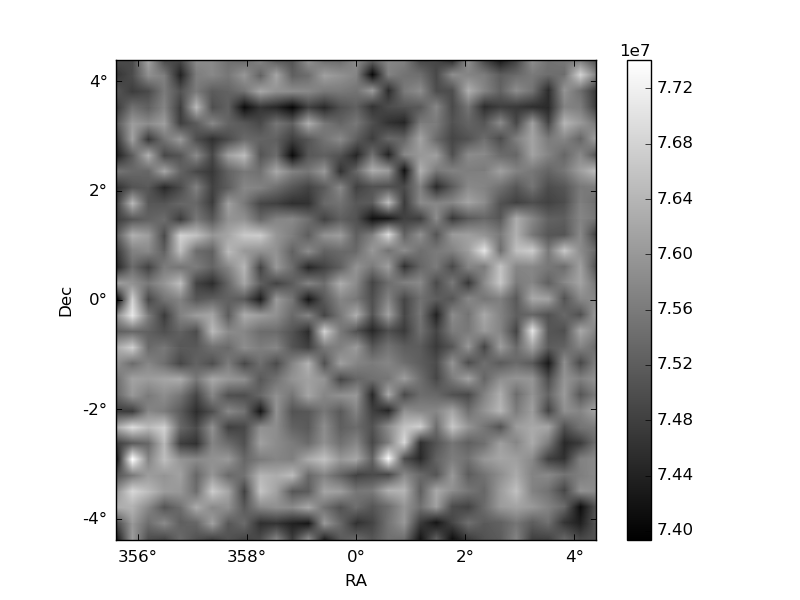
Quadrant B |
|---|---|---|---|
| Quadrant D | 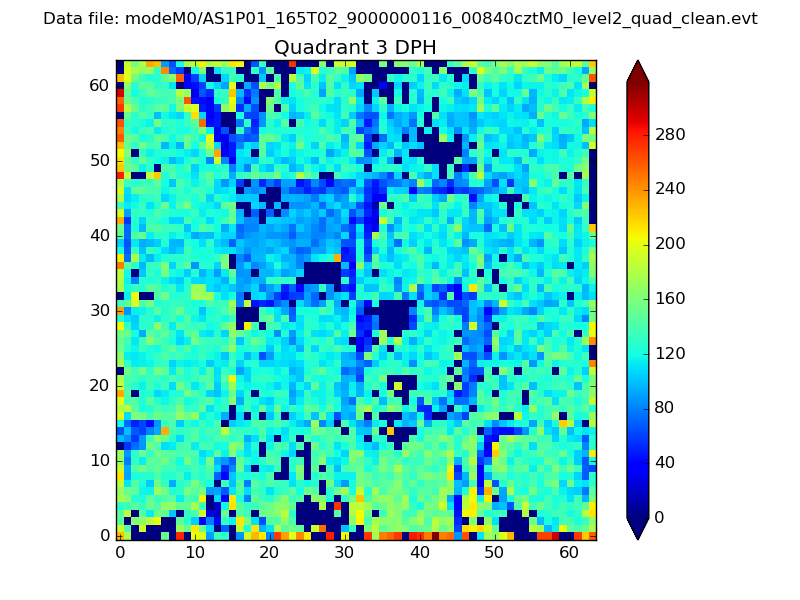 |
 |
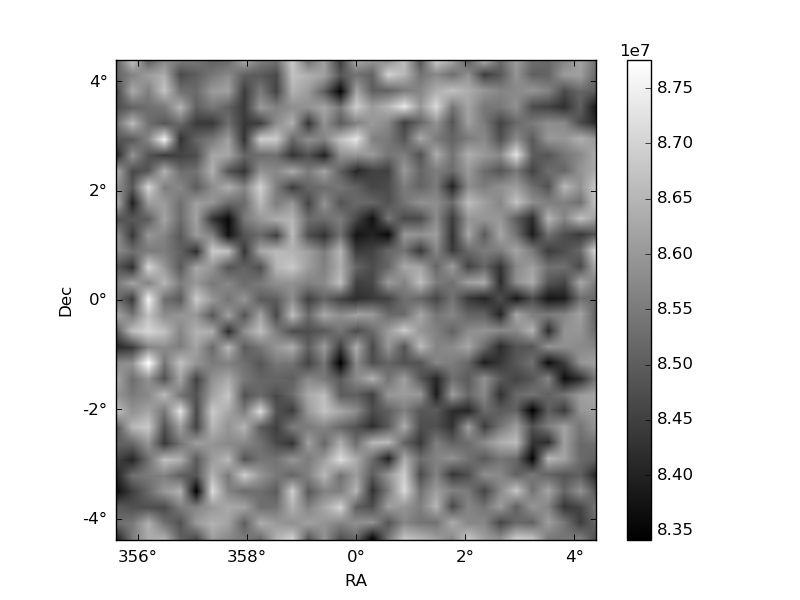
Quadrant C |
| Plot type | Count rate plots | Images |
|---|---|---|
| Comparison with Poisson distribution Blue bars denote a histogram of data divided into 1 sec bins. Red curve is a Poisson curve with rate = median count rate of data. |
 |
 |
| Quadrant-wise count rates Data is divided into 100 sec bins |
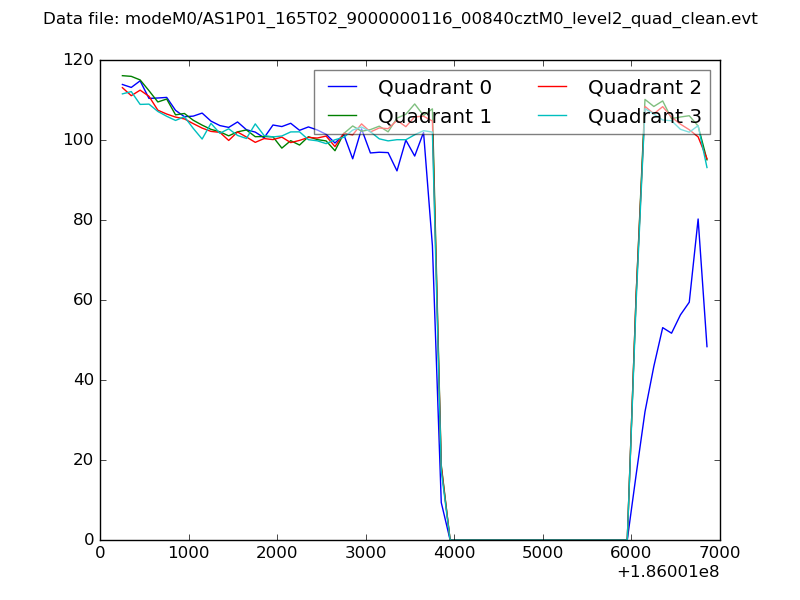 |
|
| Module-wise count rates for Quadrant A Data is divided into 100 sec bins |
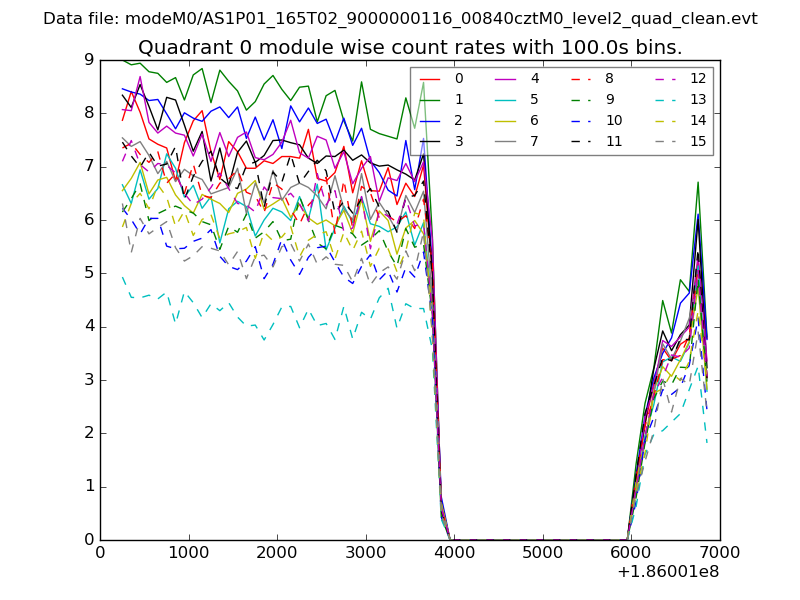 |
 |
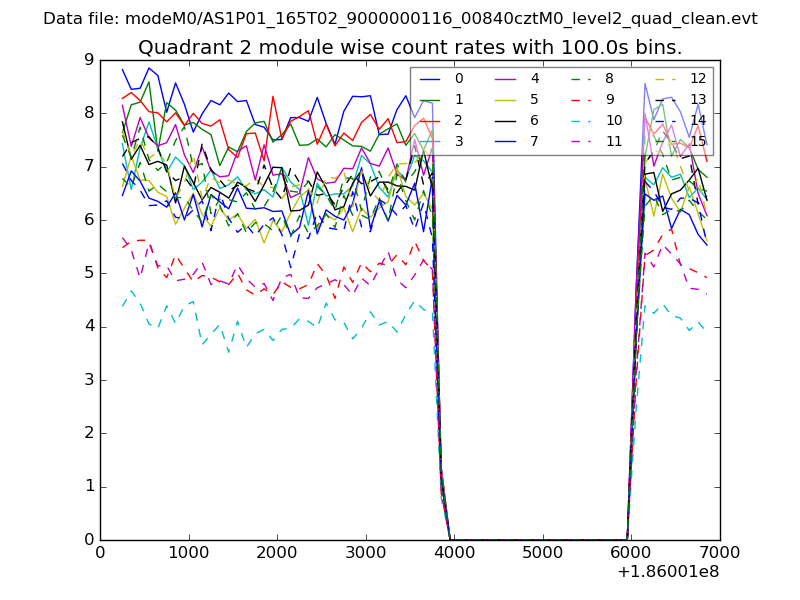
| Module-wise count rates for Quadrant B Data is divided into 100 sec bins |
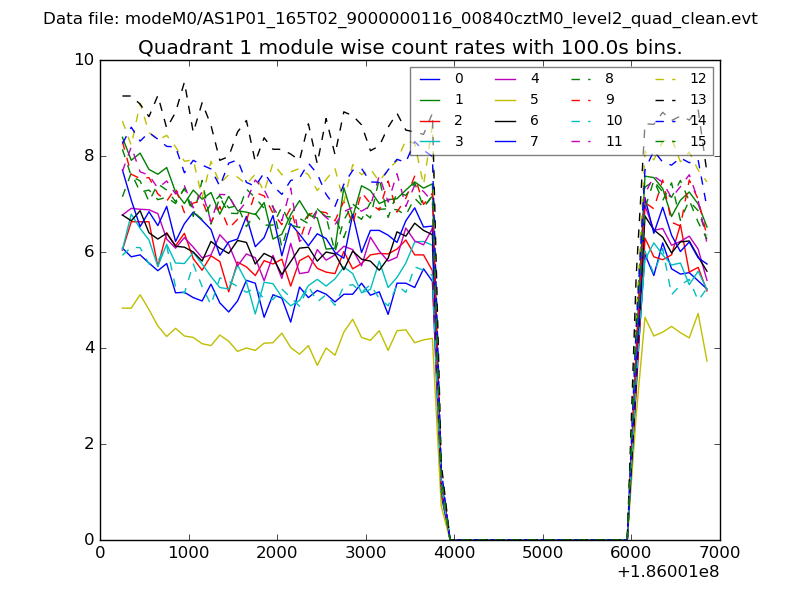 |
 |
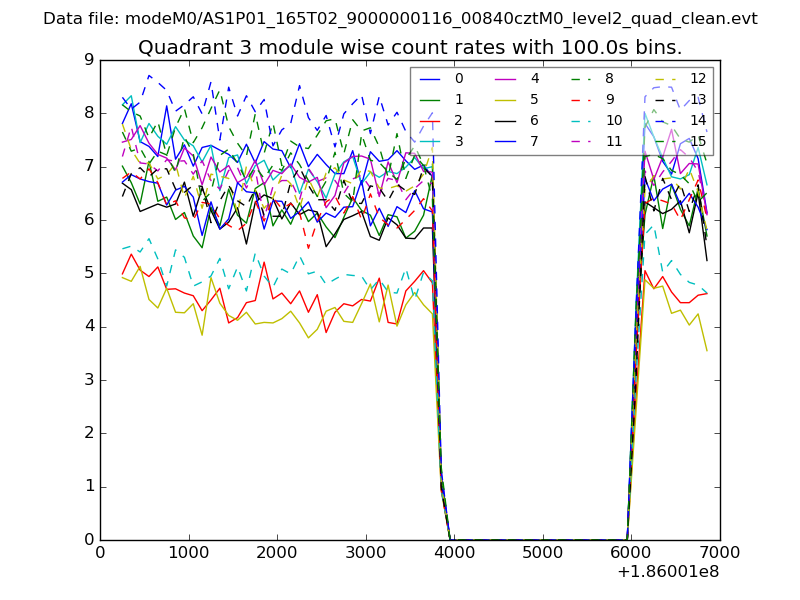
| Module-wise count rates for Quadrant C Data is divided into 100 sec bins |
 |
 |
| Module-wise count rates for Quadrant D Data is divided into 100 sec bins |
 |
 |
| Parameter | Plot |
|---|---|
| CZT HV Monitor | 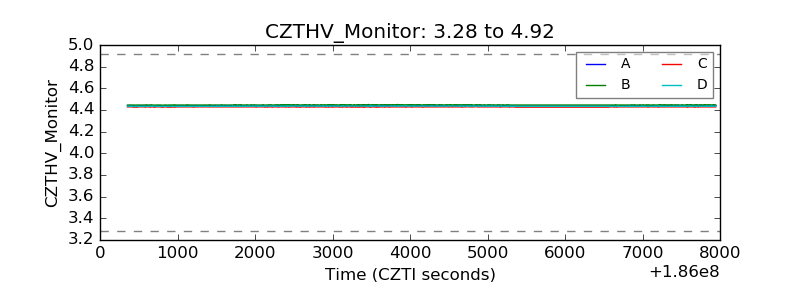 |
| D_VDD | 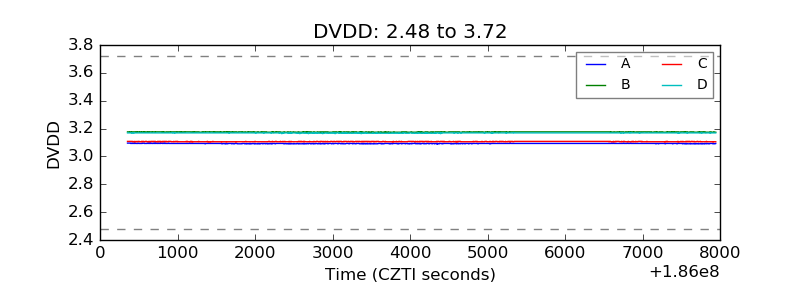 |
| Temperature 1 | 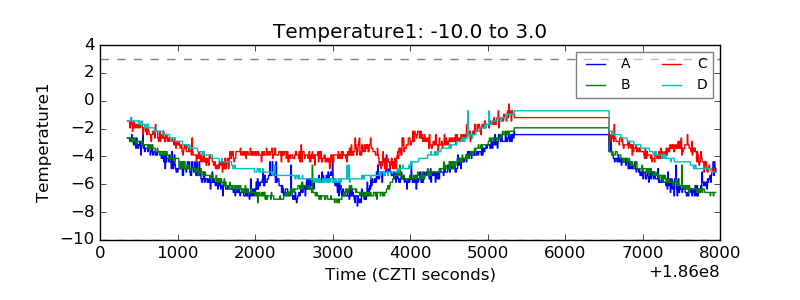 |
| Veto HV Monitor | 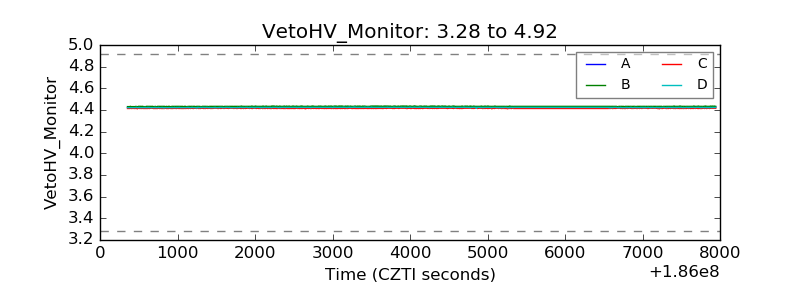 |
| Veto LLD | 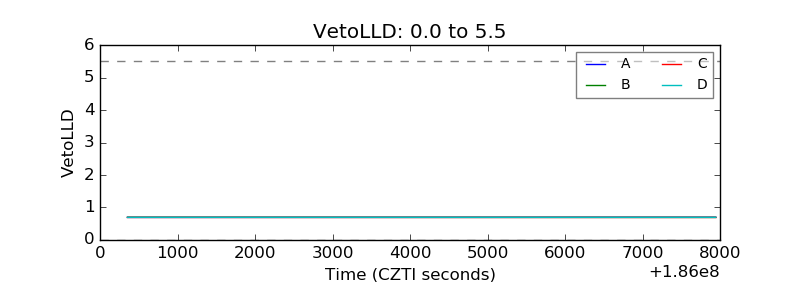 |
| Alpha Counter | 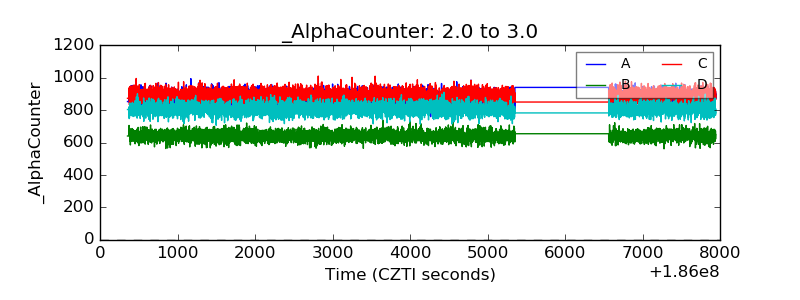 |
| _CPM_Rate | 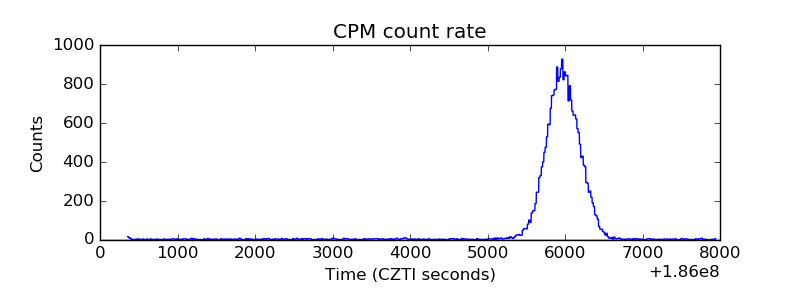 |
| CZT Counter | 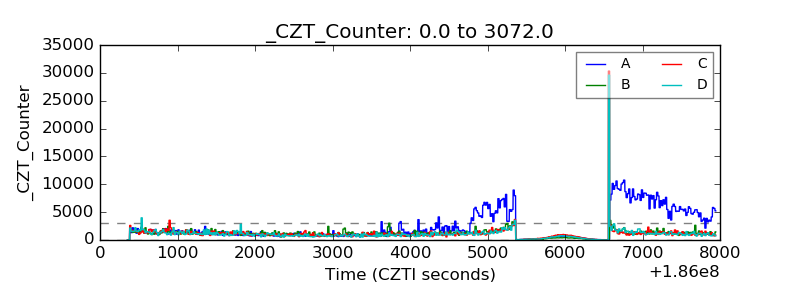 |
| +2.5 Volts monitor |  |
| +5 Volts monitor |  |
| _ROLL_ROT | 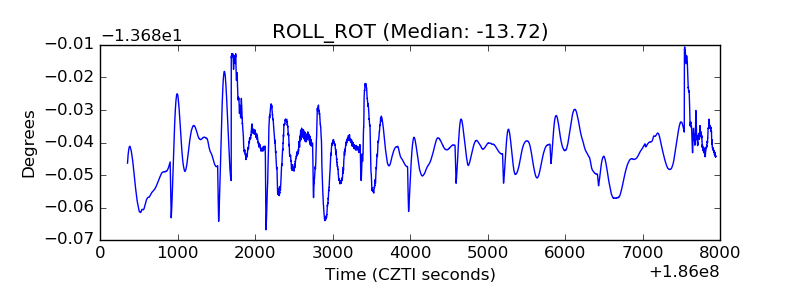 |
| _Roll_DEC | 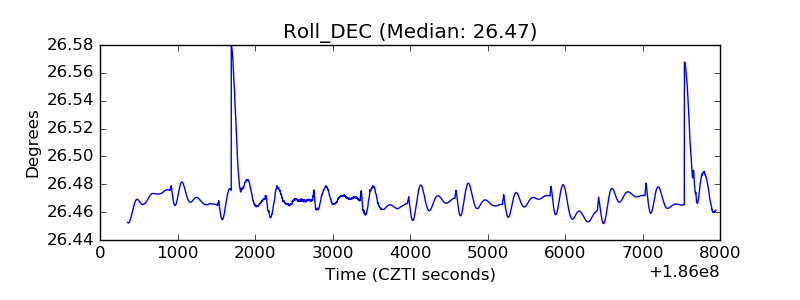 |
| _Roll_RA | 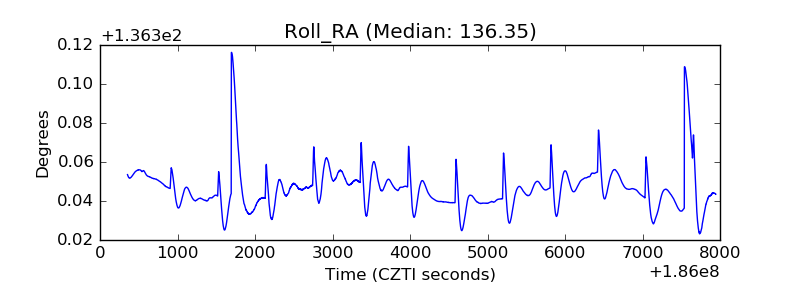 |
| Veto Counter | 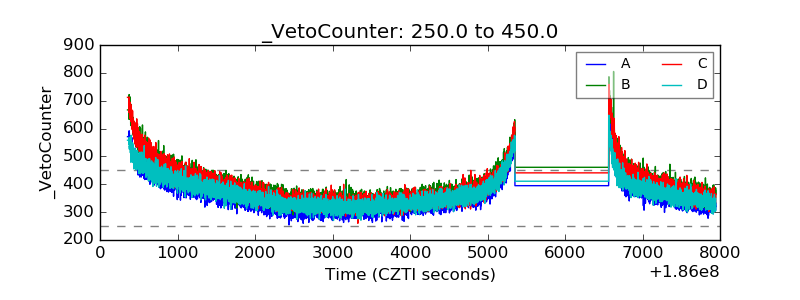 |