| Param | Original file | Final file |
|---|---|---|
| Filename | modeM0/AS1P01_165T02_9000000116_00841cztM0_level2.evt | modeM0/AS1P01_165T02_9000000116_00841cztM0_level2_quad_clean.evt |
| Size (bytes) | 1,382,281,920 | 74,972,160 |
| Size | 1.3 GB | 71.5 MB |
| Events in quadrant A | 18,230,238 | 369,779 |
| Events in quadrant B | 8,488,486 | 485,930 |
| Events in quadrant C | 7,584,039 | 481,017 |
| Events in quadrant D | 7,128,967 | 476,810 |
| Mode M9 | |||
|---|---|---|---|
| Quadrant | BADHDUFLAG | Total packets | Discarded packets |
| A | 0 | 14 | 0 |
| B | 0 | 14 | 0 |
| C | 0 | 14 | 0 |
| D | 0 | 14 | 0 |
| Mode SS | |||
|---|---|---|---|
| Quadrant | BADHDUFLAG | Total packets | Discarded packets |
| A | 0 | 134 | 0 |
| B | 0 | 134 | 0 |
| C | 0 | 134 | 0 |
| D | 0 | 134 | 0 |
| Mode M0 | |||
|---|---|---|---|
| Quadrant | BADHDUFLAG | Total packets | Discarded packets |
| A | 0 | 59378 | 0 |
| B | 0 | 29837 | 0 |
| C | 0 | 27191 | 0 |
| D | 0 | 25845 | 0 |
| Quadrant | Total seconds | Saturated seconds | Saturation percentage |
|---|---|---|---|
| A | 6524 | 3967 | 60.806254% |
| B | 6524 | 14 | 0.214592% |
| C | 6524 | 17 | 0.260576% |
| D | 6524 | 30 | 0.459841% |
Noise dominated data is calculated using 1-second bins in cleaned event files. If a bin has >2000 counts, and if more than 50% of those come from <1% of pixels, then it is considered to be noise-dominated and hence unusable.
| Quadrant | # 1 sec bins | Bins with >0 counts | Bins with >2000 counts | High rate bins dominated by noise | Noise dominated (total time) | Noise dominated (detector-on time) | Marked lightcurve |
|---|---|---|---|---|---|---|---|
| A | 7589 | 6524 | 5948 | 5948 | 78.38% | 91.17% | 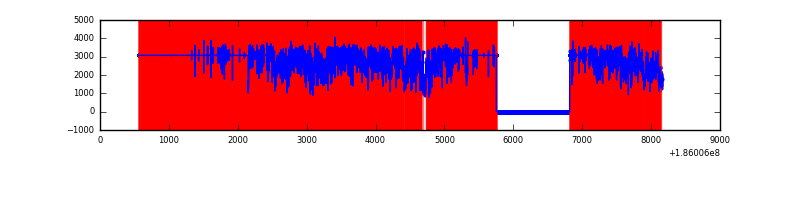 |
| B | 7589 | 6525 | 397 | 397 | 5.23% | 6.08% | 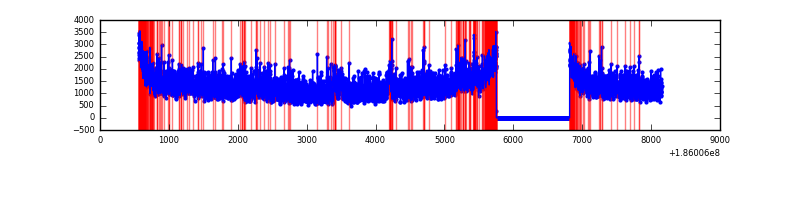 |
| C | 7589 | 6525 | 229 | 229 | 3.02% | 3.51% |  |
| D | 7589 | 6525 | 225 | 225 | 2.96% | 3.45% | 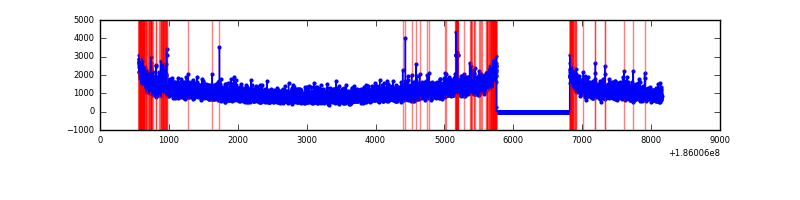 |
Top three noisy pixels from each quadrant. If the there are fewer than three noisy pixels in the level2.evt file, extra rows are filled as -1
| Pixel properties | Quadrant properties | ||||||
|---|---|---|---|---|---|---|---|
| Quadrant | DetID | PixID | Counts | Sigma | Mean | Median | Sigma |
| A | 15 | 127 | 12166961 | 32770.0 | 1548 | 1561 | 371.2 |
| A | 15 | 171 | 99805 | 264.64 | 1548 | 1561 | 371.2 |
| A | 15 | 233 | 11118 | 25.74 | 1548 | 1561 | 371.2 |
| B | 8 | 38 | 142169 | 283.97 | 2108 | 2118 | 493.2 |
| B | 0 | 220 | 117838 | 234.64 | 2108 | 2118 | 493.2 |
| B | 0 | 207 | 71082 | 139.83 | 2108 | 2118 | 493.2 |
| C | 3 | 111 | 23872 | 41.15 | 1918 | 1986 | 531.9 |
| C | 15 | 241 | 18146 | 30.38 | 1918 | 1986 | 531.9 |
| C | 9 | 83 | 17593 | 29.34 | 1918 | 1986 | 531.9 |
| D | 10 | 85 | 72699 | 124.58 | 1838 | 1899 | 568.3 |
| D | 12 | 22 | 62296 | 106.28 | 1838 | 1899 | 568.3 |
| D | 1 | 4 | 41774 | 70.17 | 1838 | 1899 | 568.3 |
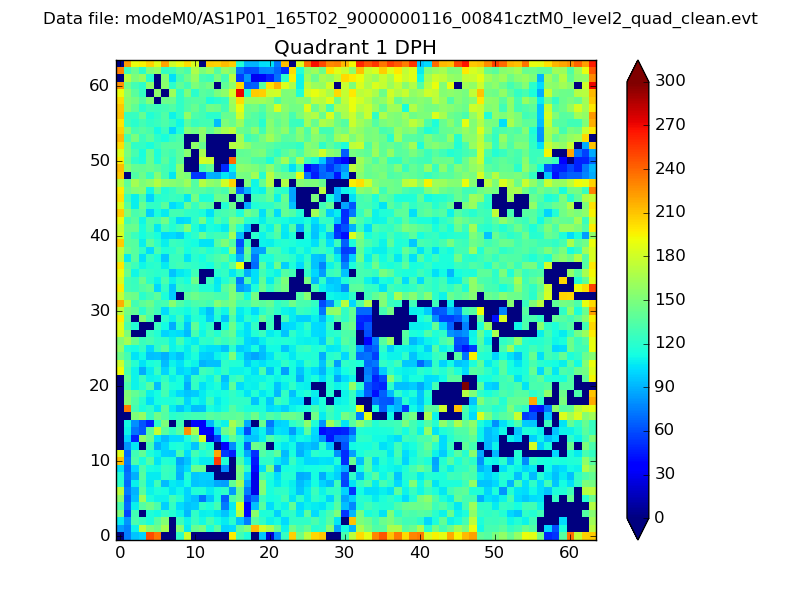
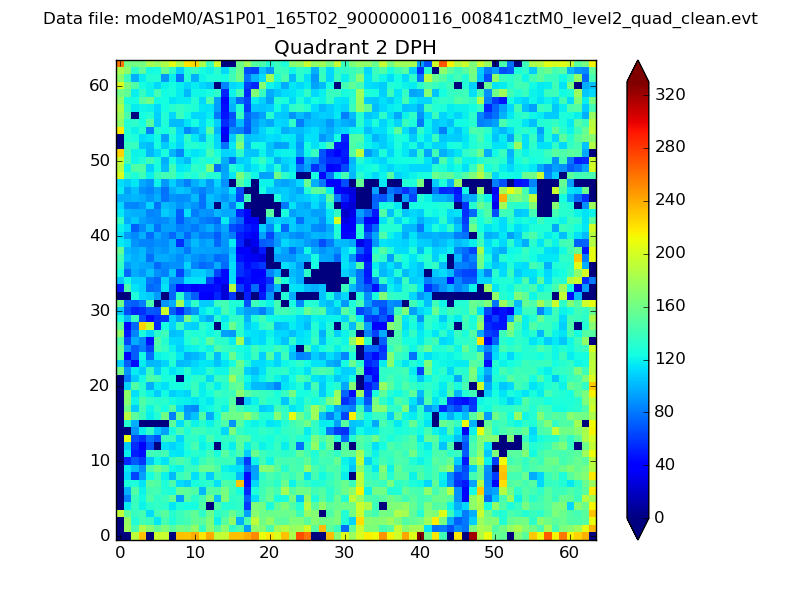
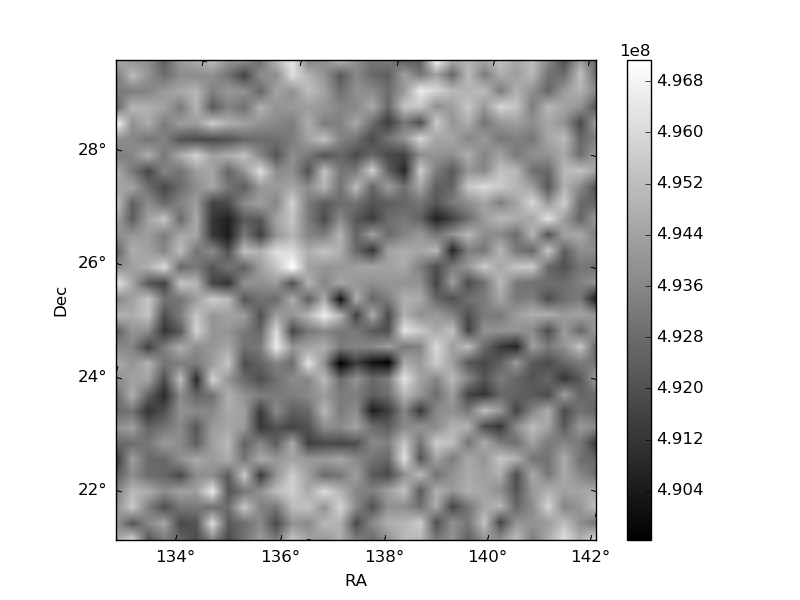
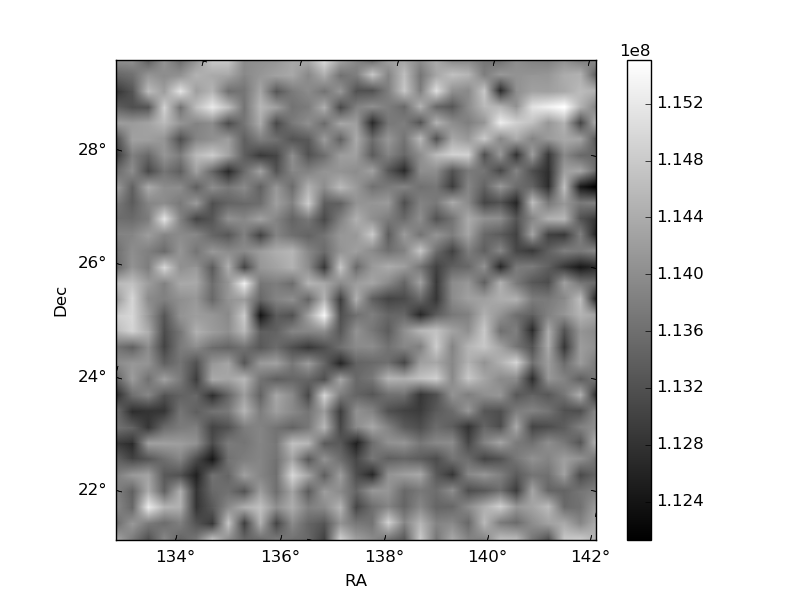
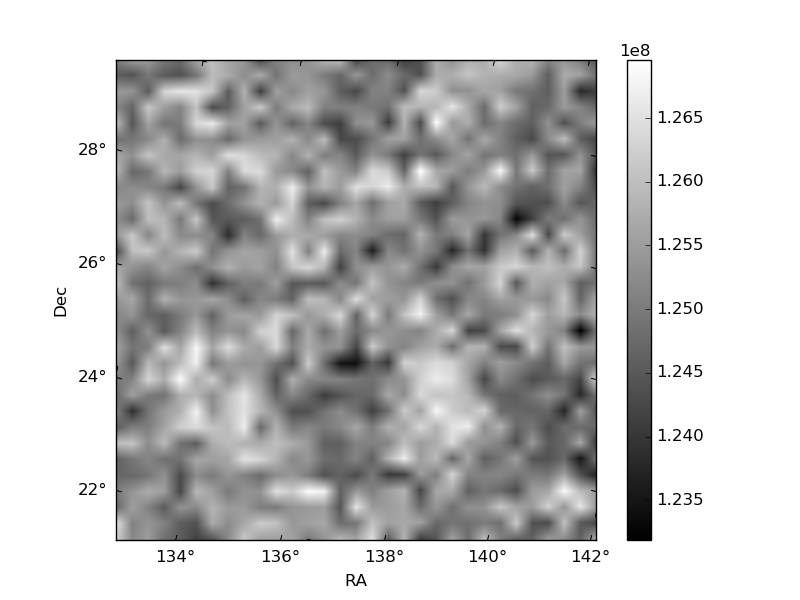
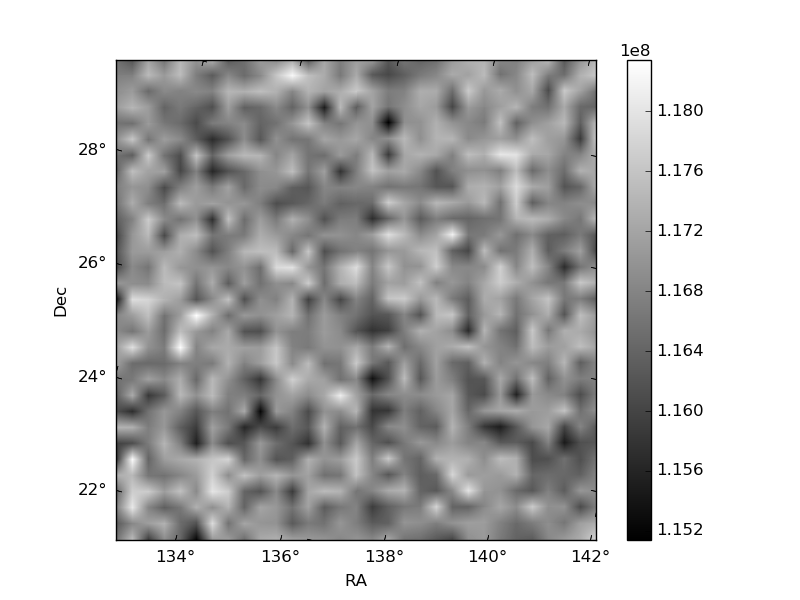
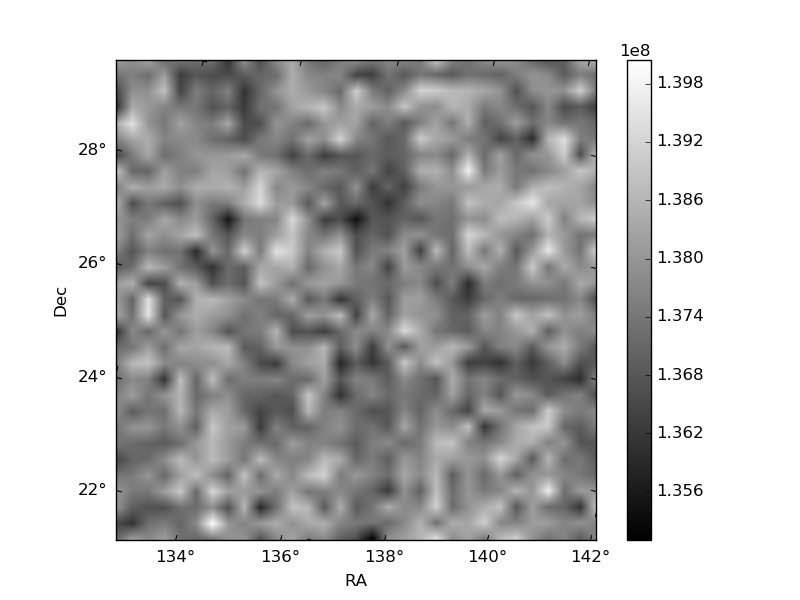
Histogram calculated using DETX and DETY for each event in the final _common_clean file
| Quadrant A | 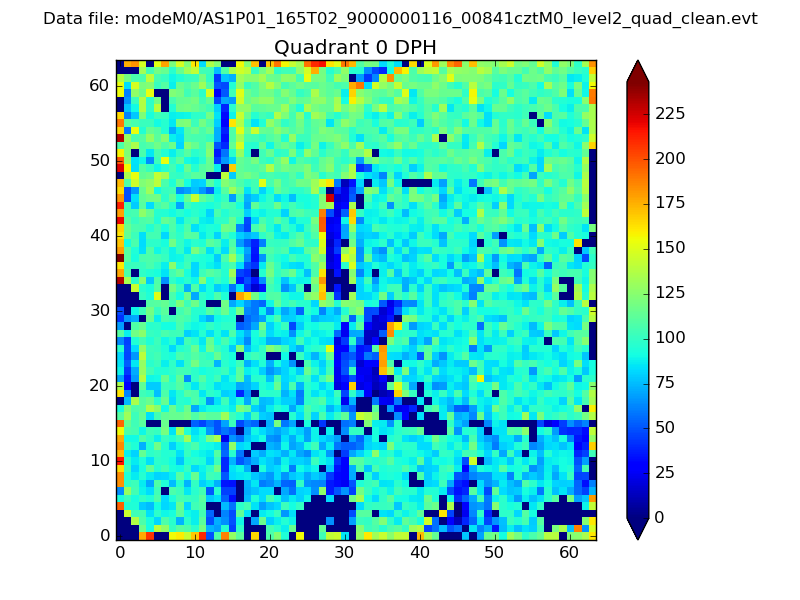 |
 |
Quadrant B |
|---|---|---|---|
| Quadrant D | 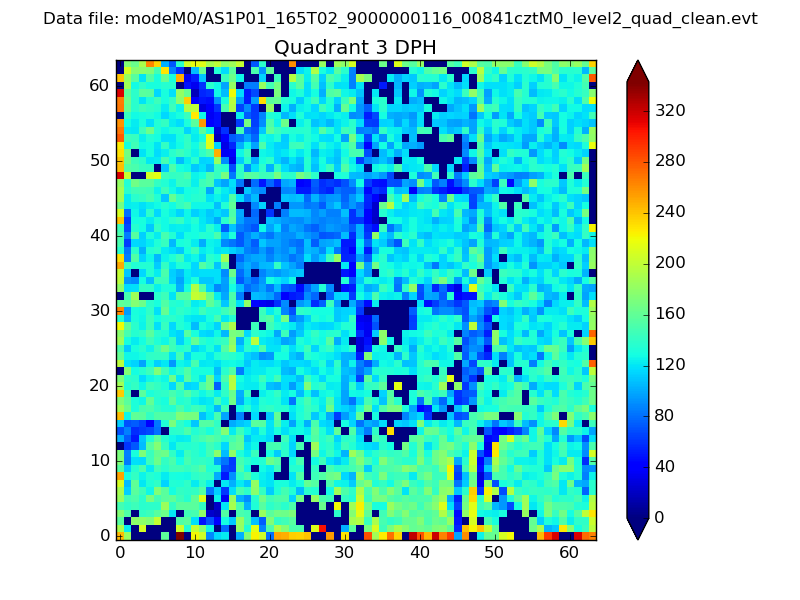 |
 |
Quadrant C |
| Plot type | Count rate plots | Images |
|---|---|---|
| Comparison with Poisson distribution Blue bars denote a histogram of data divided into 1 sec bins. Red curve is a Poisson curve with rate = median count rate of data. |
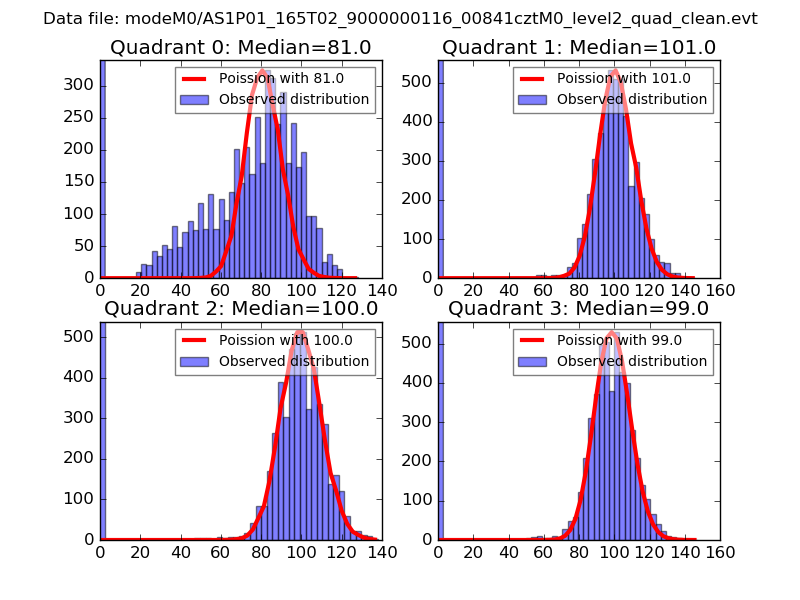 |
 |
| Quadrant-wise count rates Data is divided into 100 sec bins |
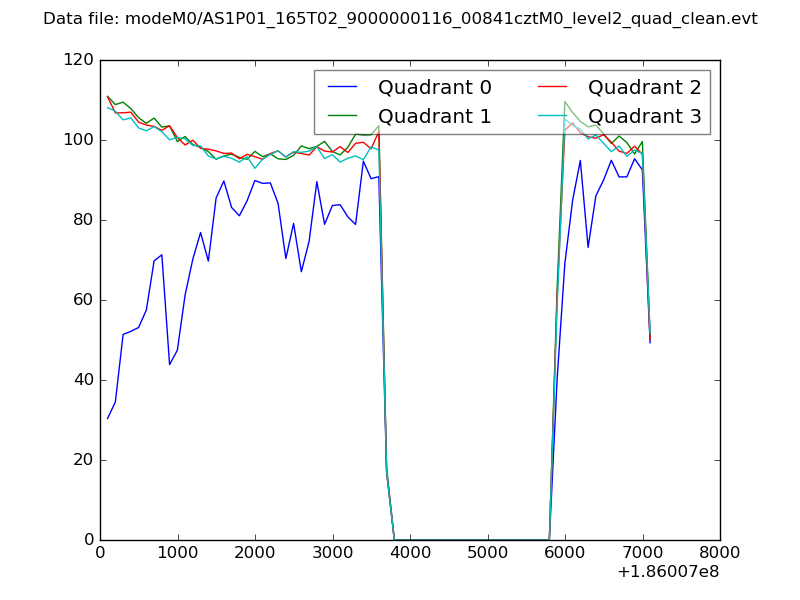 |
|
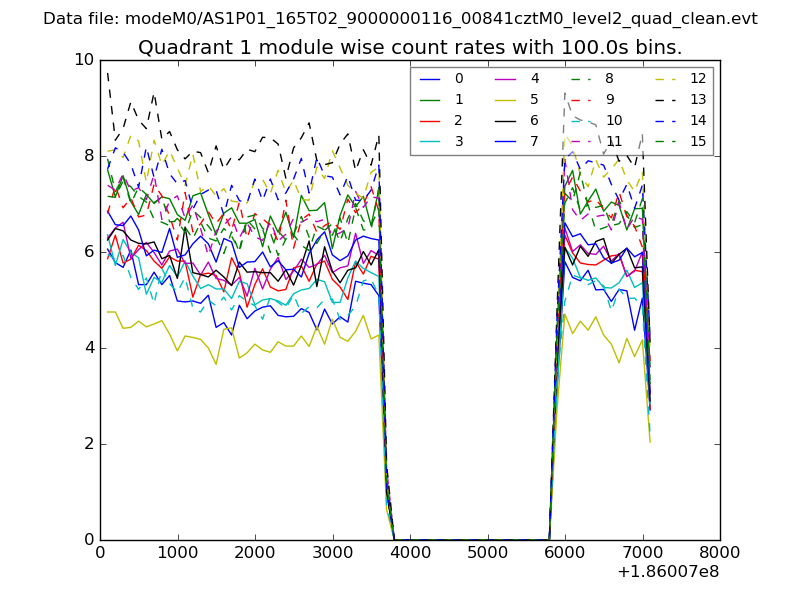
| Module-wise count rates for Quadrant A Data is divided into 100 sec bins |
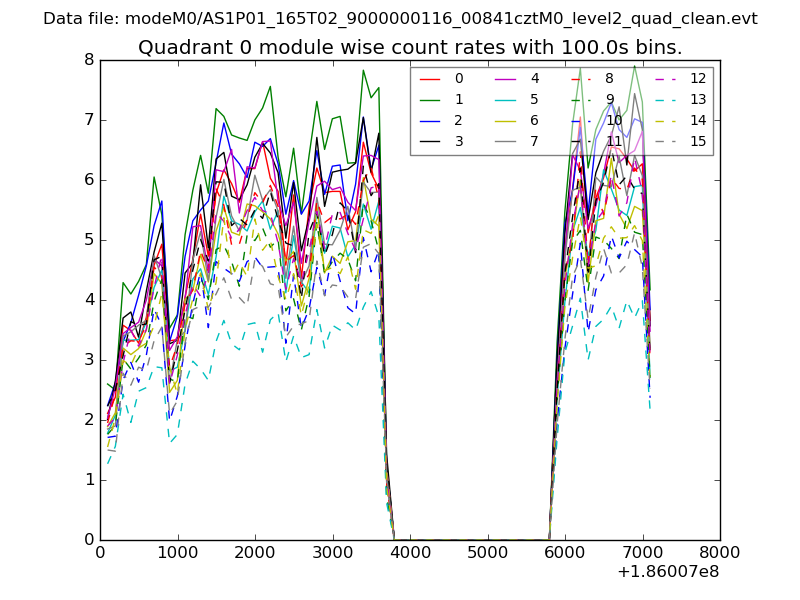 |
 |
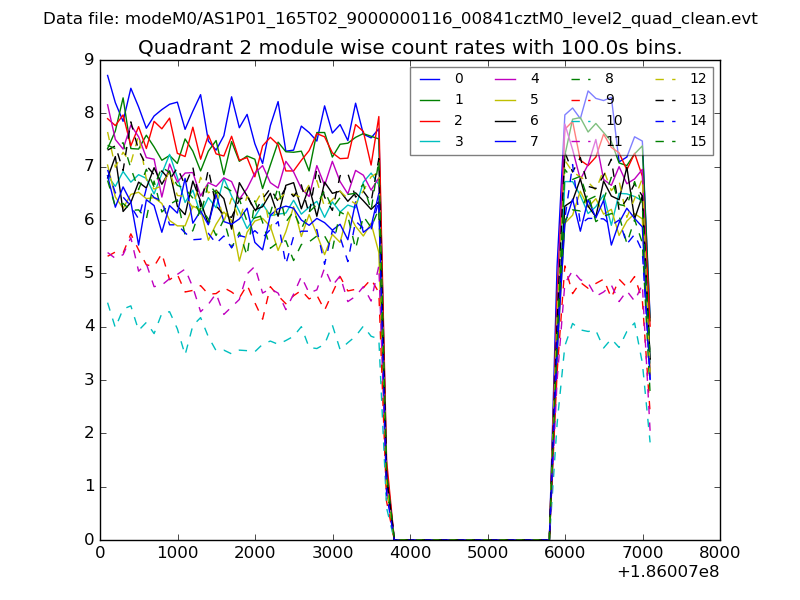
| Module-wise count rates for Quadrant B Data is divided into 100 sec bins |
 |
 |
| Module-wise count rates for Quadrant C Data is divided into 100 sec bins |
 |
 |
| Module-wise count rates for Quadrant D Data is divided into 100 sec bins |
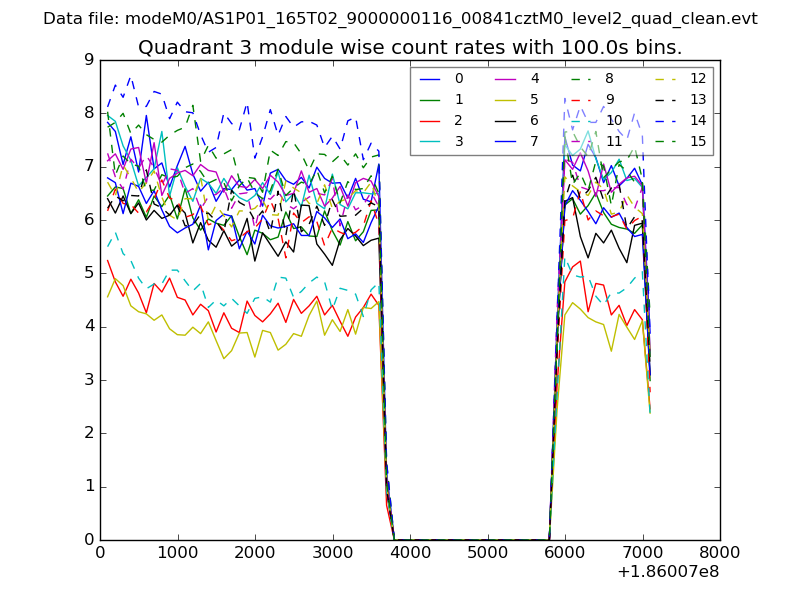 |
 |
| Parameter | Plot |
|---|---|
| CZT HV Monitor | 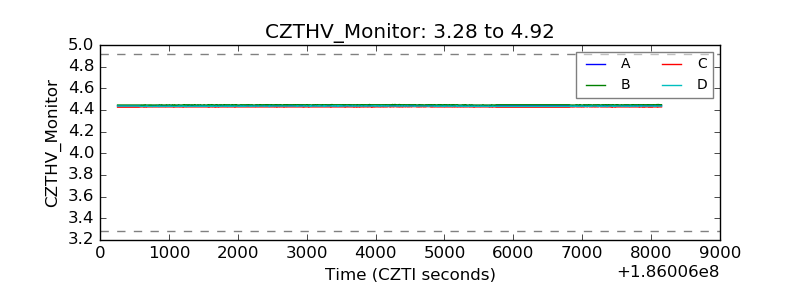 |
| D_VDD | 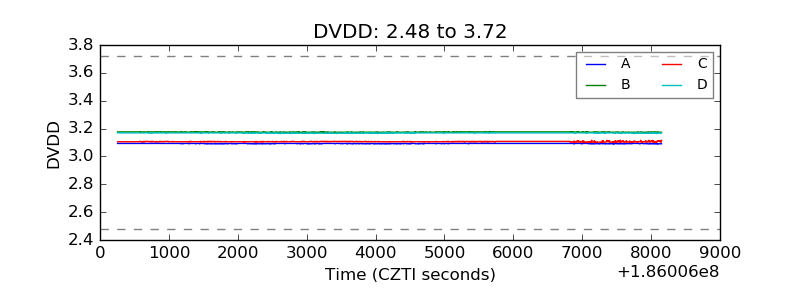 |
| Temperature 1 | 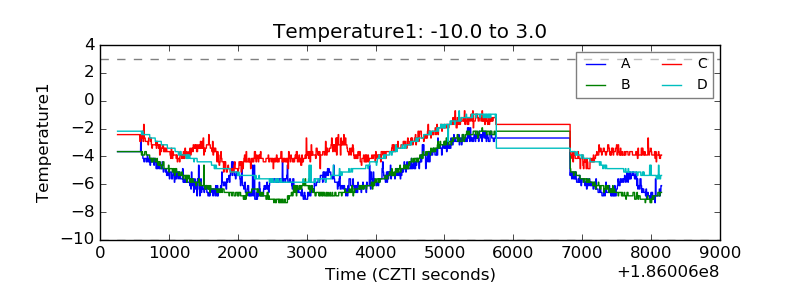 |
| Veto HV Monitor | 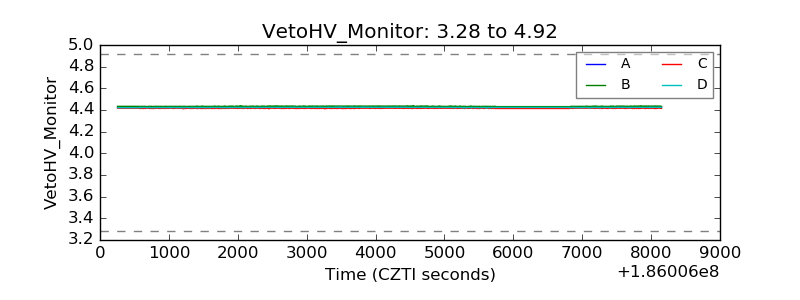 |
| Veto LLD | 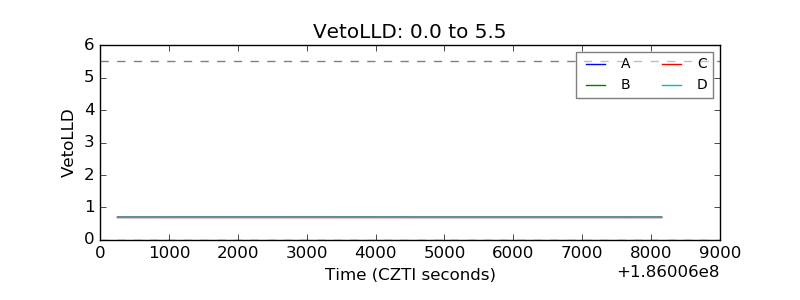 |
| Alpha Counter | 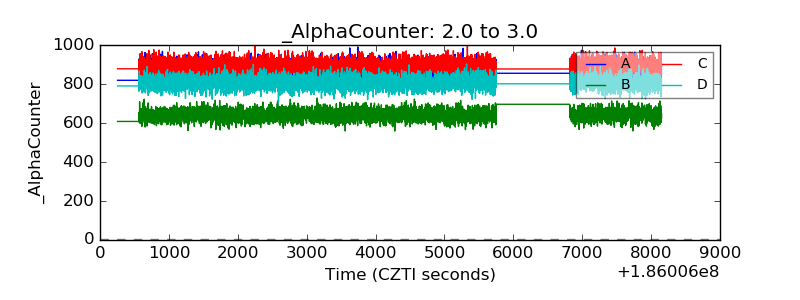 |
| _CPM_Rate | 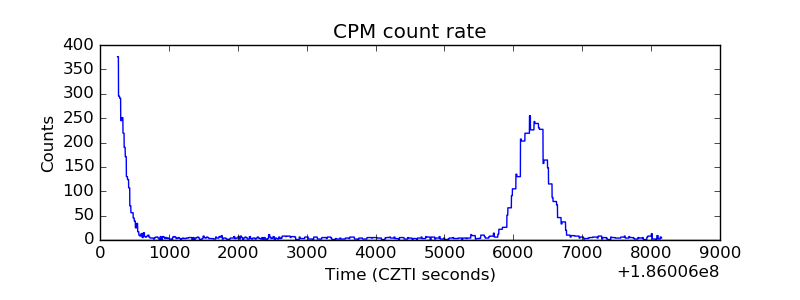 |
| CZT Counter | 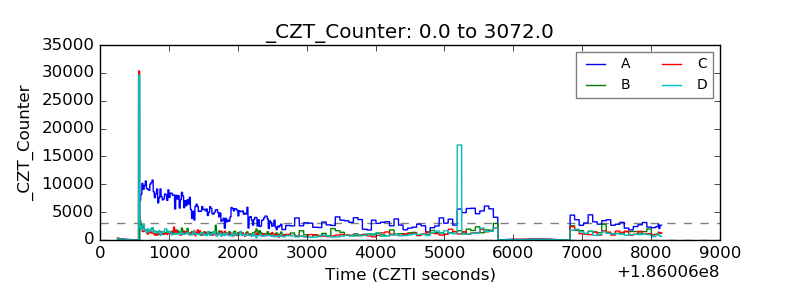 |
| +2.5 Volts monitor |  |
| +5 Volts monitor |  |
| _ROLL_ROT | 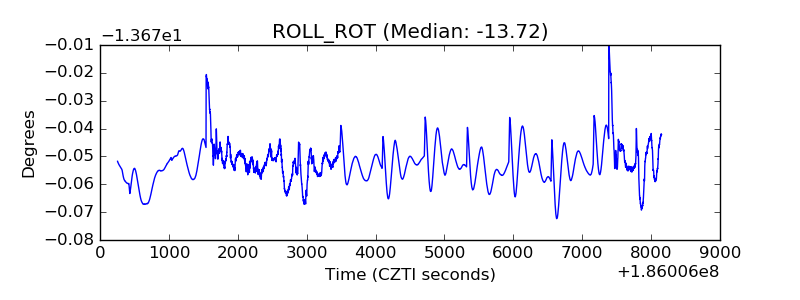 |
| _Roll_DEC |  |
| _Roll_RA | 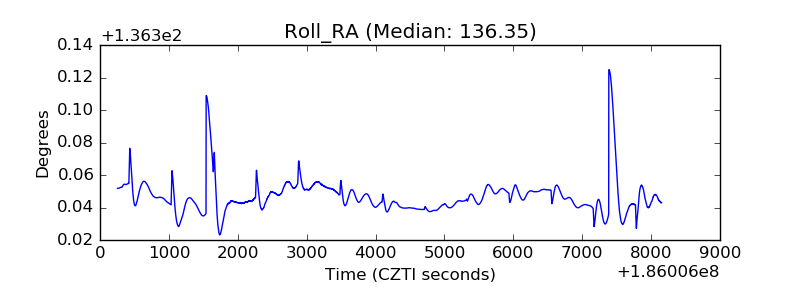 |
| Veto Counter | 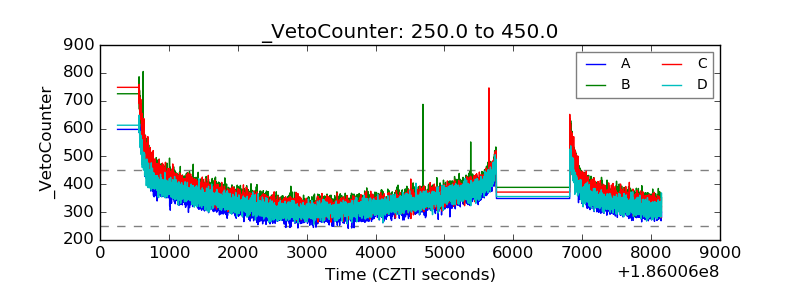 |