| Param | Original file | Final file |
|---|---|---|
| Filename | modeM0/AS1P01_165T02_9000000116_00842cztM0_level2.evt | modeM0/AS1P01_165T02_9000000116_00842cztM0_level2_quad_clean.evt |
| Size (bytes) | 1,229,696,640 | 81,973,440 |
| Size | 1.1 GB | 78.2 MB |
| Events in quadrant A | 11,654,989 | 485,112 |
| Events in quadrant B | 9,093,804 | 506,710 |
| Events in quadrant C | 8,374,288 | 500,954 |
| Events in quadrant D | 7,650,301 | 495,919 |
| Mode M9 | |||
|---|---|---|---|
| Quadrant | BADHDUFLAG | Total packets | Discarded packets |
| A | 0 | 8 | 0 |
| B | 0 | 8 | 0 |
| C | 0 | 8 | 0 |
| D | 0 | 8 | 0 |
| Mode SS | |||
|---|---|---|---|
| Quadrant | BADHDUFLAG | Total packets | Discarded packets |
| A | 0 | 144 | 0 |
| B | 0 | 144 | 0 |
| C | 0 | 144 | 0 |
| D | 0 | 144 | 0 |
| Mode M0 | |||
|---|---|---|---|
| Quadrant | BADHDUFLAG | Total packets | Discarded packets |
| A | 0 | 39698 | 0 |
| B | 0 | 32047 | 0 |
| C | 0 | 29917 | 0 |
| D | 0 | 27847 | 0 |
| Quadrant | Total seconds | Saturated seconds | Saturation percentage |
|---|---|---|---|
| A | 7081 | 617 | 8.713459% |
| B | 7081 | 47 | 0.663748% |
| C | 7081 | 45 | 0.635503% |
| D | 7081 | 51 | 0.720237% |
Noise dominated data is calculated using 1-second bins in cleaned event files. If a bin has >2000 counts, and if more than 50% of those come from <1% of pixels, then it is considered to be noise-dominated and hence unusable.
| Quadrant | # 1 sec bins | Bins with >0 counts | Bins with >2000 counts | High rate bins dominated by noise | Noise dominated (total time) | Noise dominated (detector-on time) | Marked lightcurve |
|---|---|---|---|---|---|---|---|
| A | 7706 | 7083 | 2094 | 2094 | 27.17% | 29.56% | 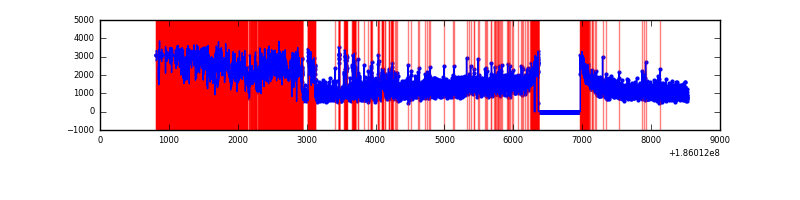 |
| B | 7706 | 7083 | 525 | 525 | 6.81% | 7.41% | 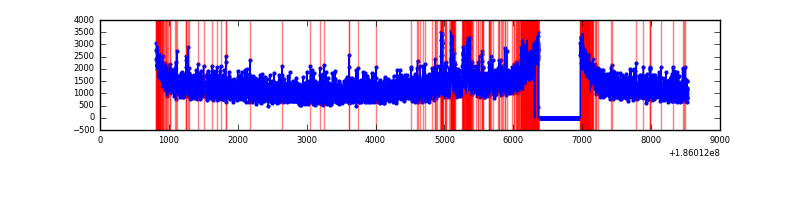 |
| C | 7706 | 7083 | 297 | 297 | 3.85% | 4.19% | 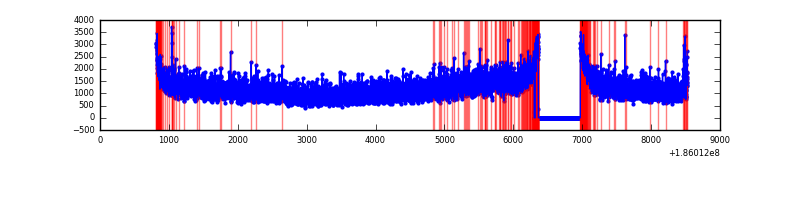 |
| D | 7706 | 7083 | 237 | 237 | 3.08% | 3.35% | 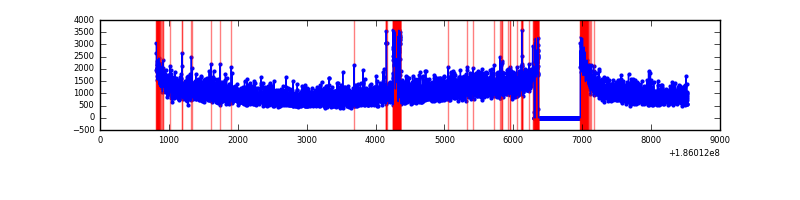 |
Top three noisy pixels from each quadrant. If the there are fewer than three noisy pixels in the level2.evt file, extra rows are filled as -1
| Pixel properties | Quadrant properties | ||||||
|---|---|---|---|---|---|---|---|
| Quadrant | DetID | PixID | Counts | Sigma | Mean | Median | Sigma |
| A | 15 | 127 | 3410618 | 6682.59 | 2118 | 2137 | 510.1 |
| A | 15 | 171 | 93569 | 179.26 | 2118 | 2137 | 510.1 |
| A | 15 | 233 | 30119 | 54.86 | 2118 | 2137 | 510.1 |
| B | 8 | 38 | 170172 | 312.64 | 2282 | 2291 | 537.0 |
| B | 5 | 249 | 60340 | 108.1 | 2282 | 2291 | 537.0 |
| B | 0 | 184 | 45100 | 79.72 | 2282 | 2291 | 537.0 |
| C | 8 | 208 | 138608 | 236.25 | 2071 | 2147 | 577.6 |
| C | 3 | 111 | 32096 | 51.85 | 2071 | 2147 | 577.6 |
| C | 10 | 34 | 22433 | 35.12 | 2071 | 2147 | 577.6 |
| D | 2 | 16 | 175212 | 283.16 | 1974 | 2045 | 611.5 |
| D | 1 | 4 | 39008 | 60.44 | 1974 | 2045 | 611.5 |
| D | 13 | 200 | 23611 | 35.26 | 1974 | 2045 | 611.5 |
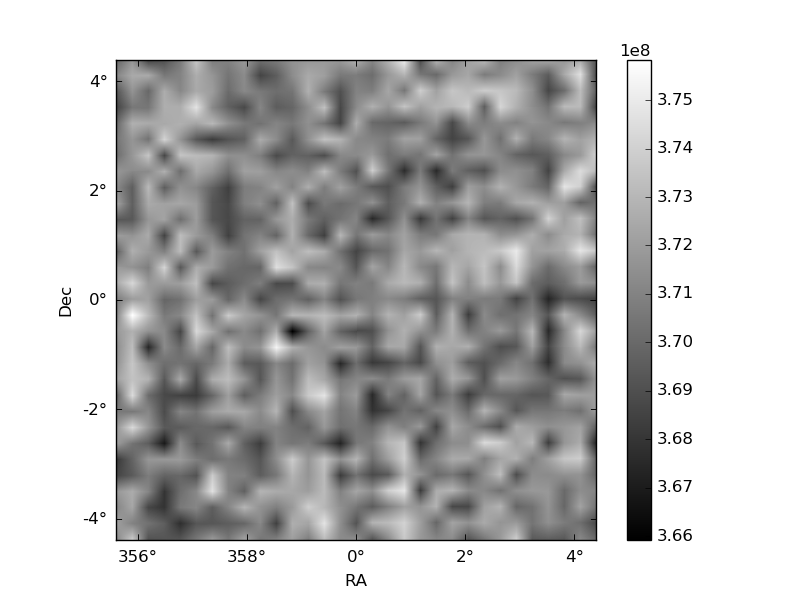
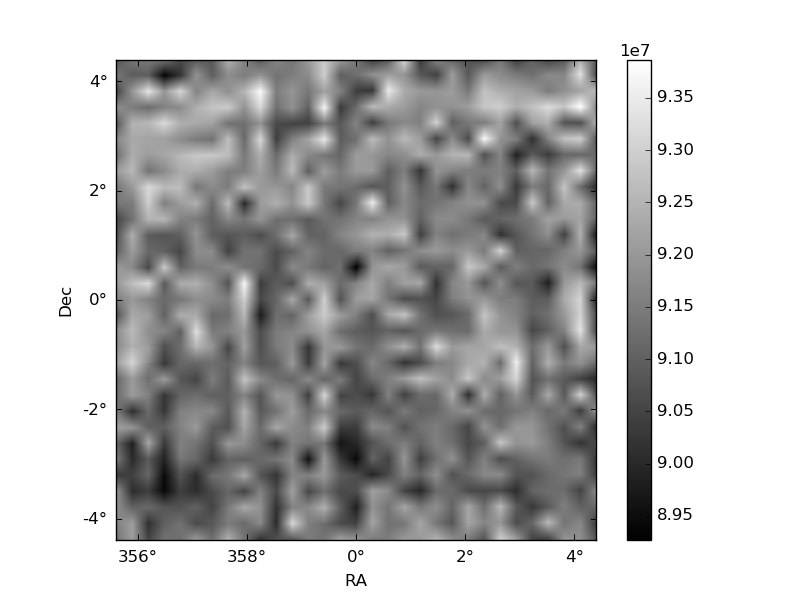
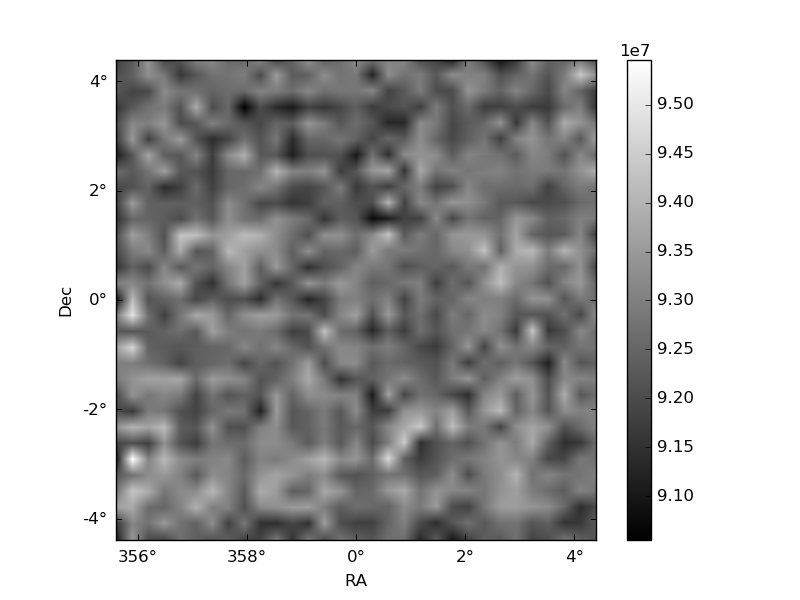
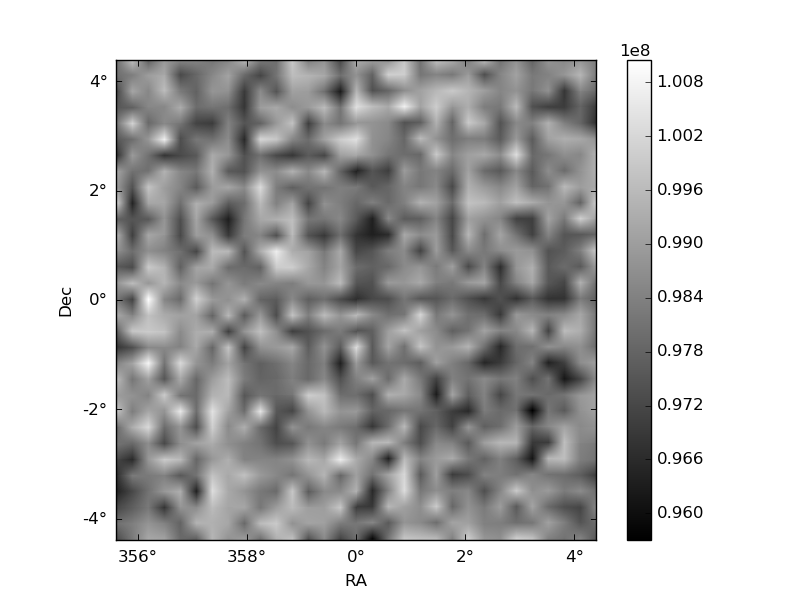
Histogram calculated using DETX and DETY for each event in the final _common_clean file
| Quadrant A | 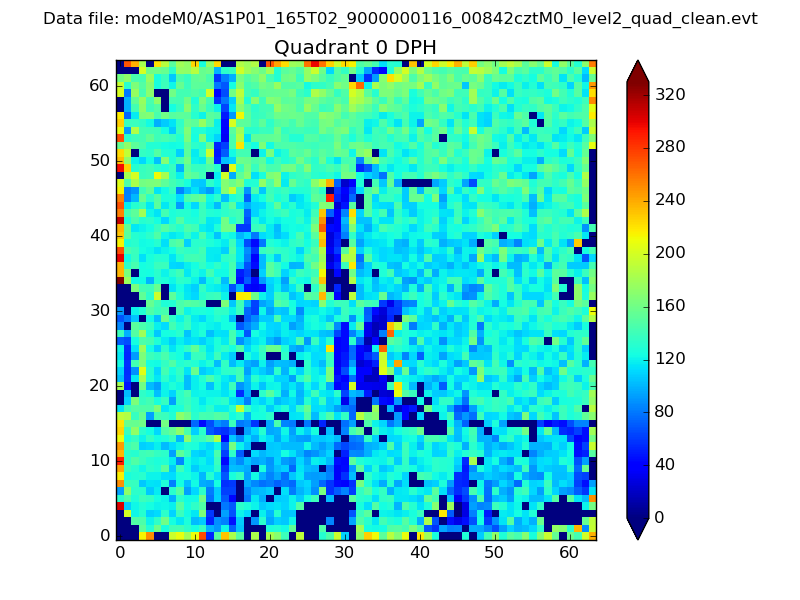 |
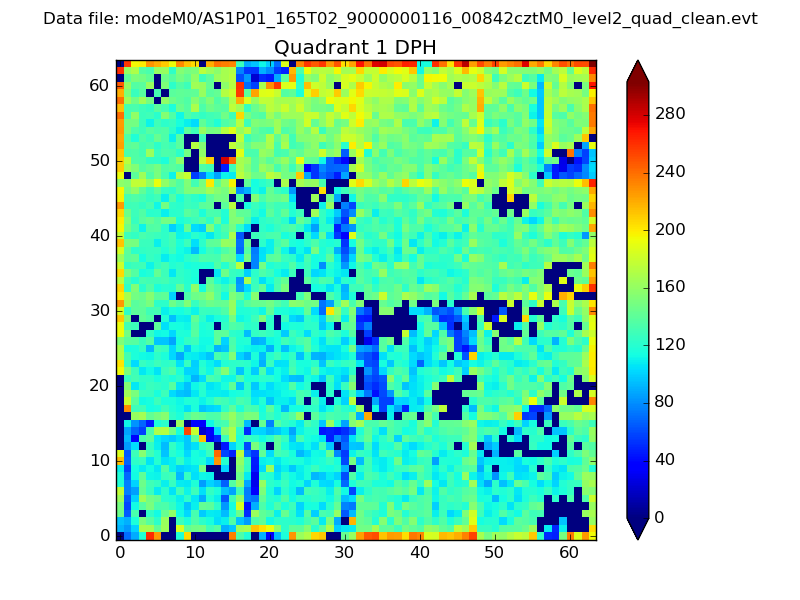 |
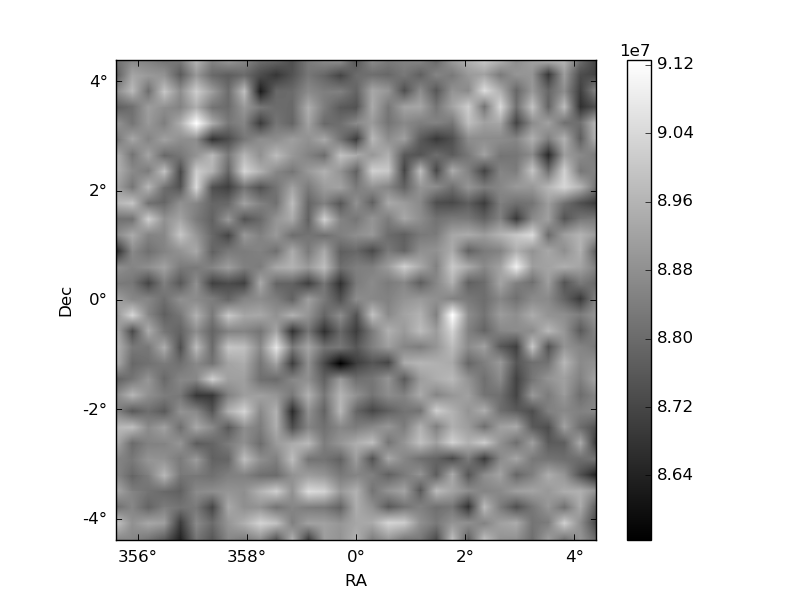
Quadrant B |
|---|---|---|---|
| Quadrant D | 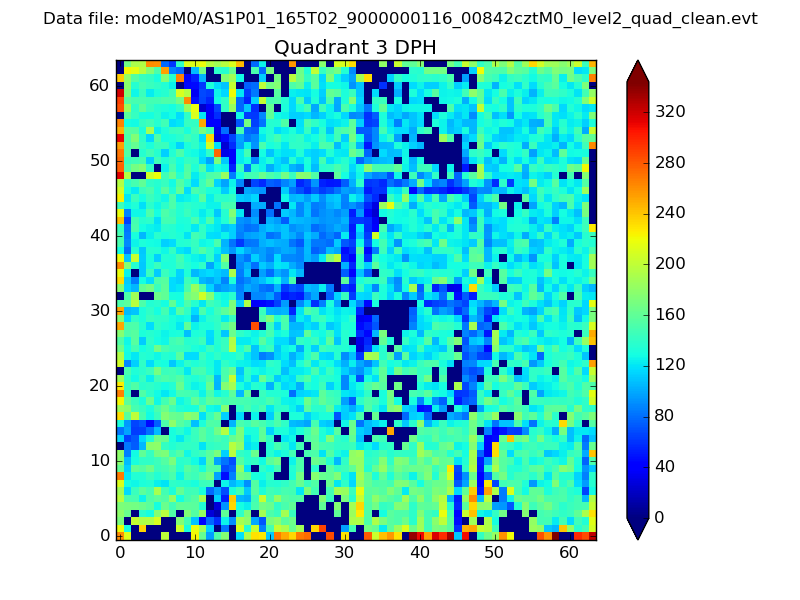 |
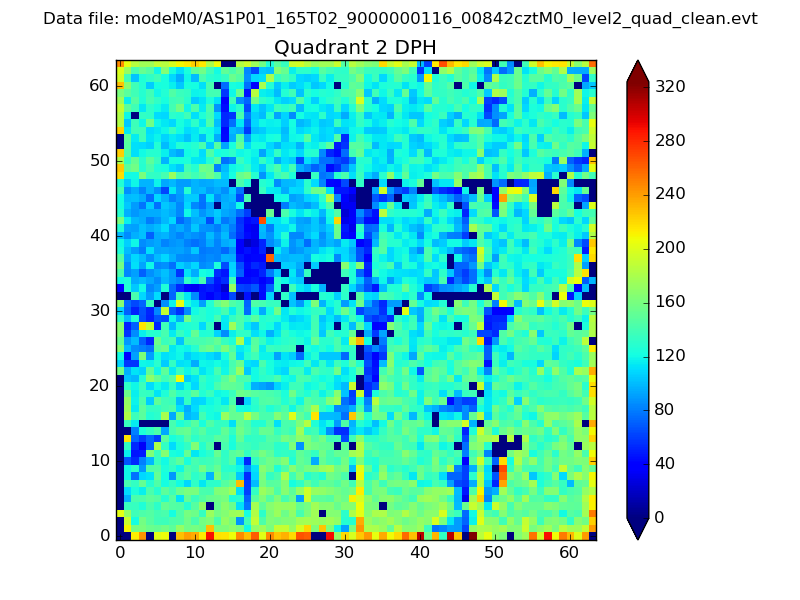 |
Quadrant C |
| Plot type | Count rate plots | Images |
|---|---|---|
| Comparison with Poisson distribution Blue bars denote a histogram of data divided into 1 sec bins. Red curve is a Poisson curve with rate = median count rate of data. |
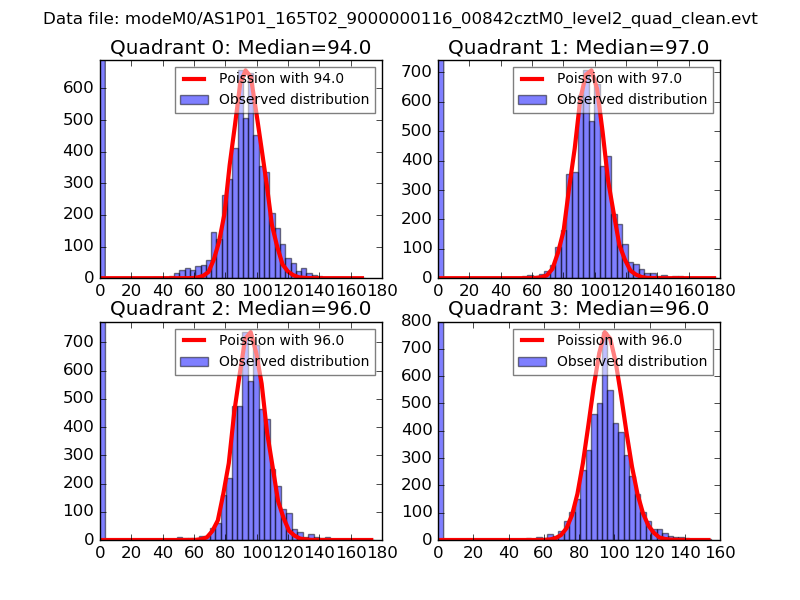 |
 |
| Quadrant-wise count rates Data is divided into 100 sec bins |
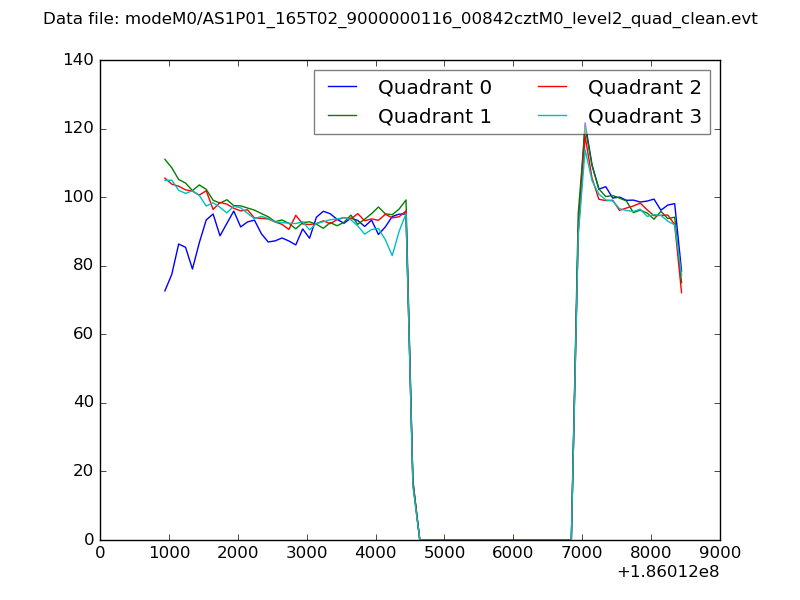 |
|
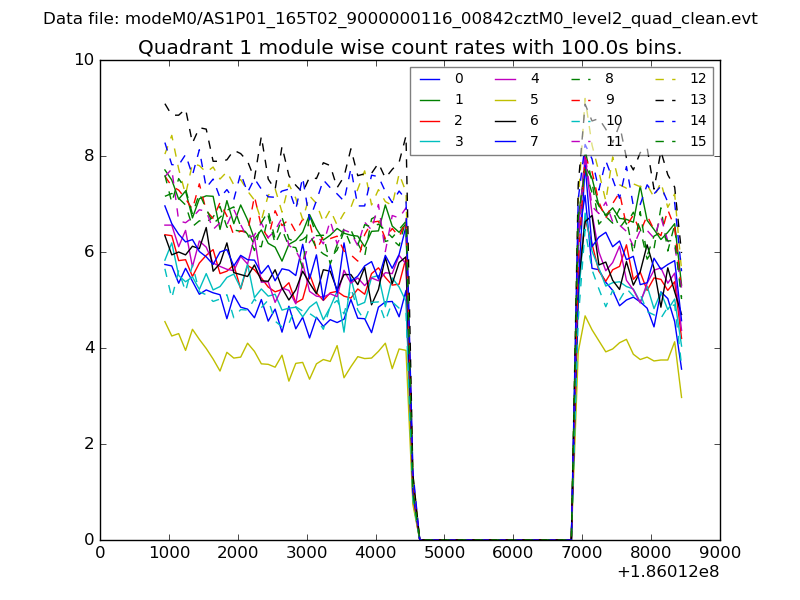
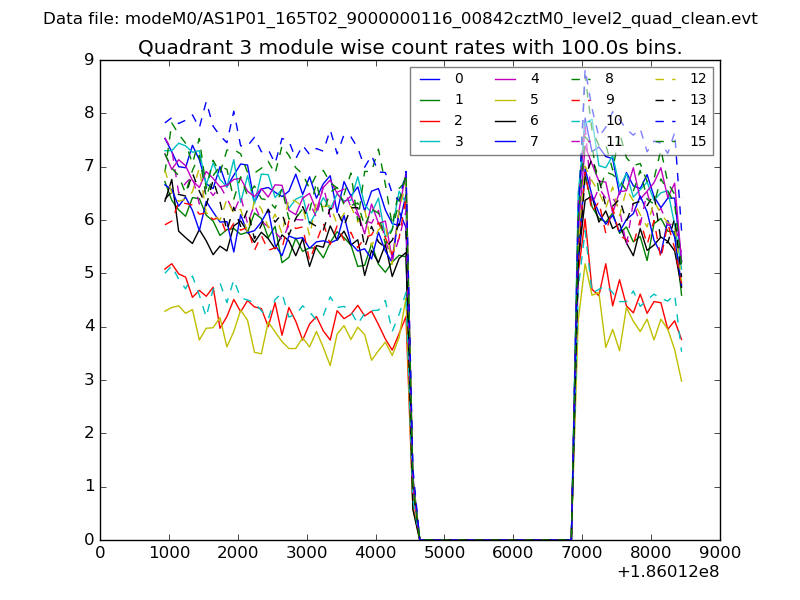
| Module-wise count rates for Quadrant A Data is divided into 100 sec bins |
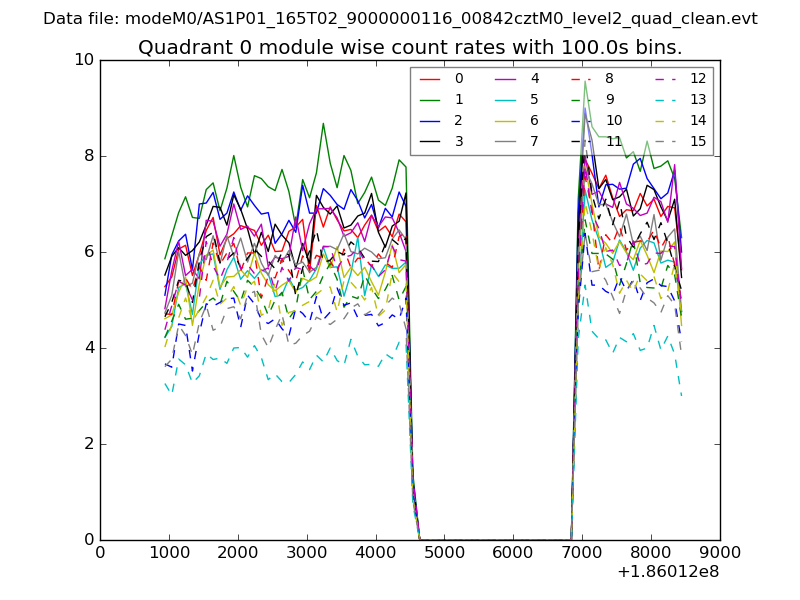 |
 |
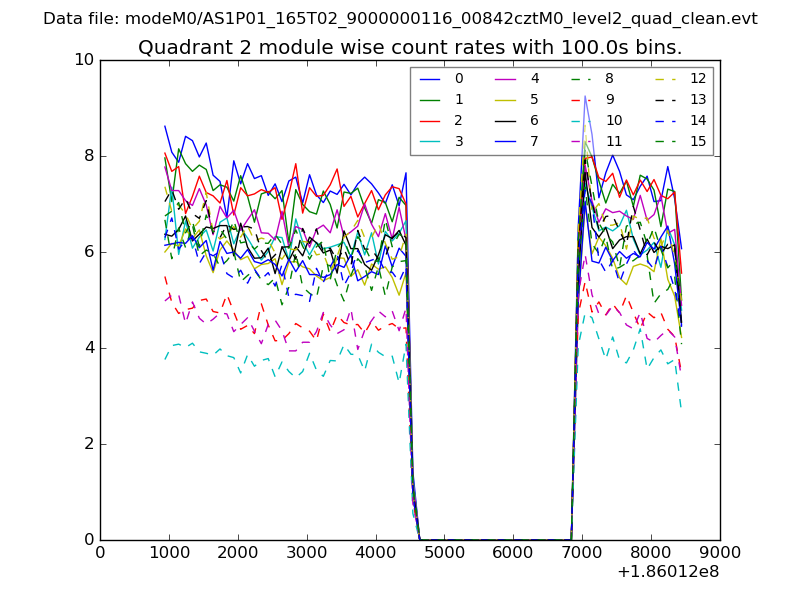
| Module-wise count rates for Quadrant B Data is divided into 100 sec bins |
 |
 |
| Module-wise count rates for Quadrant C Data is divided into 100 sec bins |
 |
 |
| Module-wise count rates for Quadrant D Data is divided into 100 sec bins |
 |
 |
| Parameter | Plot |
|---|---|
| CZT HV Monitor | 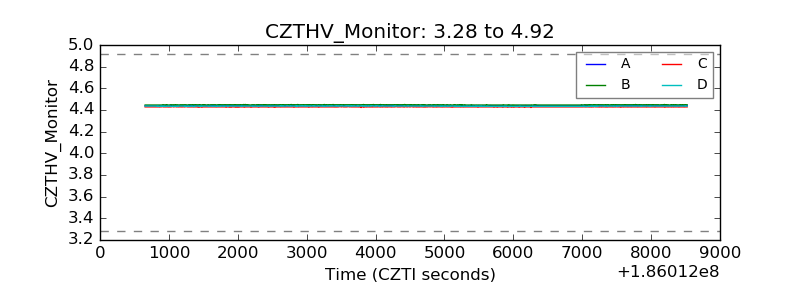 |
| D_VDD | 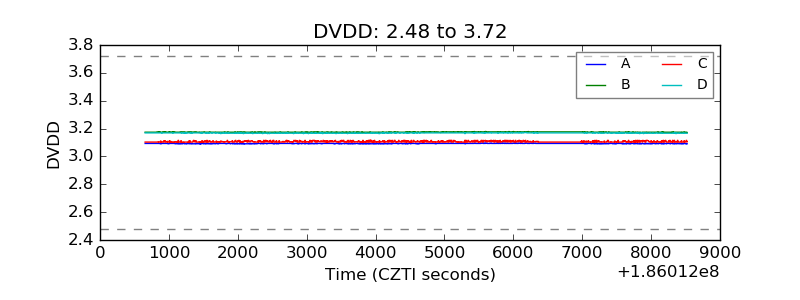 |
| Temperature 1 | 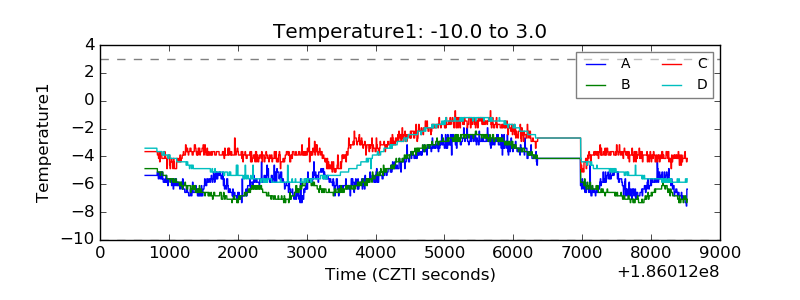 |
| Veto HV Monitor | 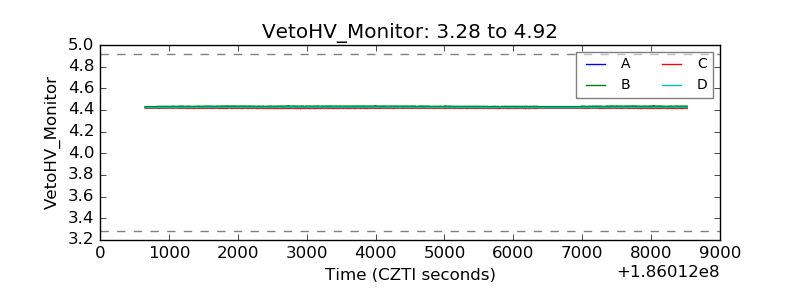 |
| Veto LLD | 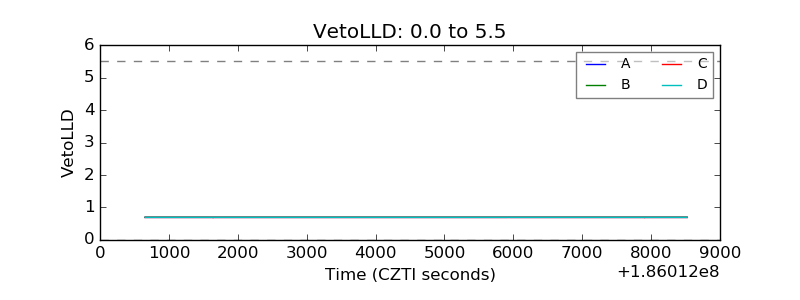 |
| Alpha Counter | 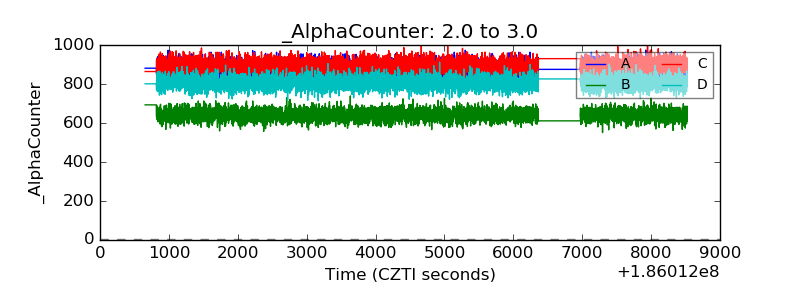 |
| _CPM_Rate | 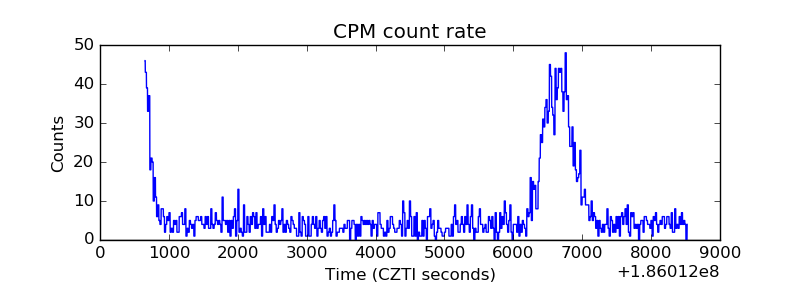 |
| CZT Counter | 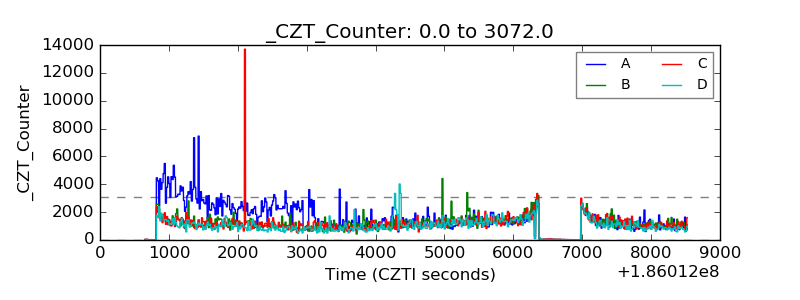 |
| +2.5 Volts monitor |  |
| +5 Volts monitor |  |
| _ROLL_ROT | 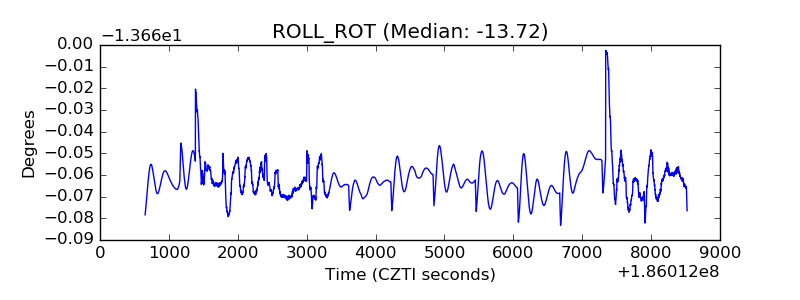 |
| _Roll_DEC | 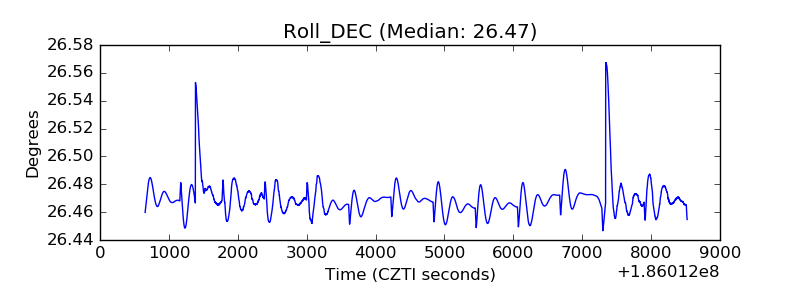 |
| _Roll_RA | 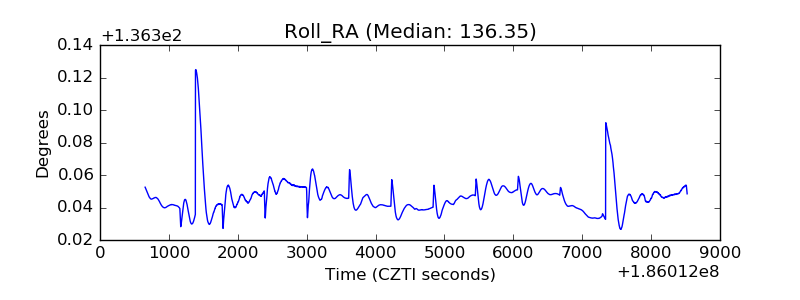 |
| Veto Counter | 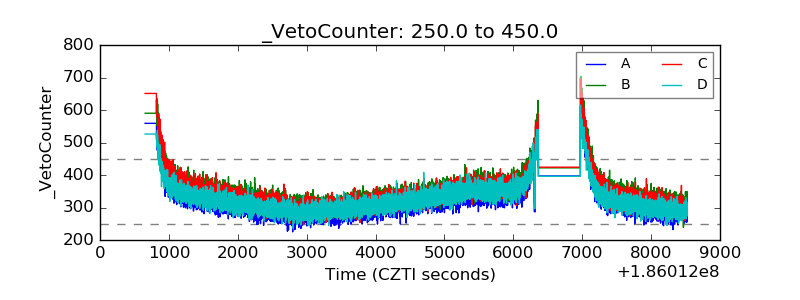 |