| Param | Original file | Final file |
|---|---|---|
| Filename | modeM0/AS1P01_165T02_9000000116_00843cztM0_level2.evt | modeM0/AS1P01_165T02_9000000116_00843cztM0_level2_quad_clean.evt |
| Size (bytes) | 1,359,025,920 | 95,509,440 |
| Size | 1.3 GB | 91.1 MB |
| Events in quadrant A | 10,325,539 | 587,572 |
| Events in quadrant B | 10,891,584 | 582,268 |
| Events in quadrant C | 10,158,116 | 574,697 |
| Events in quadrant D | 9,233,396 | 570,367 |
| Mode M9 | |||
|---|---|---|---|
| Quadrant | BADHDUFLAG | Total packets | Discarded packets |
| A | 0 | 6 | 0 |
| B | 0 | 6 | 0 |
| C | 0 | 6 | 0 |
| D | 0 | 6 | 0 |
| Mode SS | |||
|---|---|---|---|
| Quadrant | BADHDUFLAG | Total packets | Discarded packets |
| A | 0 | 168 | 0 |
| B | 0 | 168 | 0 |
| C | 0 | 168 | 0 |
| D | 0 | 168 | 0 |
| Mode M0 | |||
|---|---|---|---|
| Quadrant | BADHDUFLAG | Total packets | Discarded packets |
| A | 0 | 36571 | 0 |
| B | 0 | 38263 | 0 |
| C | 0 | 36081 | 0 |
| D | 0 | 33401 | 0 |
| Quadrant | Total seconds | Saturated seconds | Saturation percentage |
|---|---|---|---|
| A | 8311 | 21 | 0.252677% |
| B | 8311 | 47 | 0.565516% |
| C | 8312 | 42 | 0.505294% |
| D | 8312 | 11 | 0.132339% |
Noise dominated data is calculated using 1-second bins in cleaned event files. If a bin has >2000 counts, and if more than 50% of those come from <1% of pixels, then it is considered to be noise-dominated and hence unusable.
| Quadrant | # 1 sec bins | Bins with >0 counts | Bins with >2000 counts | High rate bins dominated by noise | Noise dominated (total time) | Noise dominated (detector-on time) | Marked lightcurve |
|---|---|---|---|---|---|---|---|
| A | 8936 | 8313 | 569 | 569 | 6.37% | 6.84% |  |
| B | 8936 | 8313 | 744 | 744 | 8.33% | 8.95% | 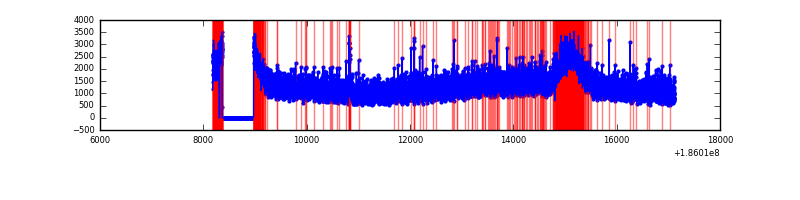 |
| C | 8937 | 8314 | 538 | 538 | 6.02% | 6.47% | 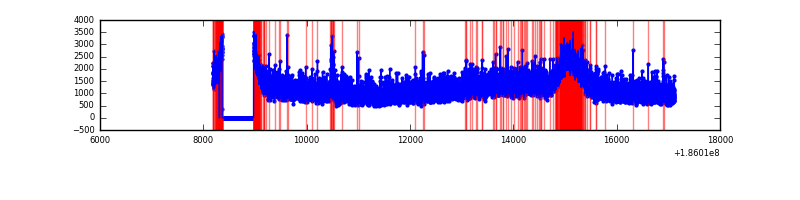 |
| D | 8937 | 8314 | 358 | 358 | 4.01% | 4.31% | 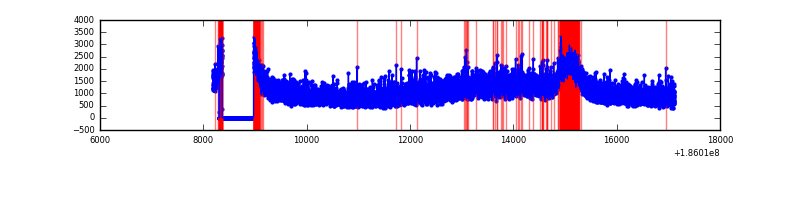 |
Top three noisy pixels from each quadrant. If the there are fewer than three noisy pixels in the level2.evt file, extra rows are filled as -1
| Pixel properties | Quadrant properties | ||||||
|---|---|---|---|---|---|---|---|
| Quadrant | DetID | PixID | Counts | Sigma | Mean | Median | Sigma |
| A | 15 | 171 | 141689 | 215.62 | 2645 | 2670 | 644.7 |
| A | 15 | 127 | 38631 | 55.78 | 2645 | 2670 | 644.7 |
| A | 11 | 79 | 9947 | 11.29 | 2645 | 2670 | 644.7 |
| B | 0 | 220 | 62446 | 90.65 | 2790 | 2810 | 657.8 |
| B | 5 | 191 | 54847 | 79.1 | 2790 | 2810 | 657.8 |
| B | 8 | 38 | 50173 | 72.0 | 2790 | 2810 | 657.8 |
| C | 8 | 208 | 97360 | 134.29 | 2509 | 2597 | 705.7 |
| C | 5 | 234 | 81347 | 111.6 | 2509 | 2597 | 705.7 |
| C | 3 | 111 | 43018 | 57.28 | 2509 | 2597 | 705.7 |
| D | 13 | 169 | 76136 | 98.55 | 2396 | 2478 | 747.4 |
| D | 1 | 4 | 58888 | 75.48 | 2396 | 2478 | 747.4 |
| D | 10 | 85 | 43762 | 55.24 | 2396 | 2478 | 747.4 |
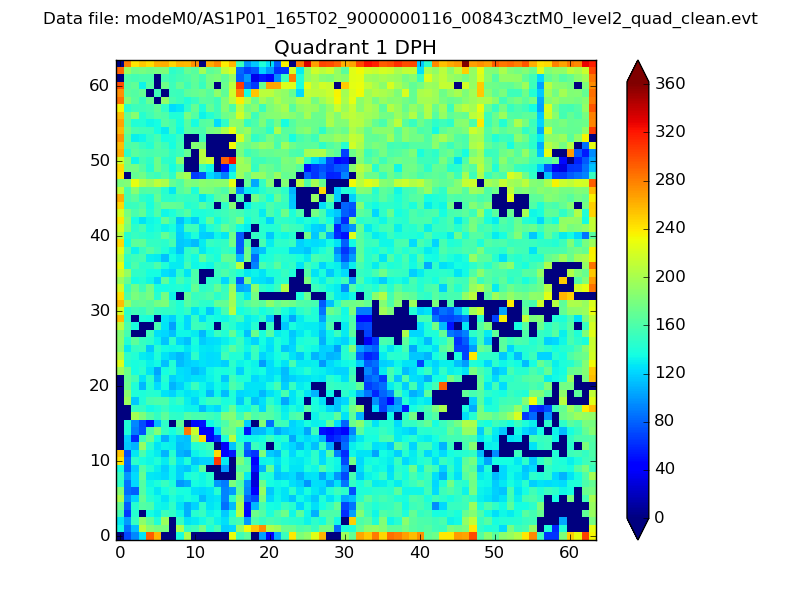
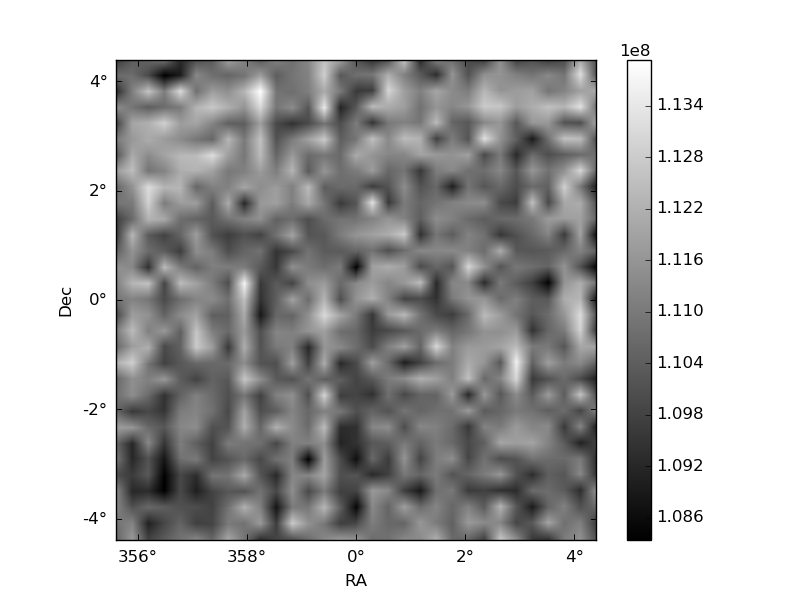
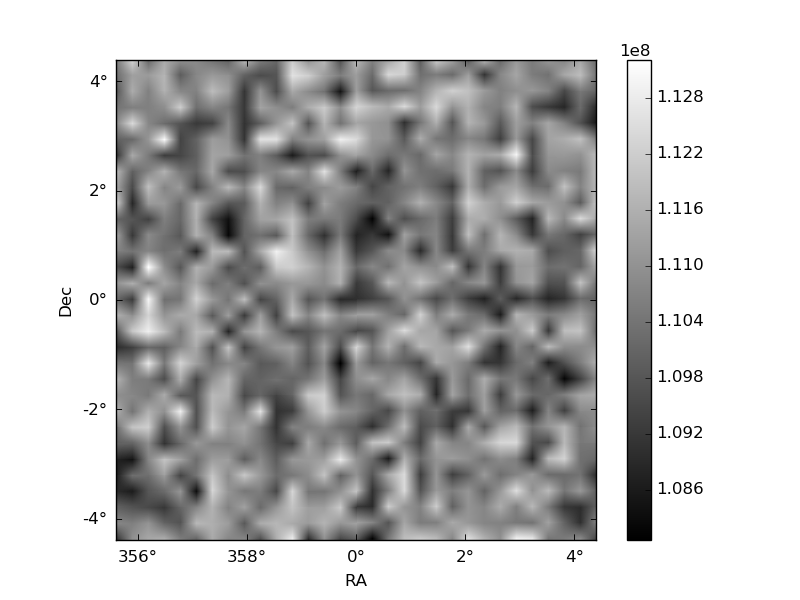
Histogram calculated using DETX and DETY for each event in the final _common_clean file
| Quadrant A | 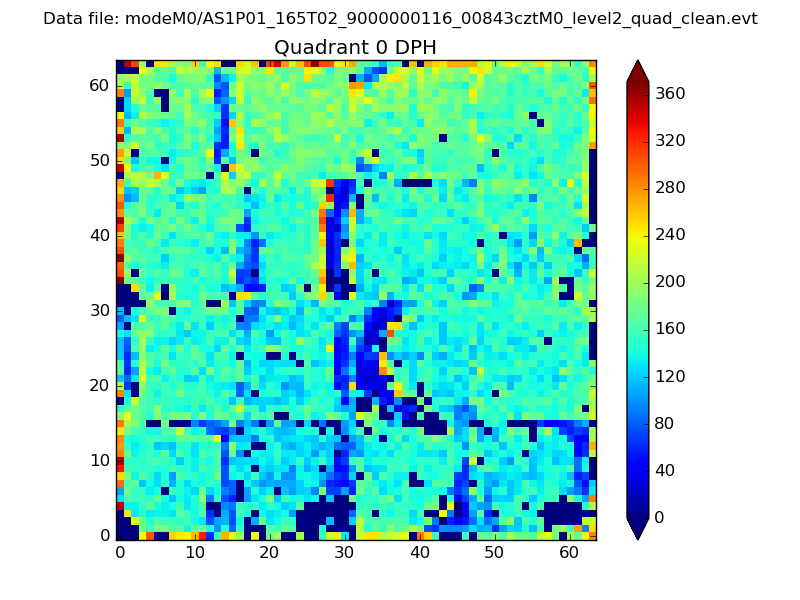 |
 |
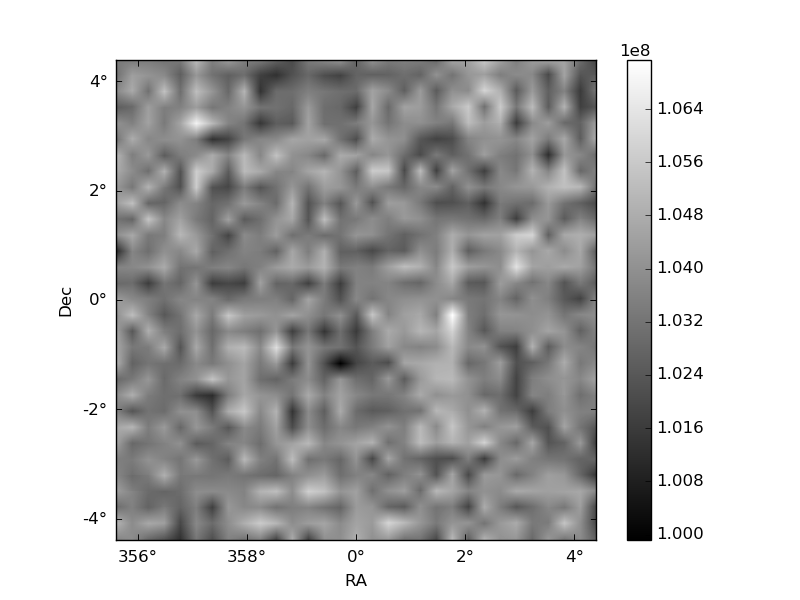
Quadrant B |
|---|---|---|---|
| Quadrant D | 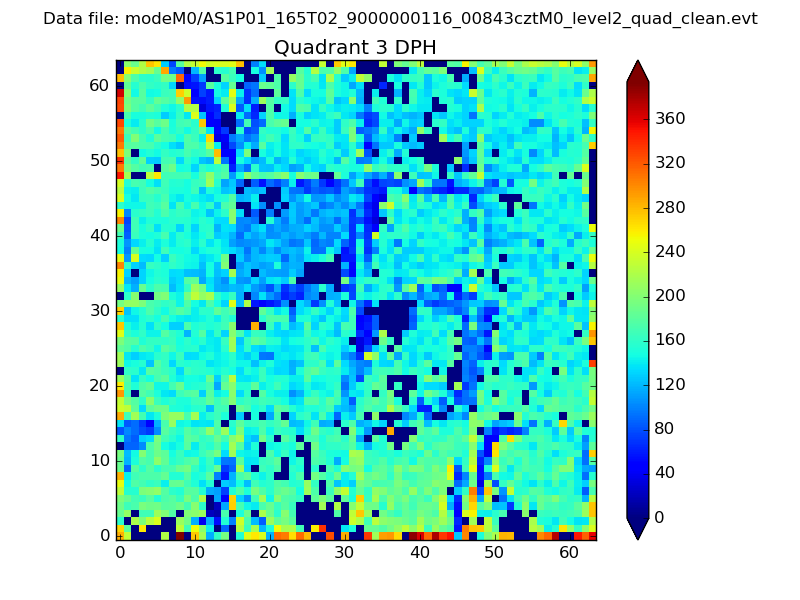 |
 |
Quadrant C |
| Plot type | Count rate plots | Images |
|---|---|---|
| Comparison with Poisson distribution Blue bars denote a histogram of data divided into 1 sec bins. Red curve is a Poisson curve with rate = median count rate of data. |
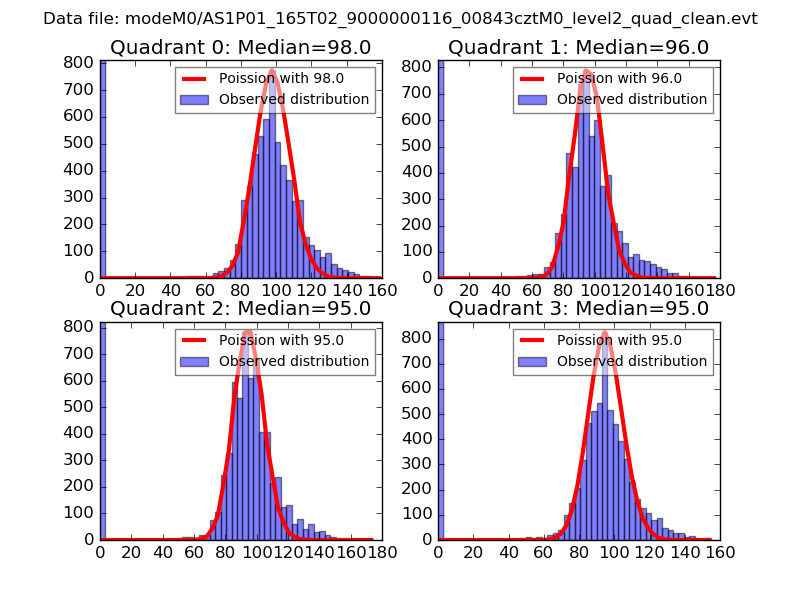 |
 |
| Quadrant-wise count rates Data is divided into 100 sec bins |
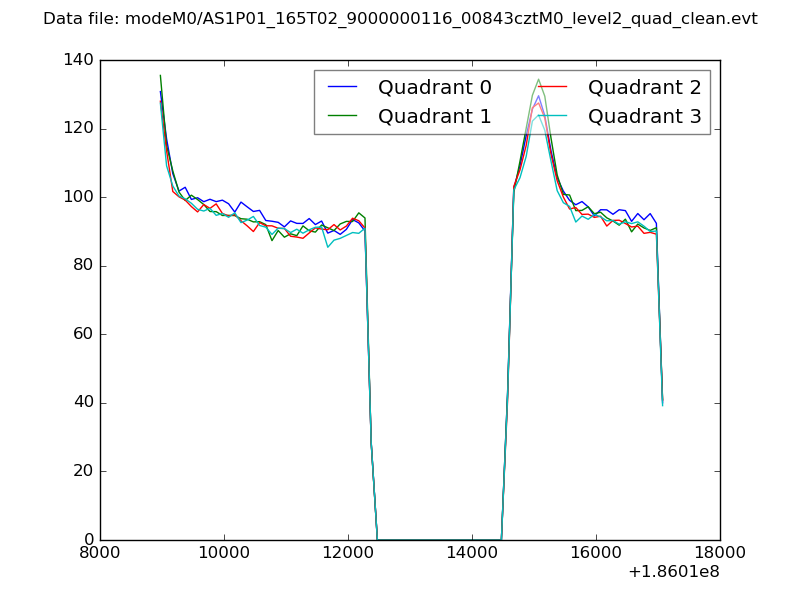 |
|
| Module-wise count rates for Quadrant A Data is divided into 100 sec bins |
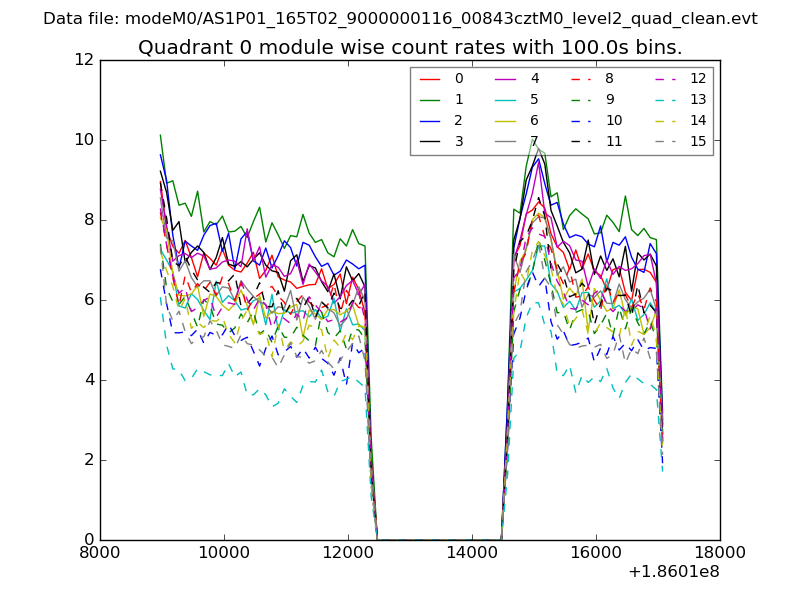 |
 |
| Module-wise count rates for Quadrant B Data is divided into 100 sec bins |
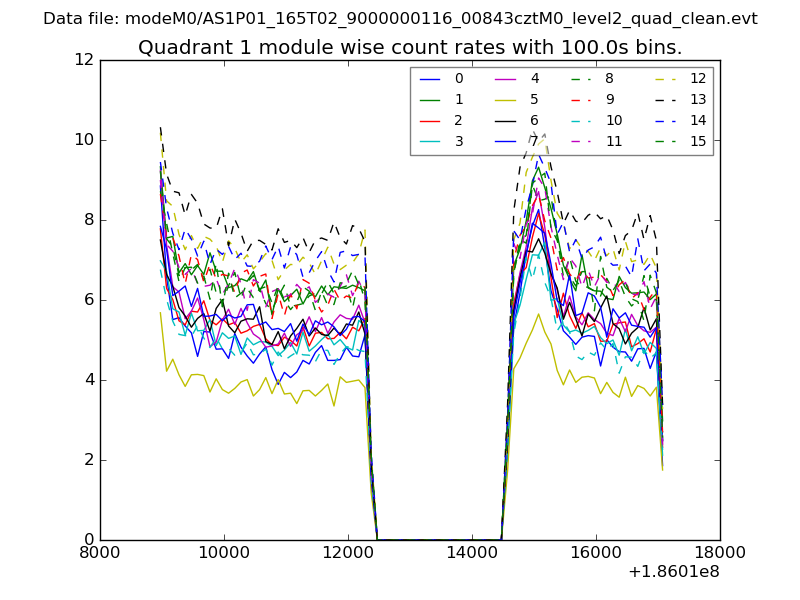 |
 |
| Module-wise count rates for Quadrant C Data is divided into 100 sec bins |
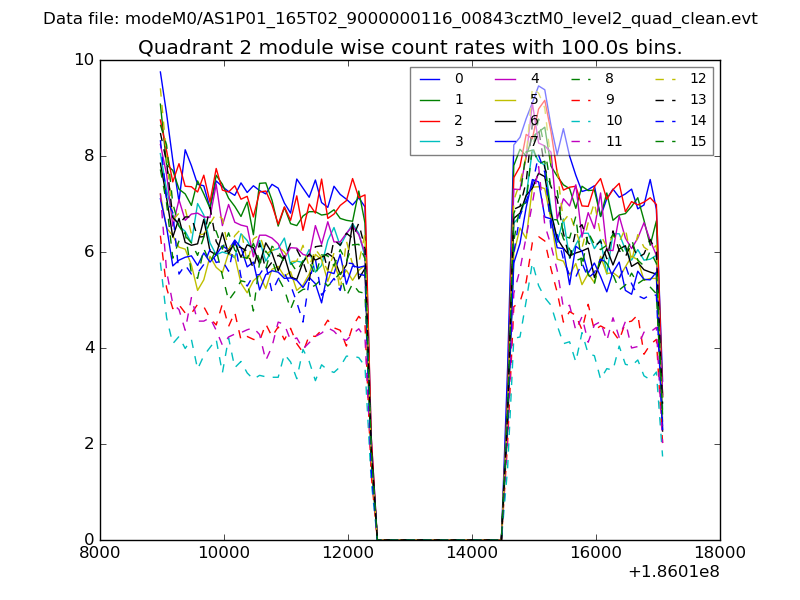 |
 |
| Module-wise count rates for Quadrant D Data is divided into 100 sec bins |
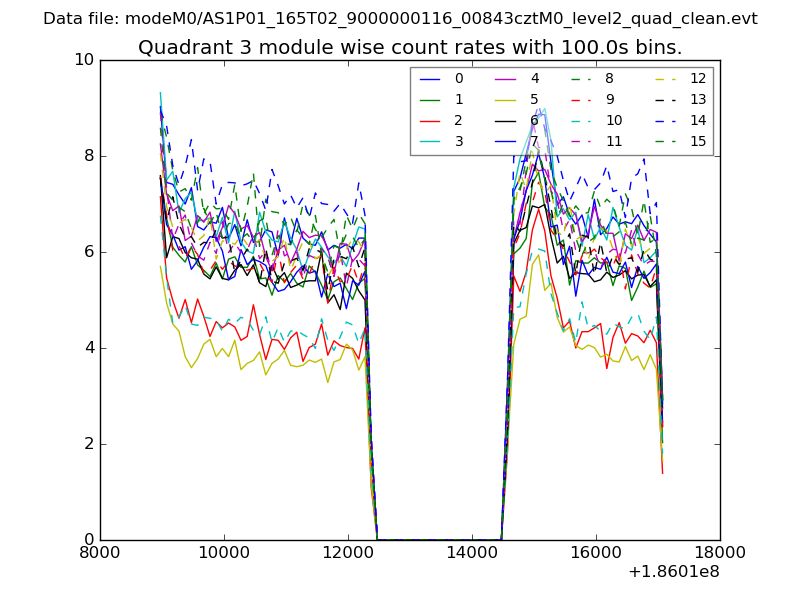 |
 |
| Parameter | Plot |
|---|---|
| CZT HV Monitor | 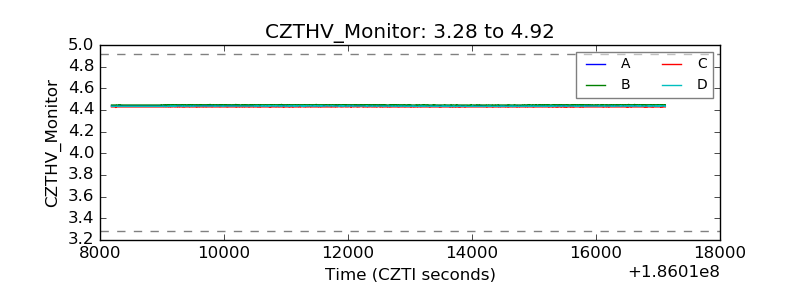 |
| D_VDD | 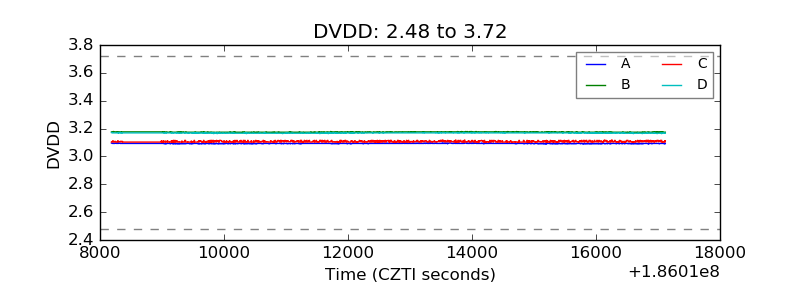 |
| Temperature 1 | 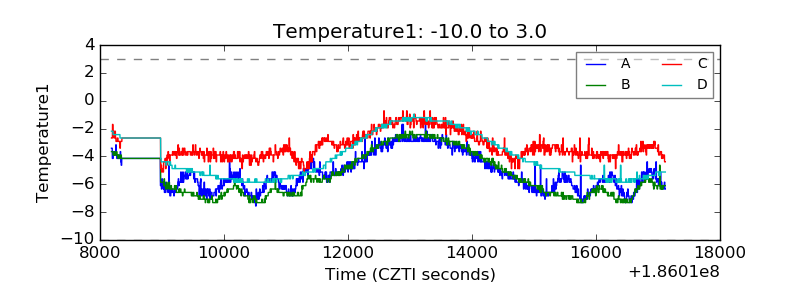 |
| Veto HV Monitor | 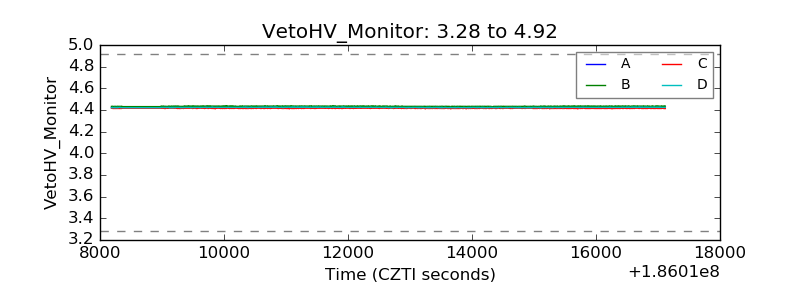 |
| Veto LLD | 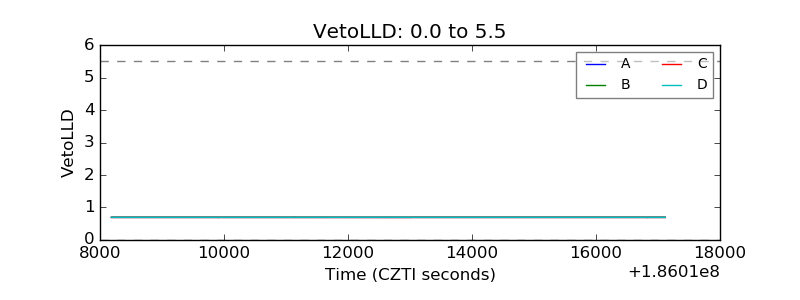 |
| Alpha Counter |  |
| _CPM_Rate | 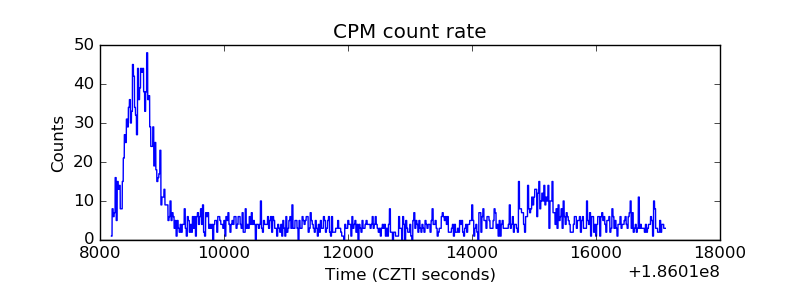 |
| CZT Counter |  |
| +2.5 Volts monitor |  |
| +5 Volts monitor |  |
| _ROLL_ROT | 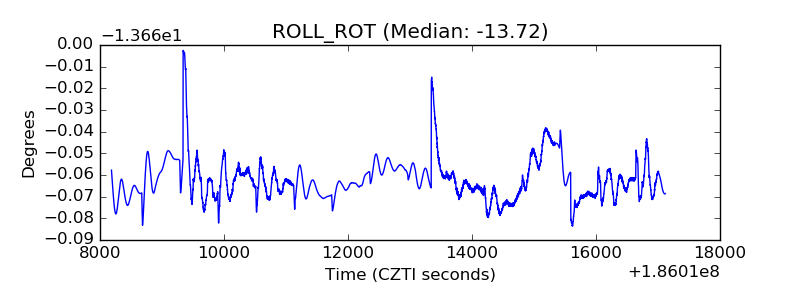 |
| _Roll_DEC | 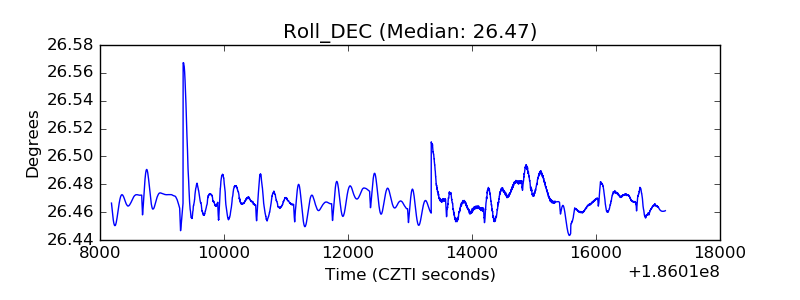 |
| _Roll_RA |  |
| Veto Counter | 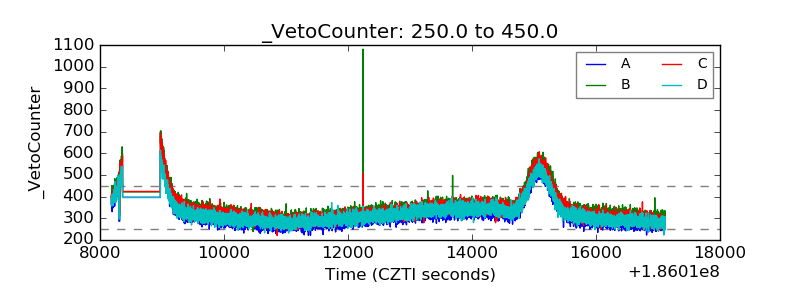 |