| Param | Original file | Final file |
|---|---|---|
| Filename | modeM0/AS1P01_165T02_9000000116_00845cztM0_level2.evt | modeM0/AS1P01_165T02_9000000116_00845cztM0_level2_quad_clean.evt |
| Size (bytes) | 1,159,479,360 | 80,959,680 |
| Size | 1.1 GB | 77.2 MB |
| Events in quadrant A | 8,667,432 | 493,259 |
| Events in quadrant B | 9,643,721 | 487,437 |
| Events in quadrant C | 8,343,959 | 483,748 |
| Events in quadrant D | 7,974,834 | 477,804 |
| Mode SS | |||
|---|---|---|---|
| Quadrant | BADHDUFLAG | Total packets | Discarded packets |
| A | 0 | 146 | 0 |
| B | 0 | 146 | 0 |
| C | 0 | 146 | 0 |
| D | 0 | 146 | 0 |
| Mode M0 | |||
|---|---|---|---|
| Quadrant | BADHDUFLAG | Total packets | Discarded packets |
| A | 0 | 30939 | 0 |
| B | 0 | 33830 | 0 |
| C | 0 | 29968 | 0 |
| D | 0 | 28999 | 0 |
| Quadrant | Total seconds | Saturated seconds | Saturation percentage |
|---|---|---|---|
| A | 7318 | 6 | 0.081990% |
| B | 7318 | 95 | 1.298169% |
| C | 7318 | 2 | 0.027330% |
| D | 7319 | 40 | 0.546523% |
Noise dominated data is calculated using 1-second bins in cleaned event files. If a bin has >2000 counts, and if more than 50% of those come from <1% of pixels, then it is considered to be noise-dominated and hence unusable.
| Quadrant | # 1 sec bins | Bins with >0 counts | Bins with >2000 counts | High rate bins dominated by noise | Noise dominated (total time) | Noise dominated (detector-on time) | Marked lightcurve |
|---|---|---|---|---|---|---|---|
| A | 7318 | 7318 | 234 | 234 | 3.20% | 3.20% | 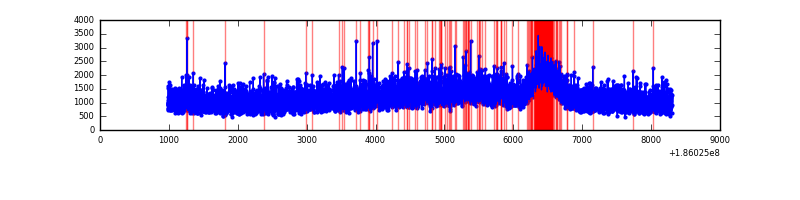 |
| B | 7318 | 7318 | 660 | 660 | 9.02% | 9.02% | 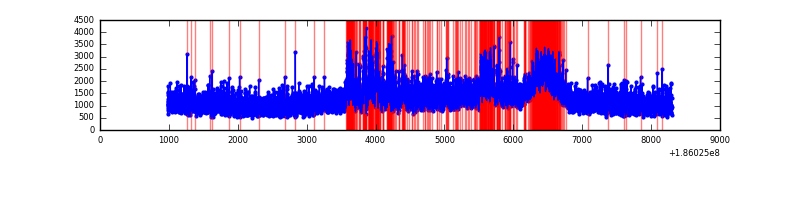 |
| C | 7318 | 7318 | 213 | 213 | 2.91% | 2.91% | 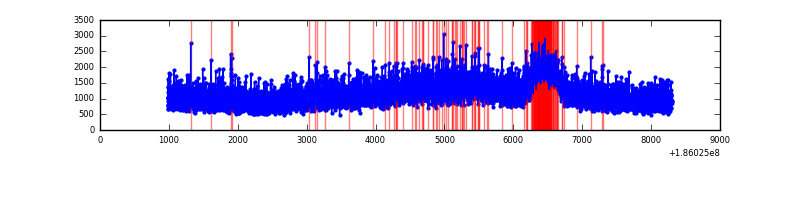 |
| D | 7319 | 7319 | 155 | 155 | 2.12% | 2.12% | 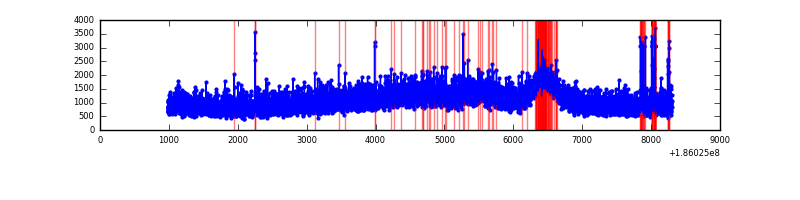 |
Top three noisy pixels from each quadrant. If the there are fewer than three noisy pixels in the level2.evt file, extra rows are filled as -1
| Pixel properties | Quadrant properties | ||||||
|---|---|---|---|---|---|---|---|
| Quadrant | DetID | PixID | Counts | Sigma | Mean | Median | Sigma |
| A | 14 | 170 | 130978 | 241.02 | 2208 | 2226 | 534.2 |
| A | 15 | 171 | 57118 | 102.76 | 2208 | 2226 | 534.2 |
| A | 15 | 127 | 8036 | 10.88 | 2208 | 2226 | 534.2 |
| B | 8 | 38 | 549461 | 1005.76 | 2318 | 2330 | 544.0 |
| B | 0 | 187 | 123711 | 223.13 | 2318 | 2330 | 544.0 |
| B | 0 | 220 | 72185 | 128.41 | 2318 | 2330 | 544.0 |
| C | 3 | 111 | 41088 | 66.32 | 2092 | 2164 | 586.9 |
| C | 3 | 79 | 30362 | 48.05 | 2092 | 2164 | 586.9 |
| C | 5 | 234 | 26428 | 41.34 | 2092 | 2164 | 586.9 |
| D | 1 | 4 | 138191 | 229.68 | 2031 | 2080 | 592.6 |
| D | 7 | 207 | 110259 | 182.55 | 2031 | 2080 | 592.6 |
| D | 13 | 169 | 41110 | 65.86 | 2031 | 2080 | 592.6 |
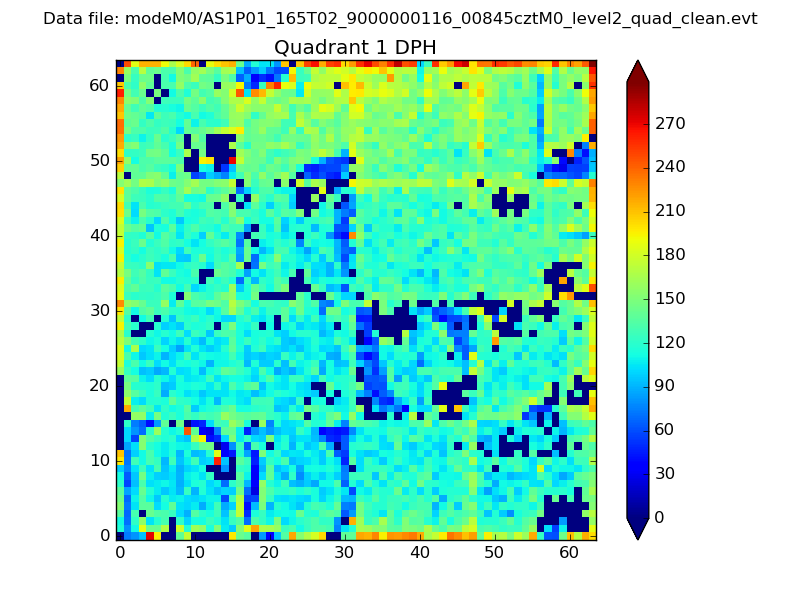
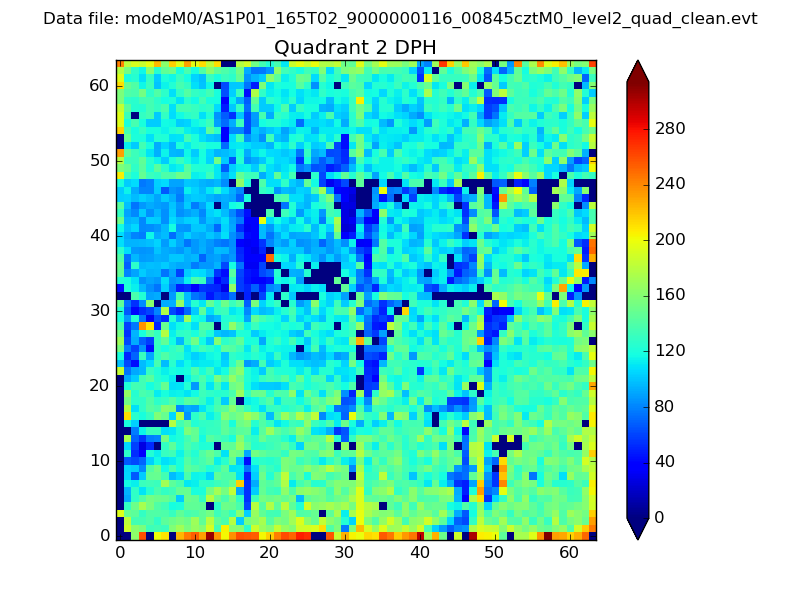
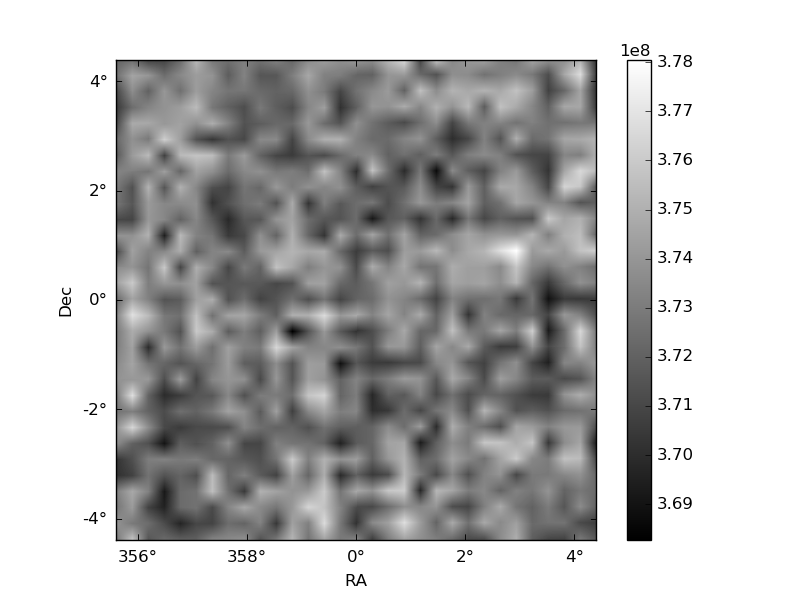
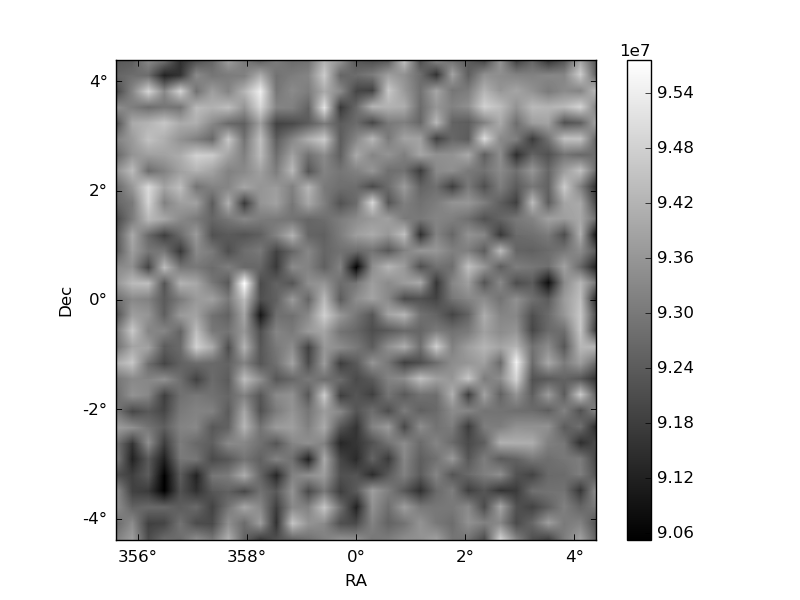
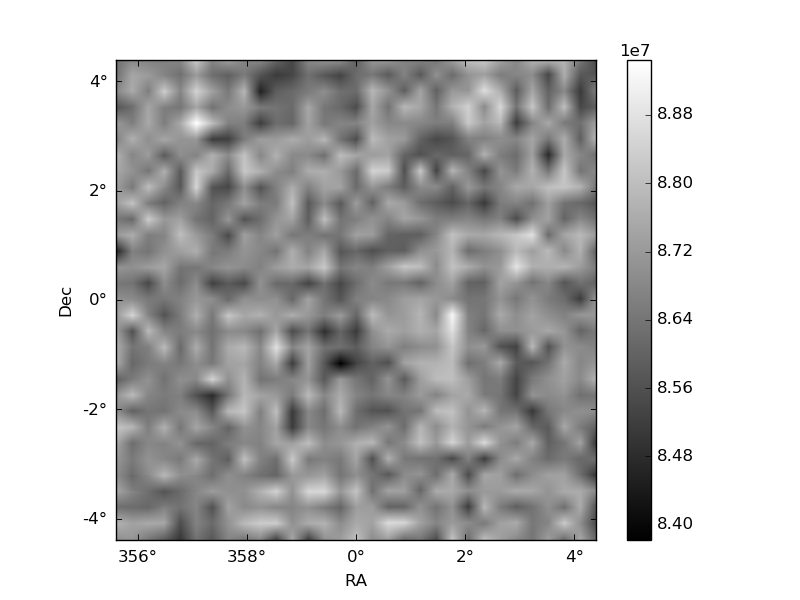
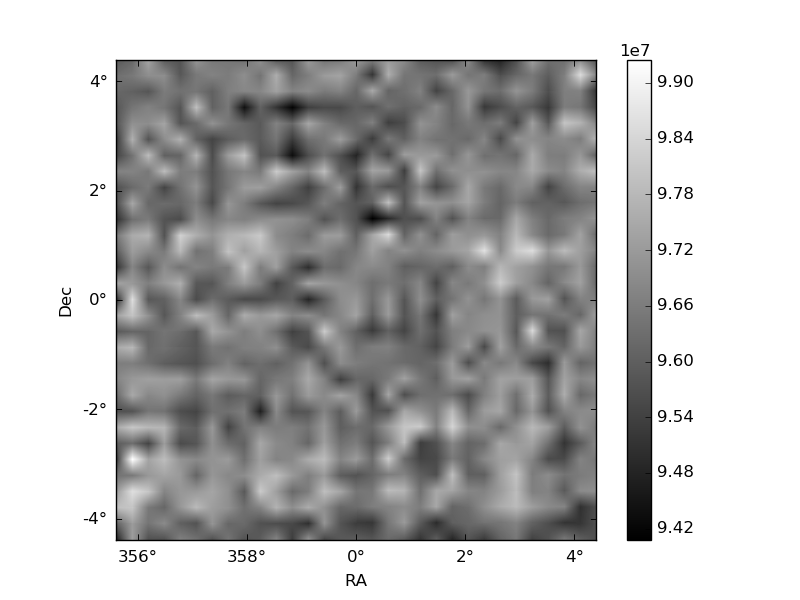
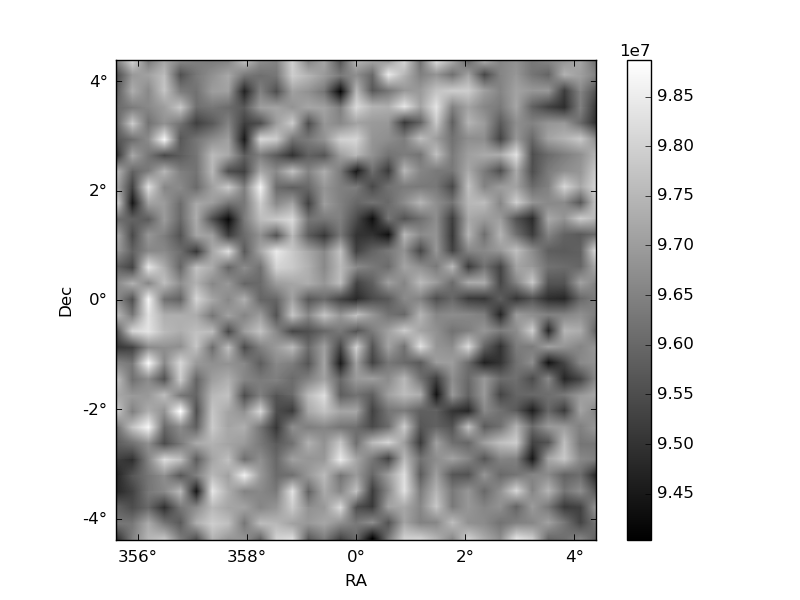
Histogram calculated using DETX and DETY for each event in the final _common_clean file
| Quadrant A |  |
 |
Quadrant B |
|---|---|---|---|
| Quadrant D | 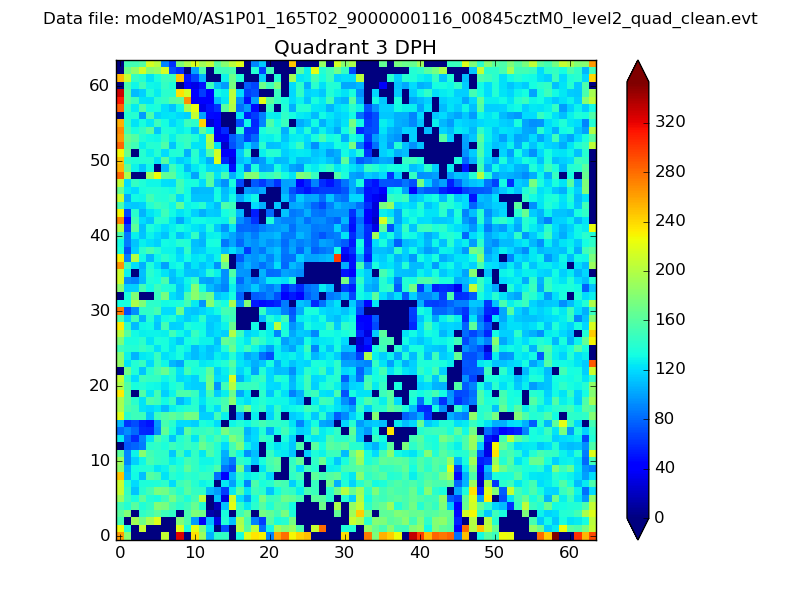 |
 |
Quadrant C |
| Plot type | Count rate plots | Images |
|---|---|---|
| Comparison with Poisson distribution Blue bars denote a histogram of data divided into 1 sec bins. Red curve is a Poisson curve with rate = median count rate of data. |
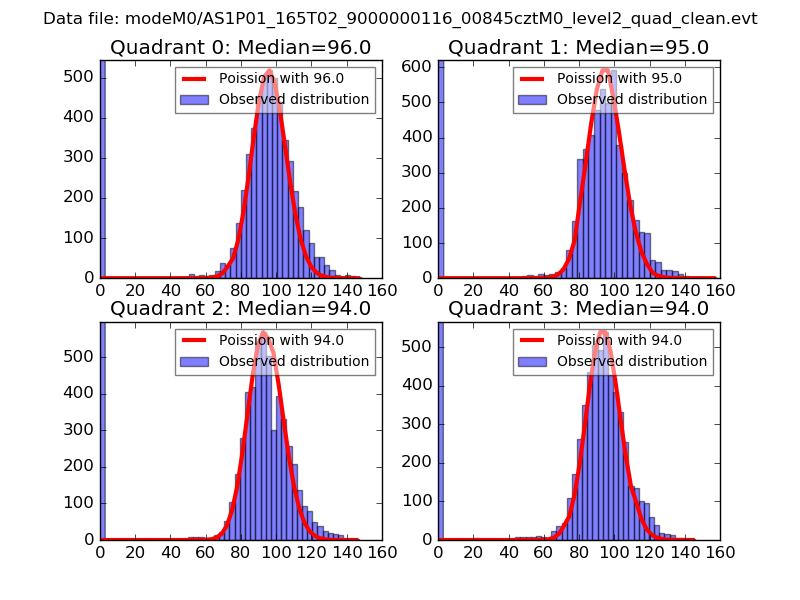 |
 |
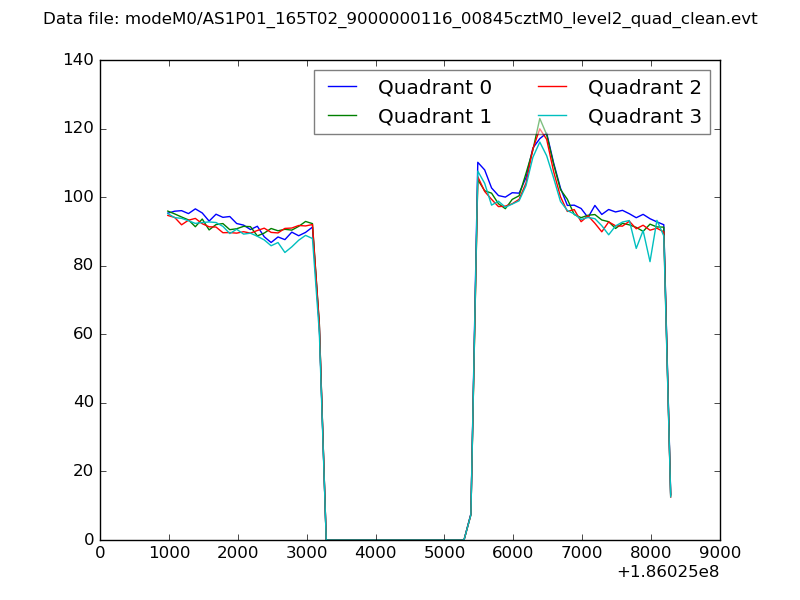
| Quadrant-wise count rates Data is divided into 100 sec bins |
 |
|
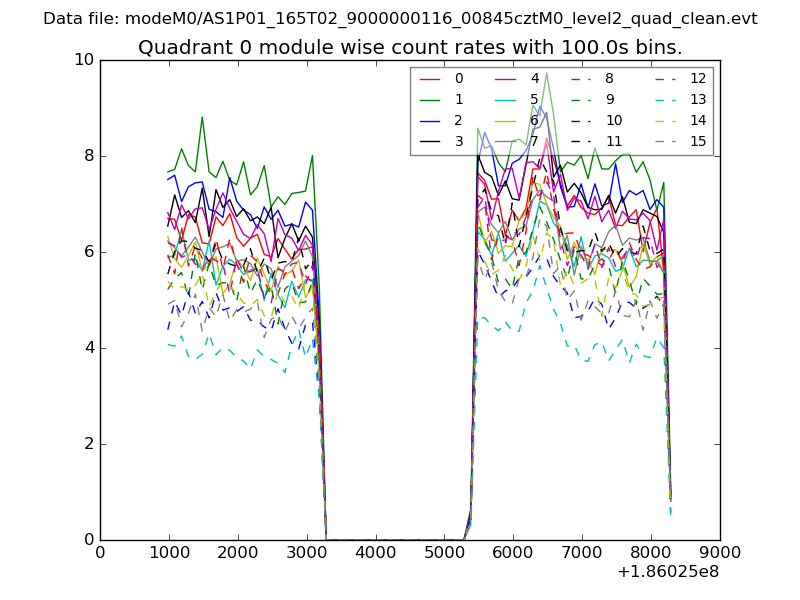
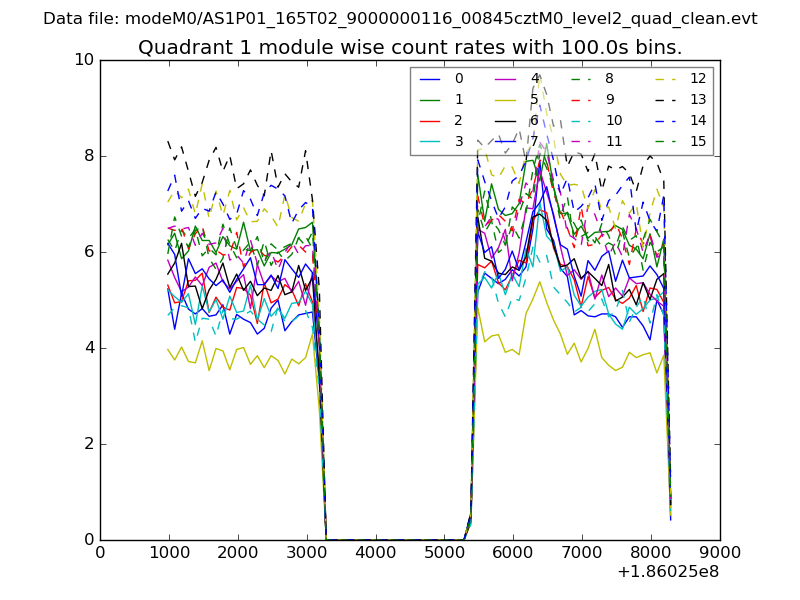
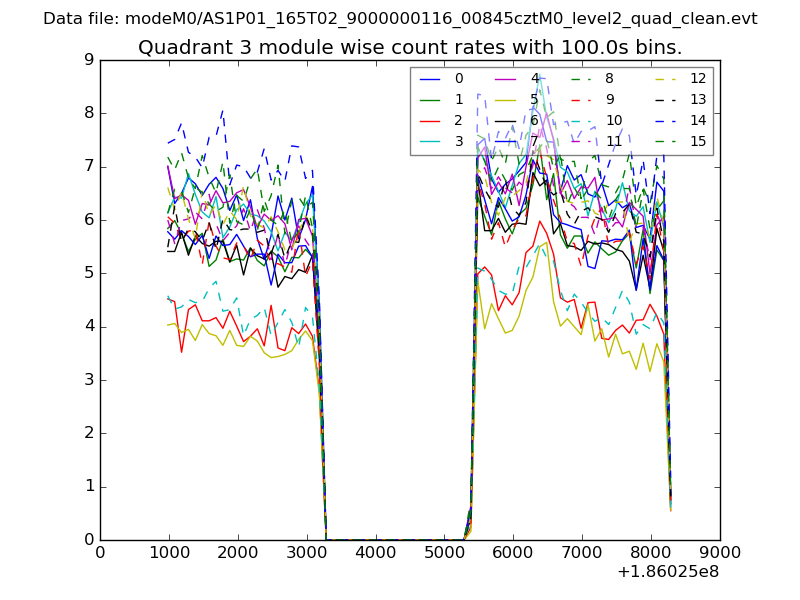
| Module-wise count rates for Quadrant A Data is divided into 100 sec bins |
 |
 |
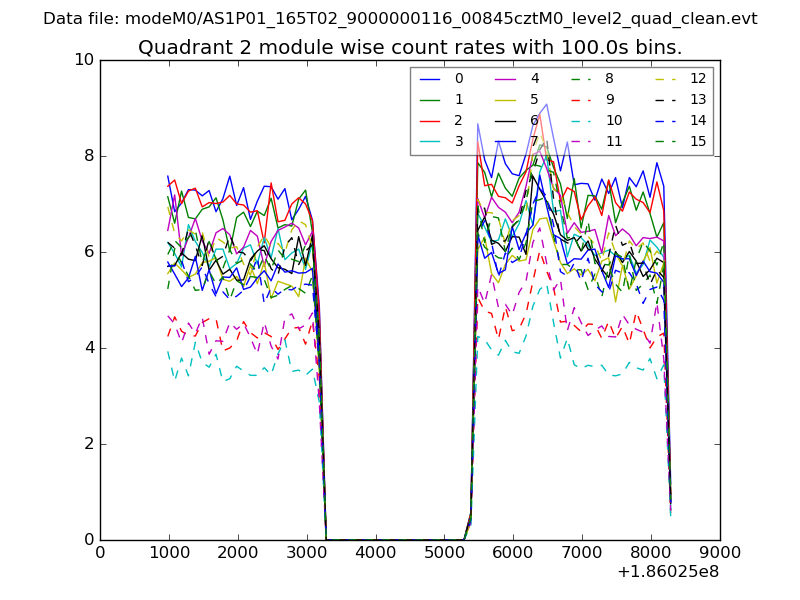
| Module-wise count rates for Quadrant B Data is divided into 100 sec bins |
 |
 |
| Module-wise count rates for Quadrant C Data is divided into 100 sec bins |
 |
 |
| Module-wise count rates for Quadrant D Data is divided into 100 sec bins |
 |
 |
| Parameter | Plot |
|---|---|
| CZT HV Monitor | 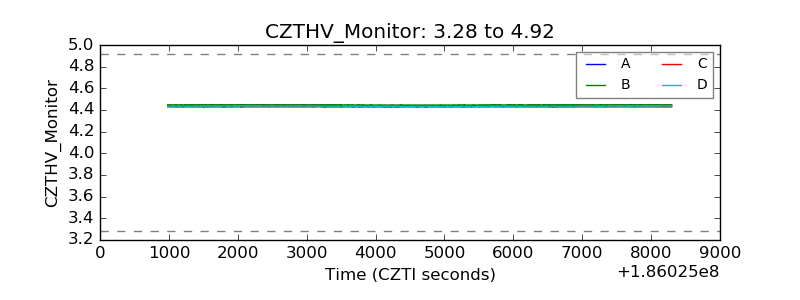 |
| D_VDD | 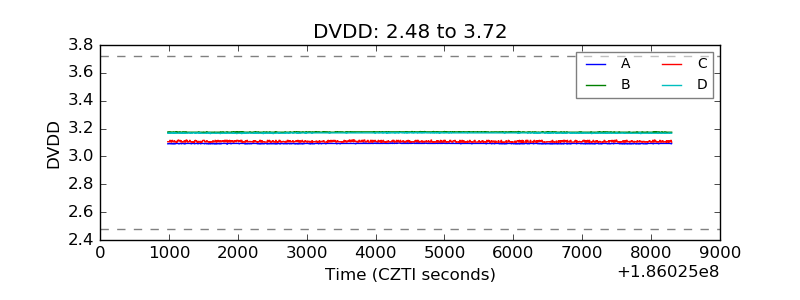 |
| Temperature 1 | 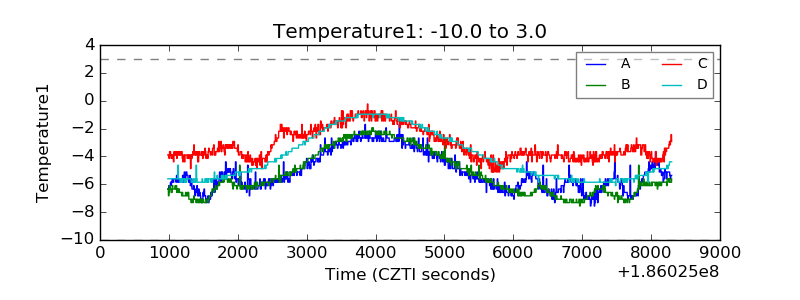 |
| Veto HV Monitor | 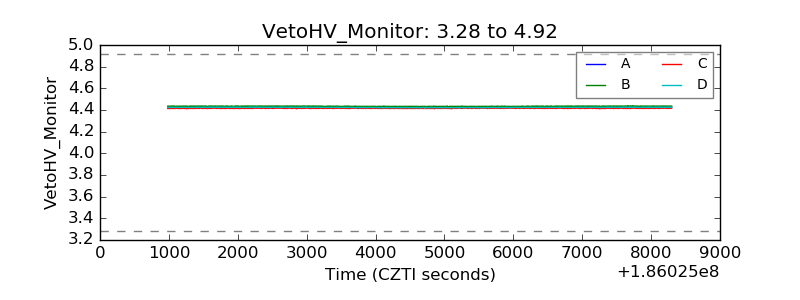 |
| Veto LLD | 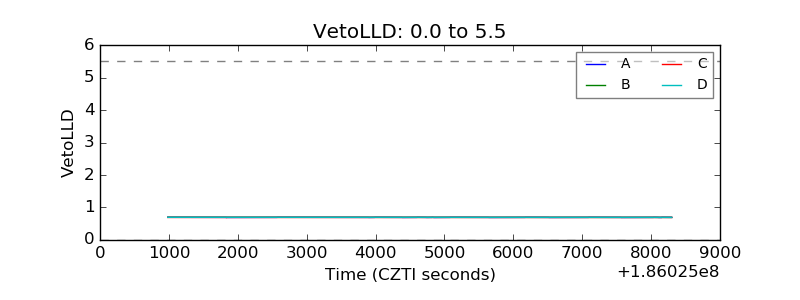 |
| Alpha Counter | 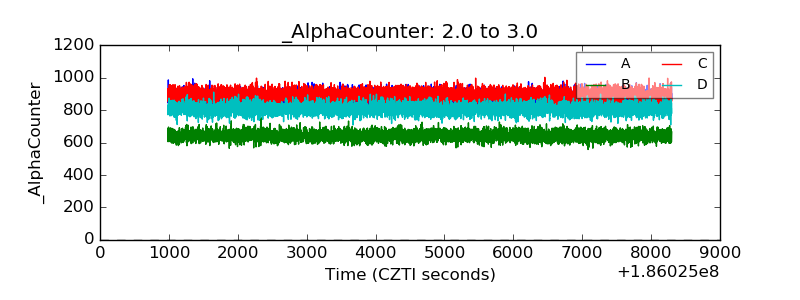 |
| _CPM_Rate | 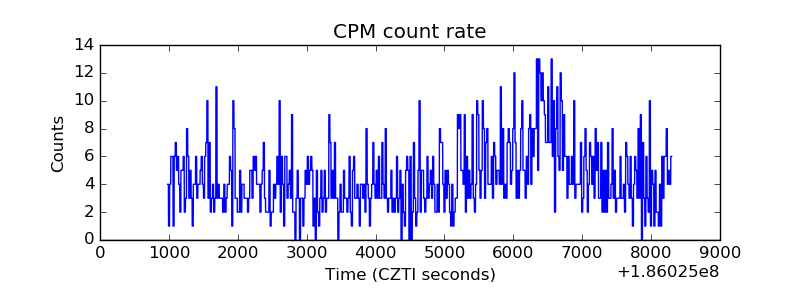 |
| CZT Counter | 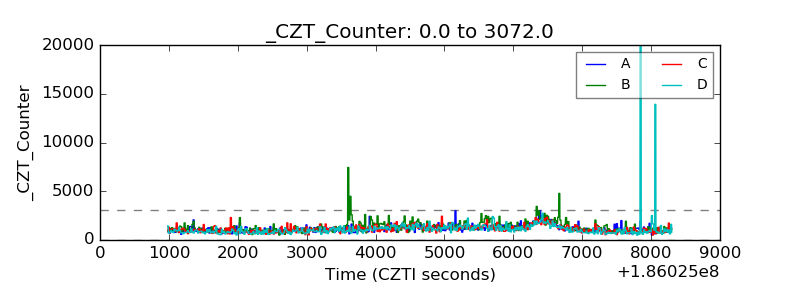 |
| +2.5 Volts monitor |  |
| +5 Volts monitor |  |
| _ROLL_ROT | 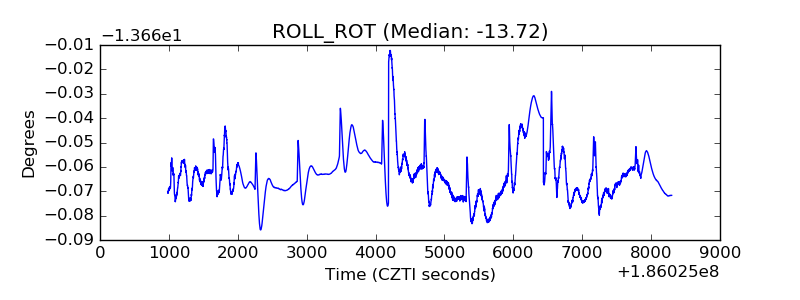 |
| _Roll_DEC | 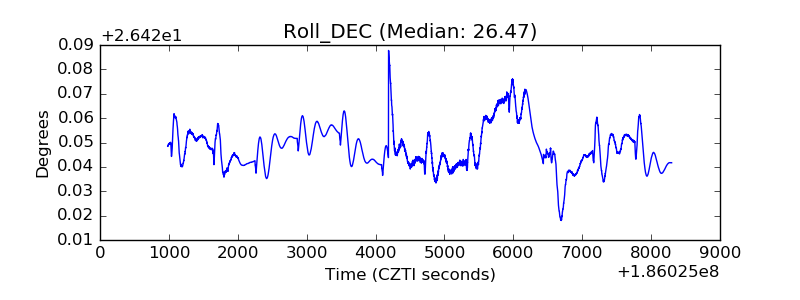 |
| _Roll_RA | 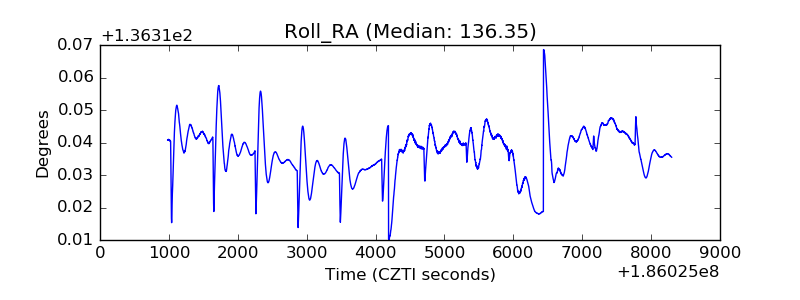 |
| Veto Counter | 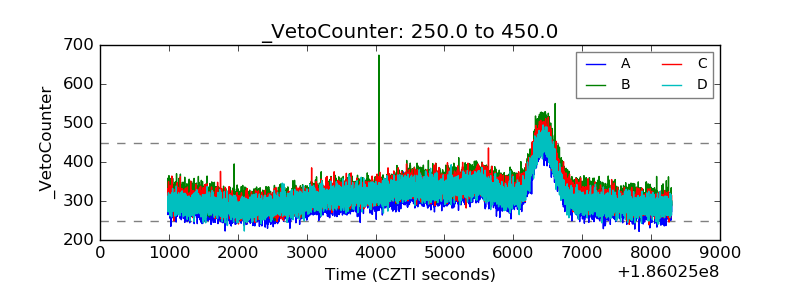 |