| Param | Original file | Final file |
|---|---|---|
| Filename | modeM0/AS1P01_156T01_9000000118cztM0_level2.fits | modeM0/AS1P01_156T01_9000000118cztM0_level2_quad_clean.evt |
| Size (bytes) | 309,015,360 | 362,632,320 |
| Size | 294.7 MB | 345.8 MB |
| Events in quadrant A | 1,787,568 | 2,214,119 |
| Events in quadrant B | 1,765,820 | 2,202,965 |
| Events in quadrant C | 1,779,086 | 2,131,333 |
| Events in quadrant D | 1,532,634 | 1,941,233 |
| Mode SS | |||
|---|---|---|---|
| Quadrant | BADHDUFLAG | Total packets | Discarded packets |
| A | 0 | 738 | 0 |
| B | 0 | 738 | 0 |
| C | 0 | 738 | 0 |
| D | 0 | 738 | 0 |
| Mode M9 | |||
|---|---|---|---|
| Quadrant | BADHDUFLAG | Total packets | Discarded packets |
| A | 0 | 52 | 0 |
| B | 0 | 52 | 0 |
| C | 0 | 52 | 0 |
| D | 0 | 52 | 0 |
| Mode M0 | |||
|---|---|---|---|
| Quadrant | BADHDUFLAG | Total packets | Discarded packets |
| A | 0 | 156650 | 0 |
| B | 0 | 167480 | 0 |
| C | 0 | 154407 | 0 |
| D | 0 | 150880 | 0 |
| Quadrant | Total seconds | Saturated seconds | Saturation percentage |
|---|---|---|---|
| A | 36296 | 345 | 0.950518% |
| B | 36296 | 573 | 1.578686% |
| C | 36296 | 320 | 0.881640% |
| D | 36296 | 495 | 1.363787% |
Noise dominated data is calculated using 1-second bins in cleaned event files. If a bin has >2000 counts, and if more than 50% of those come from <1% of pixels, then it is considered to be noise-dominated and hence unusable.
| Quadrant | # 1 sec bins | Bins with >0 counts | Bins with >2000 counts | High rate bins dominated by noise | Noise dominated (total time) | Noise dominated (detector-on time) | Marked lightcurve |
|---|---|---|---|---|---|---|---|
| A | 40475 | 36289 | 0 | 0 | 0.00% | 0.00% |  |
| B | 40475 | 36292 | 0 | 0 | 0.00% | 0.00% |  |
| C | 40475 | 36290 | 0 | 0 | 0.00% | 0.00% |  |
| D | 40475 | 36290 | 0 | 0 | 0.00% | 0.00% |  |
Top three noisy pixels from each quadrant. If the there are fewer than three noisy pixels in the level2.evt file, extra rows are filled as -1
| Pixel properties | Quadrant properties | ||||||
|---|---|---|---|---|---|---|---|
| Quadrant | DetID | PixID | Counts | Sigma | Mean | Median | Sigma |
| A | 7 | 110 | 1674 | 11.28 | 462 | 431 | 110.1 |
| A | 0 | 29 | 1573 | 10.36 | 462 | 431 | 110.1 |
| A | 14 | 188 | 1353 | 8.37 | 462 | 431 | 110.1 |
| B | 2 | 9 | 1429 | 11.09 | 466 | 440 | 89.1 |
| B | 14 | 254 | 1188 | 8.39 | 466 | 440 | 89.1 |
| B | 5 | 225 | 1125 | 7.68 | 466 | 440 | 89.1 |
| C | 2 | 191 | 1180 | 6.36 | 469 | 431 | 117.8 |
| C | 12 | 241 | 1163 | 6.21 | 469 | 431 | 117.8 |
| C | 1 | 81 | 1148 | 6.08 | 469 | 431 | 117.8 |
| D | 1 | 19 | 1220 | 7.89 | 436 | 399 | 104.1 |
| D | 1 | 3 | 1117 | 6.9 | 436 | 399 | 104.1 |
| D | 6 | 231 | 1085 | 6.59 | 436 | 399 | 104.1 |
Histogram calculated using DETX and DETY for each event in the final _common_clean file
| Quadrant A | 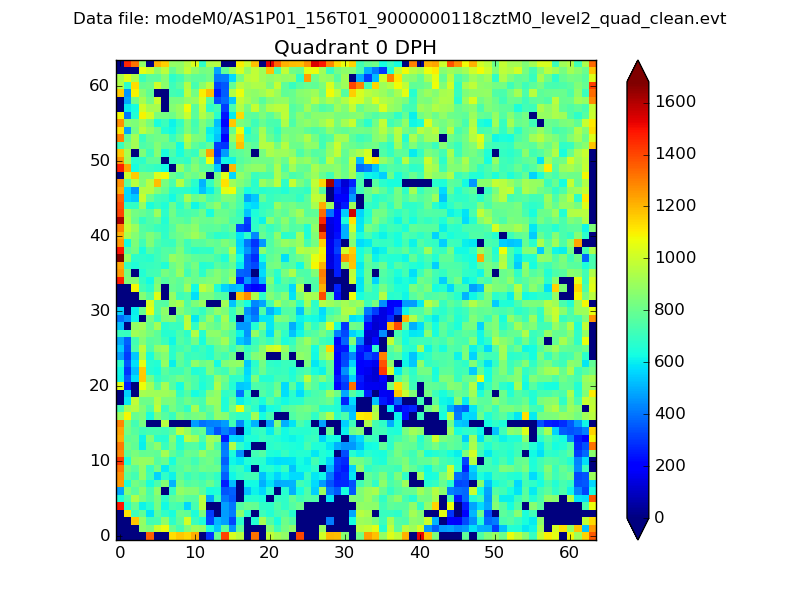 |
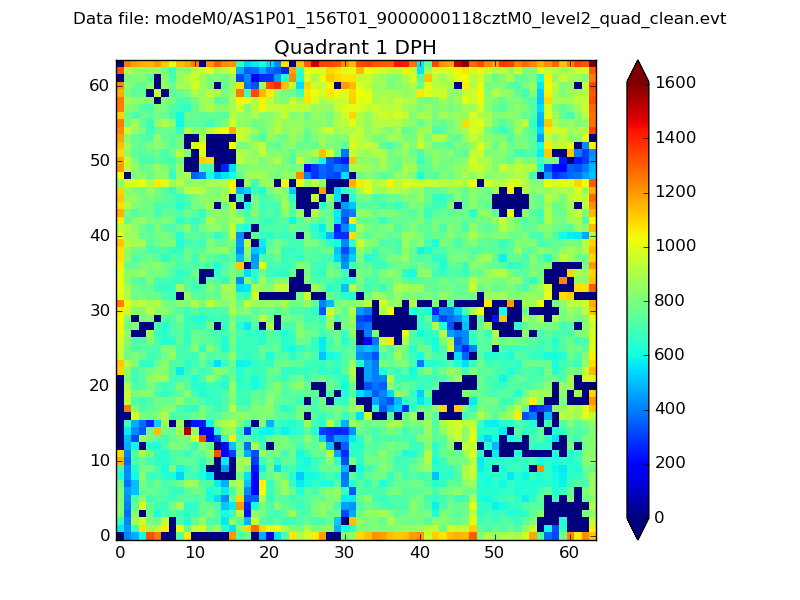 |
Quadrant B |
|---|---|---|---|
| Quadrant D |  |
 |
Quadrant C |
| Plot type | Count rate plots | Images |
|---|---|---|
| Comparison with Poisson distribution Blue bars denote a histogram of data divided into 1 sec bins. Red curve is a Poisson curve with rate = median count rate of data. |
 |
 |
| Quadrant-wise count rates Data is divided into 100 sec bins |
 |
|
| Module-wise count rates for Quadrant A Data is divided into 100 sec bins |
 |
 |
| Module-wise count rates for Quadrant B Data is divided into 100 sec bins |
 |
 |
| Module-wise count rates for Quadrant C Data is divided into 100 sec bins |
 |
 |
| Module-wise count rates for Quadrant D Data is divided into 100 sec bins |
 |
 |
| Parameter | Plot |
|---|---|
| CZT HV Monitor | 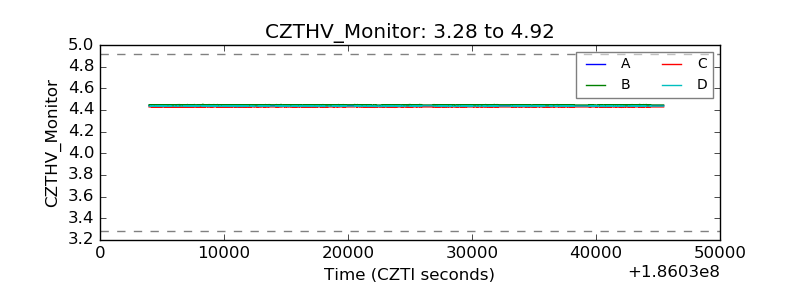 |
| D_VDD | 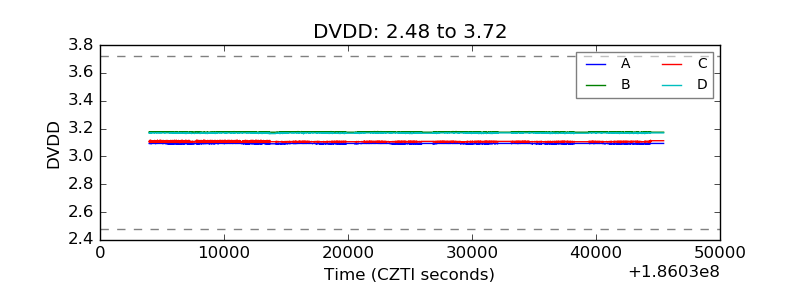 |
| Temperature 1 |  |
| Veto HV Monitor |  |
| Veto LLD | 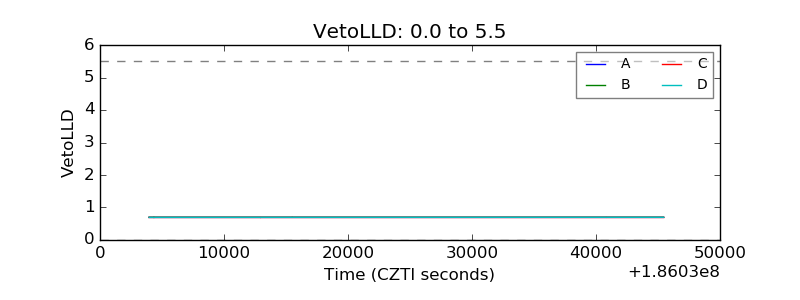 |
| Alpha Counter |  |
| _CPM_Rate | 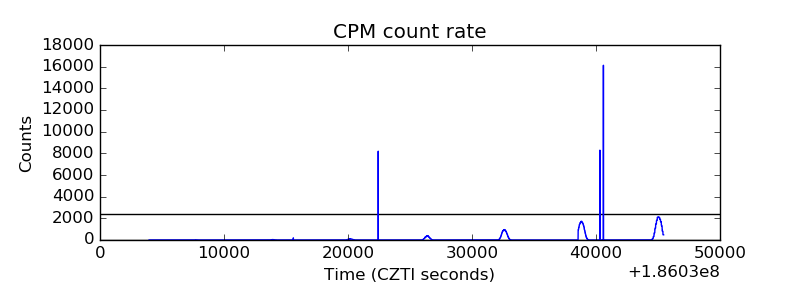 |
| CZT Counter |  |
| +2.5 Volts monitor |  |
| +5 Volts monitor |  |
| _ROLL_ROT | 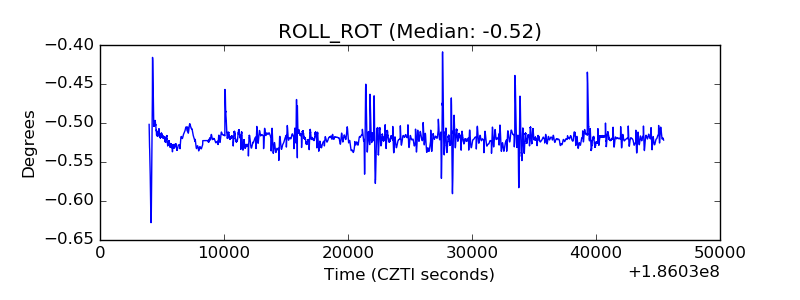 |
| _Roll_DEC |  |
| _Roll_RA |  |
| Veto Counter |  |