| Param | Original file | Final file |
|---|---|---|
| Filename | modeM0/AS1P01_156T01_9000000118_00846cztM0_level2.evt | modeM0/AS1P01_156T01_9000000118_00846cztM0_level2_quad_clean.evt |
| Size (bytes) | 1,089,748,800 | 65,761,920 |
| Size | 1.0 GB | 62.7 MB |
| Events in quadrant A | 7,817,108 | 393,117 |
| Events in quadrant B | 8,715,369 | 385,674 |
| Events in quadrant C | 7,607,958 | 389,586 |
| Events in quadrant D | 8,436,331 | 373,268 |
| Mode SS | |||
|---|---|---|---|
| Quadrant | BADHDUFLAG | Total packets | Discarded packets |
| A | 0 | 130 | 0 |
| B | 0 | 130 | 0 |
| C | 0 | 130 | 0 |
| D | 0 | 130 | 0 |
| Mode M9 | |||
|---|---|---|---|
| Quadrant | BADHDUFLAG | Total packets | Discarded packets |
| A | 0 | 5 | 0 |
| B | 0 | 5 | 0 |
| C | 0 | 5 | 0 |
| D | 0 | 5 | 0 |
| Mode M0 | |||
|---|---|---|---|
| Quadrant | BADHDUFLAG | Total packets | Discarded packets |
| A | 0 | 27792 | 0 |
| B | 0 | 30495 | 0 |
| C | 0 | 27160 | 0 |
| D | 0 | 29616 | 0 |
| Quadrant | Total seconds | Saturated seconds | Saturation percentage |
|---|---|---|---|
| A | 6441 | 38 | 0.589971% |
| B | 6441 | 199 | 3.089582% |
| C | 6441 | 34 | 0.527868% |
| D | 6441 | 169 | 2.623816% |
Noise dominated data is calculated using 1-second bins in cleaned event files. If a bin has >2000 counts, and if more than 50% of those come from <1% of pixels, then it is considered to be noise-dominated and hence unusable.
| Quadrant | # 1 sec bins | Bins with >0 counts | Bins with >2000 counts | High rate bins dominated by noise | Noise dominated (total time) | Noise dominated (detector-on time) | Marked lightcurve |
|---|---|---|---|---|---|---|---|
| A | 6881 | 6442 | 215 | 215 | 3.12% | 3.34% | 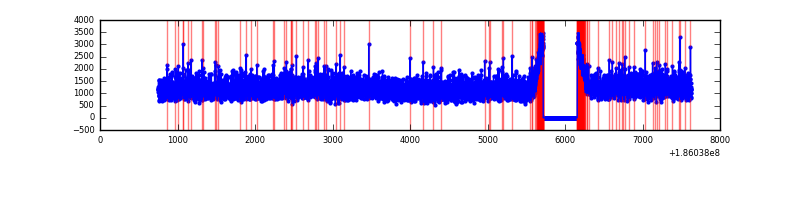 |
| B | 6881 | 6442 | 503 | 503 | 7.31% | 7.81% | 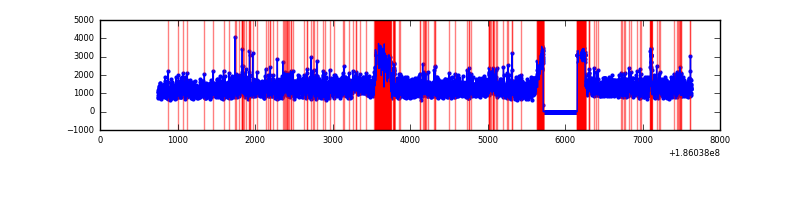 |
| C | 6881 | 6442 | 177 | 177 | 2.57% | 2.75% | 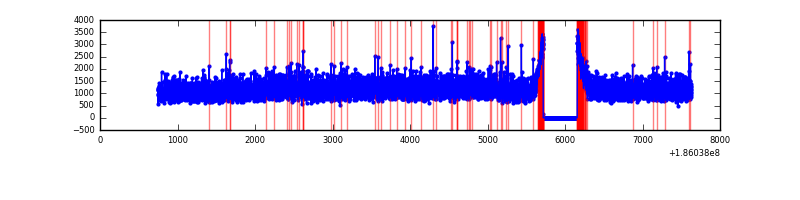 |
| D | 6881 | 6442 | 750 | 750 | 10.90% | 11.64% | 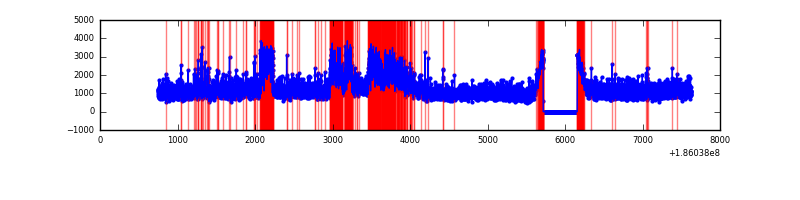 |
Top three noisy pixels from each quadrant. If the there are fewer than three noisy pixels in the level2.evt file, extra rows are filled as -1
| Pixel properties | Quadrant properties | ||||||
|---|---|---|---|---|---|---|---|
| Quadrant | DetID | PixID | Counts | Sigma | Mean | Median | Sigma |
| A | 11 | 79 | 7213 | 10.43 | 2033 | 2049 | 494.9 |
| A | 7 | 16 | 6738 | 9.47 | 2033 | 2049 | 494.9 |
| A | 3 | 111 | 6352 | 8.69 | 2033 | 2049 | 494.9 |
| B | 8 | 234 | 312039 | 629.96 | 2079 | 2093 | 492.0 |
| B | 5 | 65 | 200354 | 402.96 | 2079 | 2093 | 492.0 |
| B | 0 | 220 | 65727 | 129.33 | 2079 | 2093 | 492.0 |
| C | 5 | 234 | 39916 | 70.77 | 1915 | 1988 | 535.9 |
| C | 15 | 241 | 29866 | 52.02 | 1915 | 1988 | 535.9 |
| C | 3 | 111 | 27619 | 47.82 | 1915 | 1988 | 535.9 |
| D | 7 | 207 | 1270874 | 2172.59 | 1868 | 1935 | 584.1 |
| D | 1 | 4 | 88304 | 147.88 | 1868 | 1935 | 584.1 |
| D | 13 | 200 | 77804 | 129.9 | 1868 | 1935 | 584.1 |
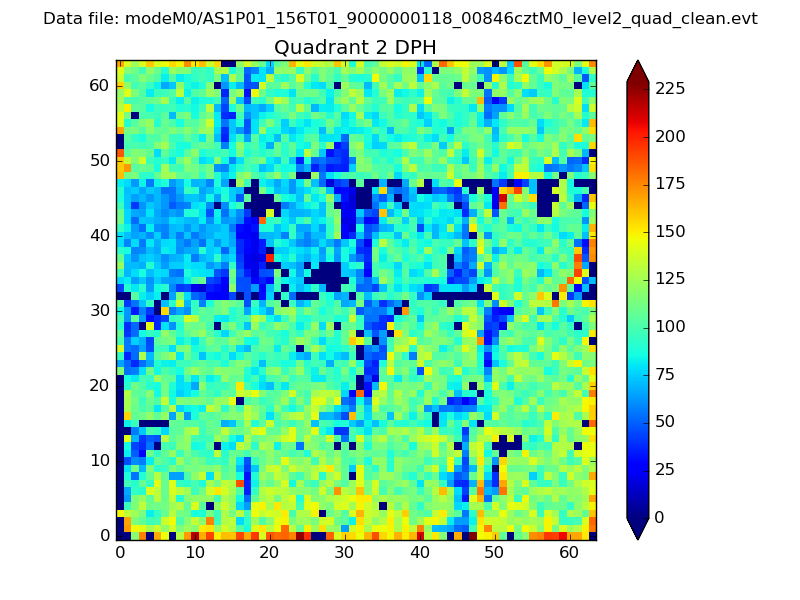
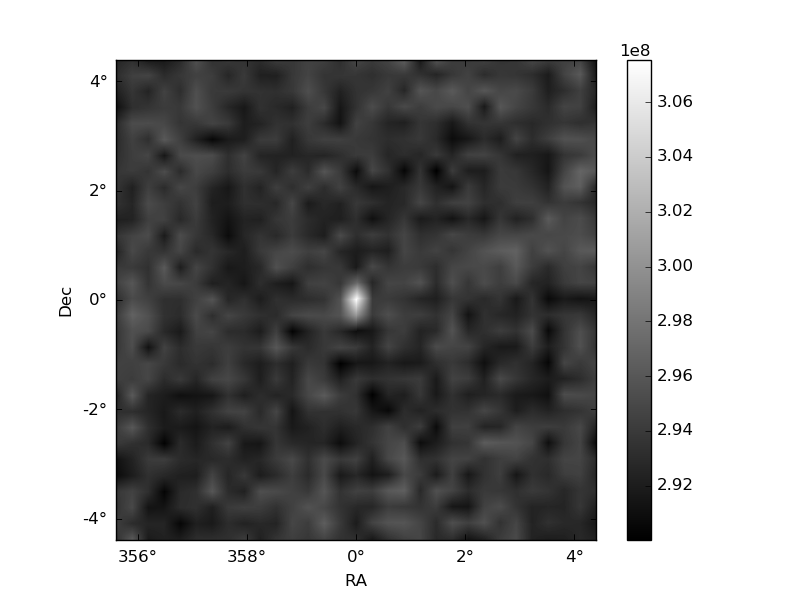
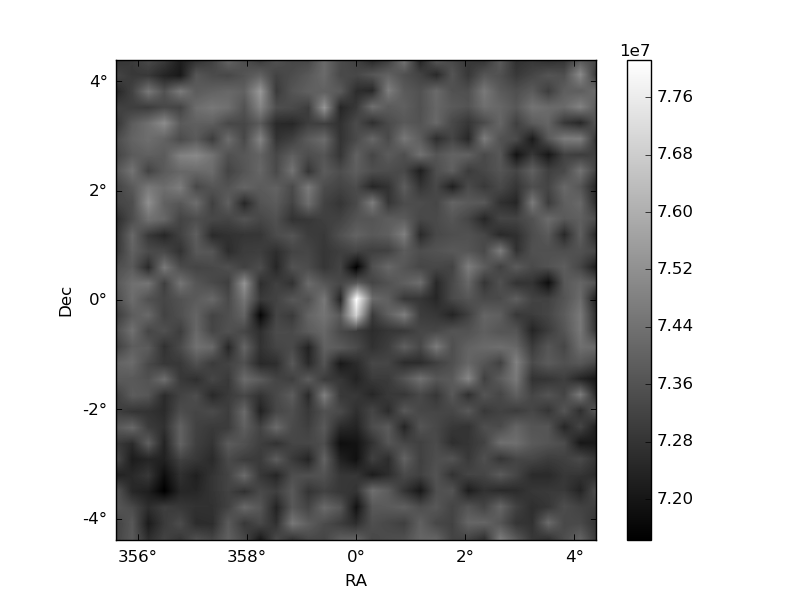
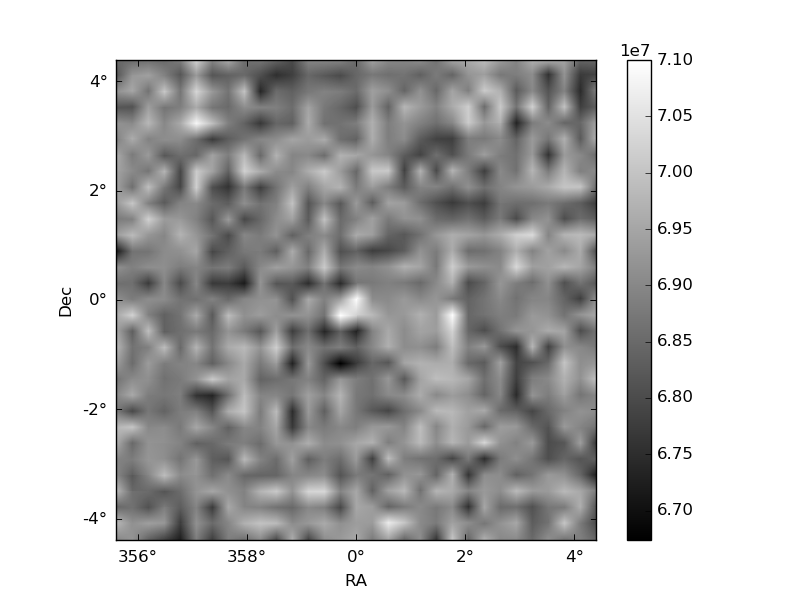
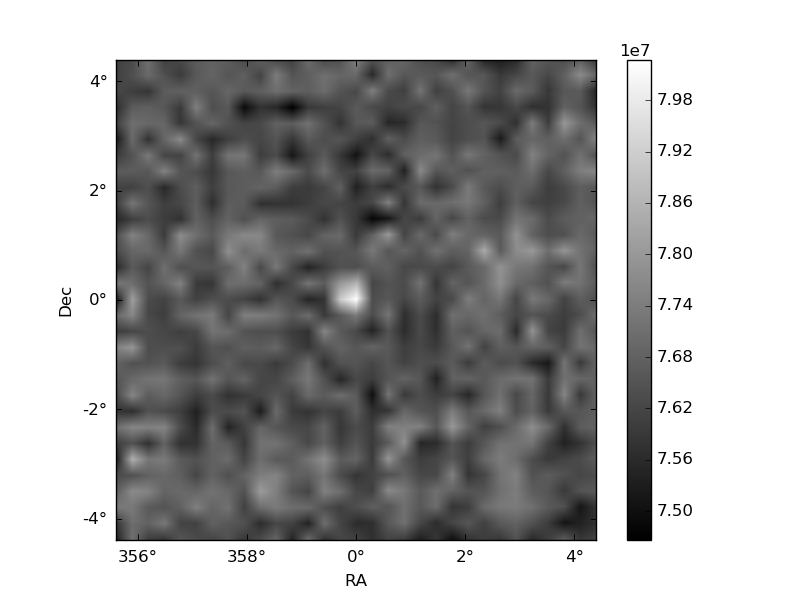
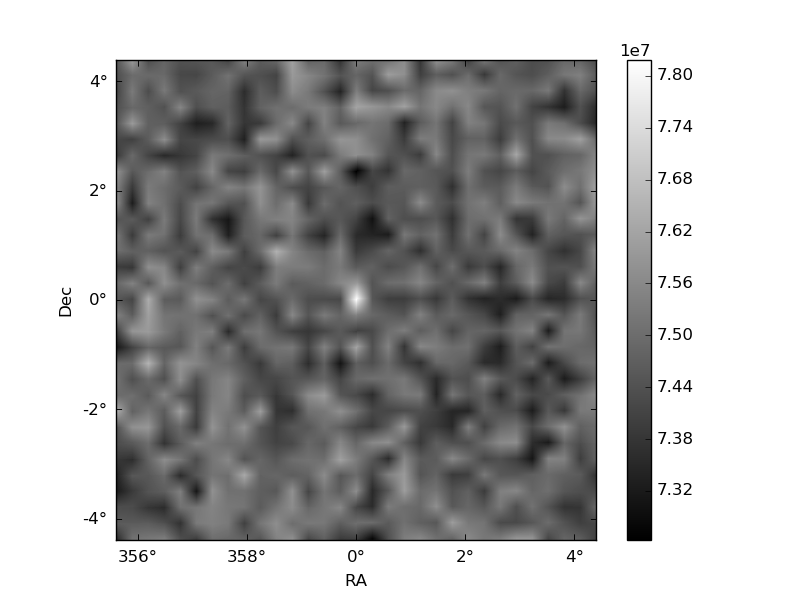
Histogram calculated using DETX and DETY for each event in the final _common_clean file
| Quadrant A | 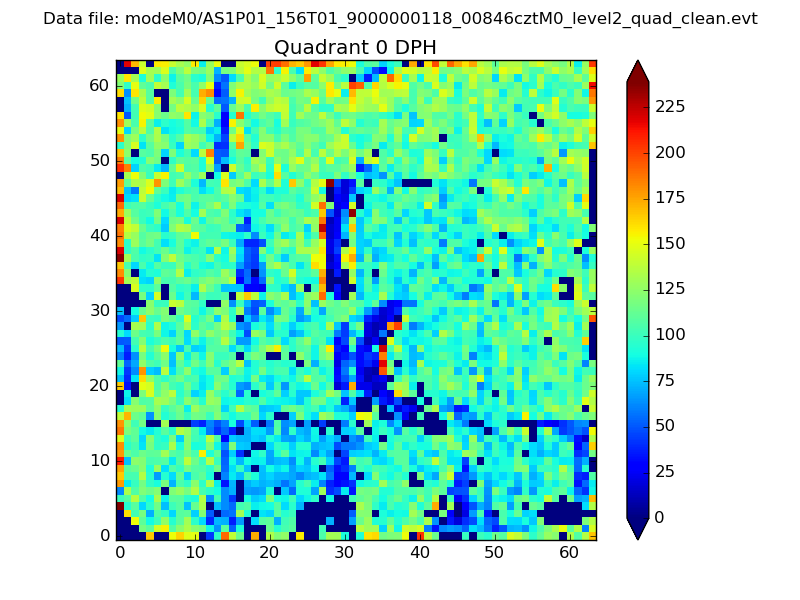 |
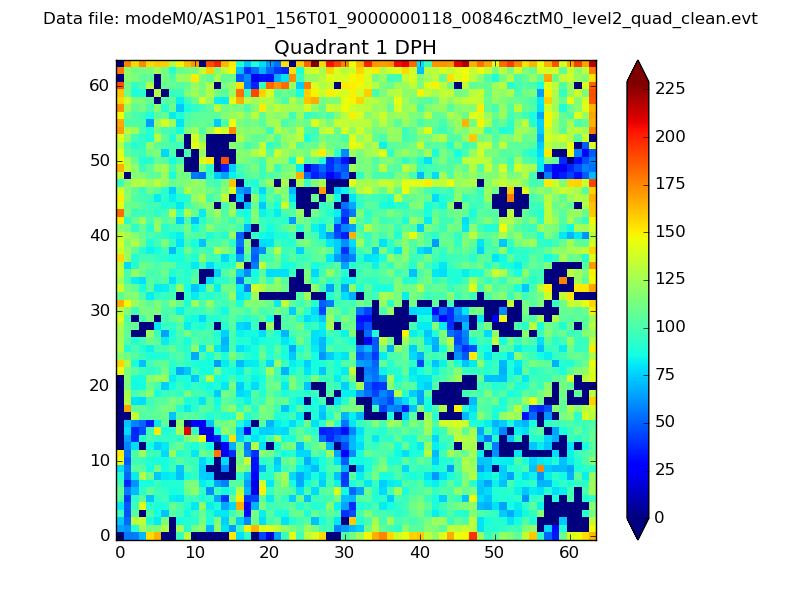 |
Quadrant B |
|---|---|---|---|
| Quadrant D | 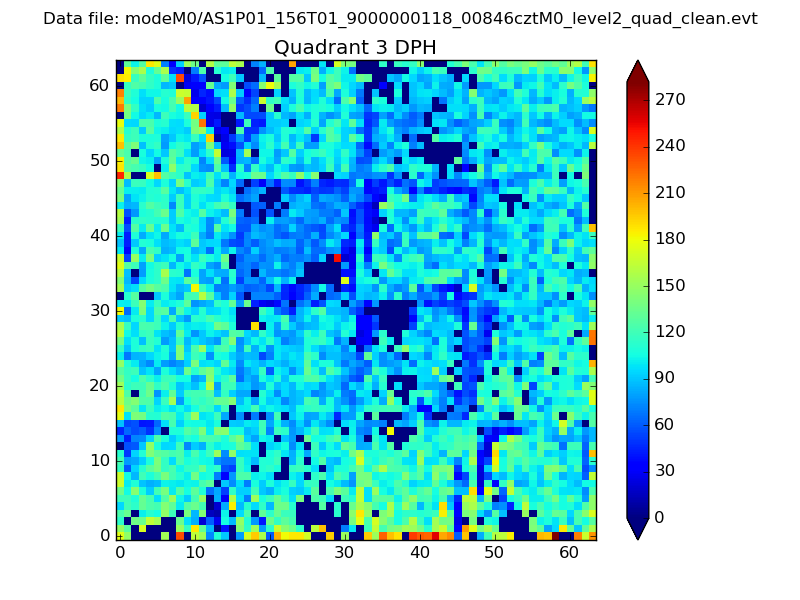 |
 |
Quadrant C |
| Plot type | Count rate plots | Images |
|---|---|---|
| Comparison with Poisson distribution Blue bars denote a histogram of data divided into 1 sec bins. Red curve is a Poisson curve with rate = median count rate of data. |
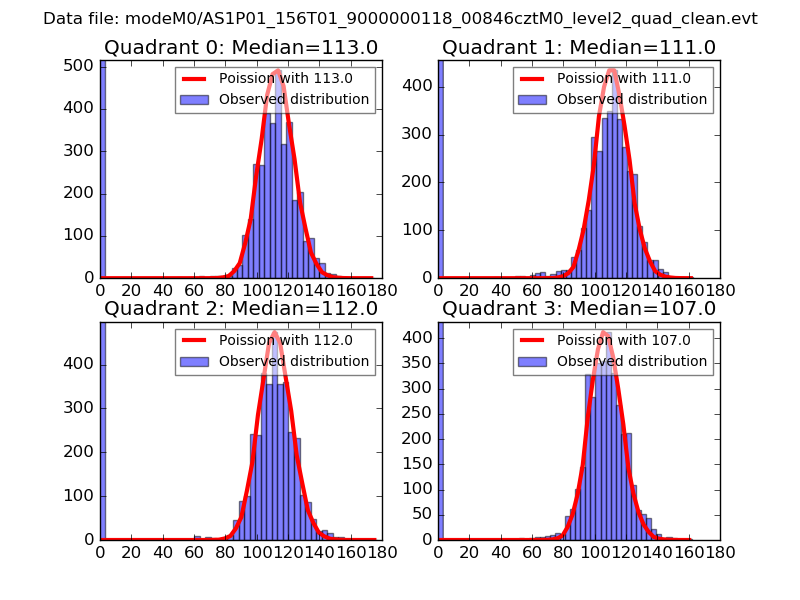 |
 |
| Quadrant-wise count rates Data is divided into 100 sec bins |
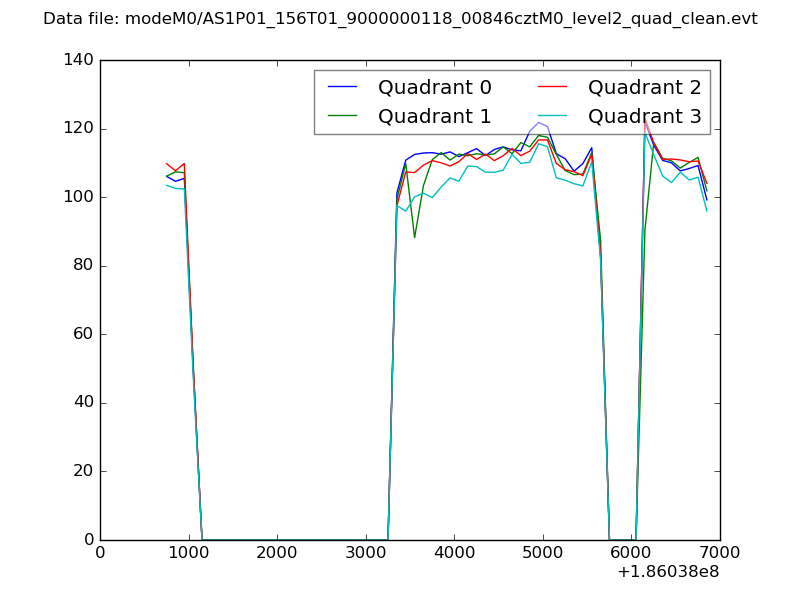 |
|
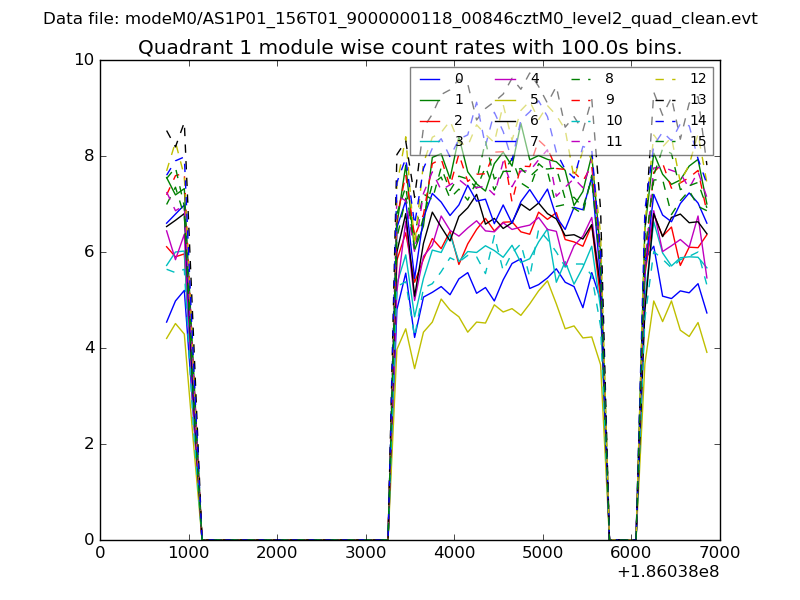
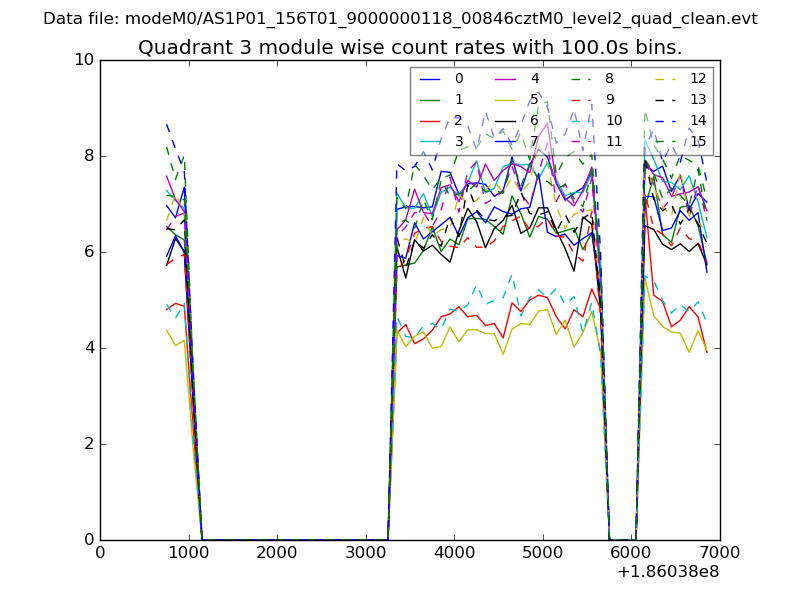
| Module-wise count rates for Quadrant A Data is divided into 100 sec bins |
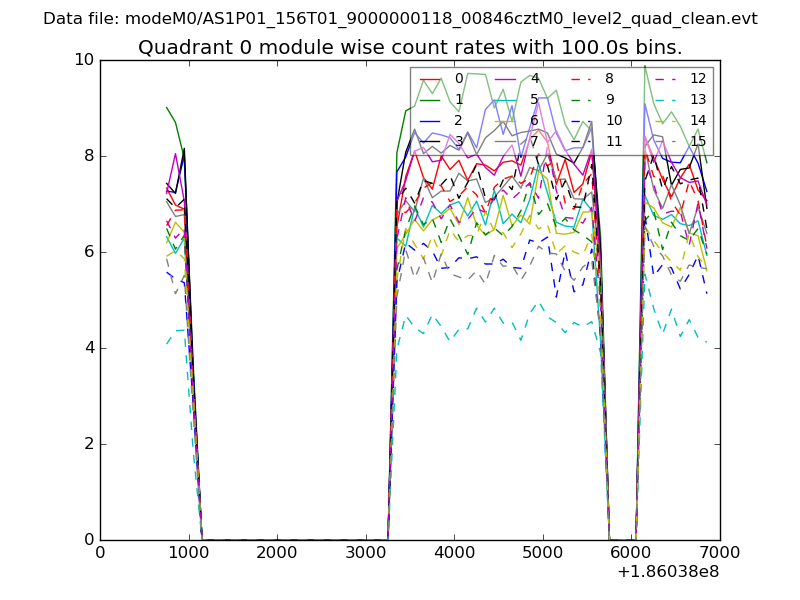 |
 |
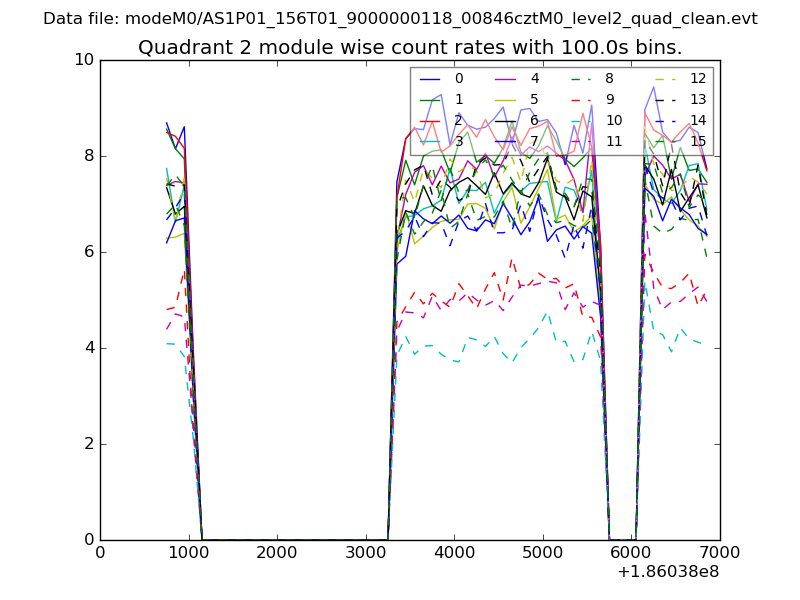
| Module-wise count rates for Quadrant B Data is divided into 100 sec bins |
 |
 |
| Module-wise count rates for Quadrant C Data is divided into 100 sec bins |
 |
 |
| Module-wise count rates for Quadrant D Data is divided into 100 sec bins |
 |
 |
| Parameter | Plot |
|---|---|
| CZT HV Monitor | 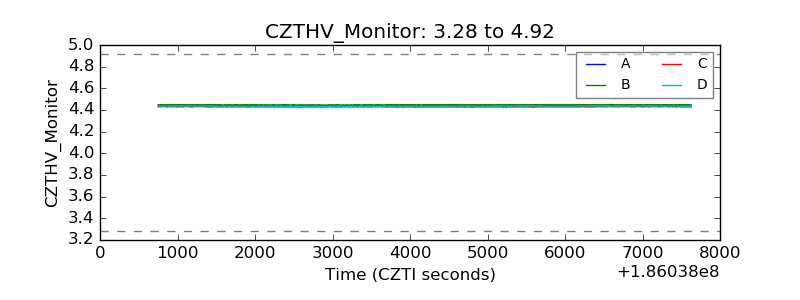 |
| D_VDD | 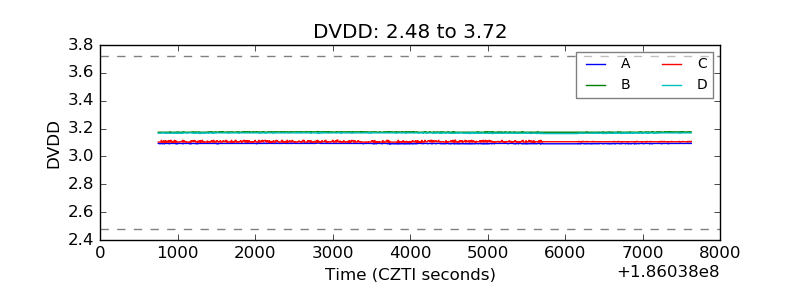 |
| Temperature 1 | 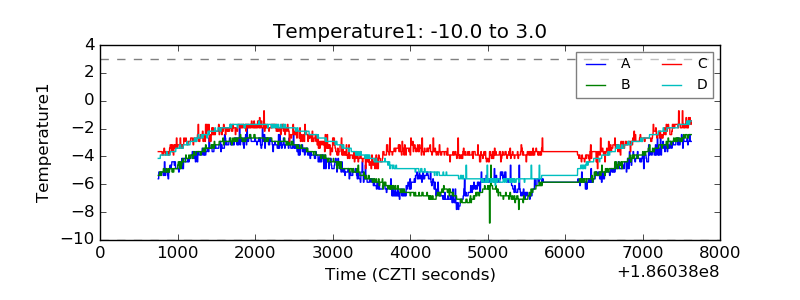 |
| Veto HV Monitor | 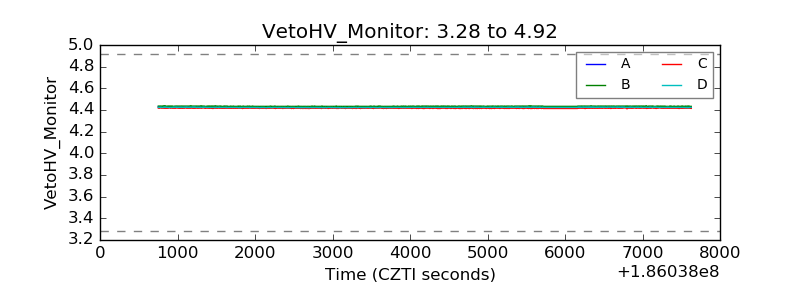 |
| Veto LLD | 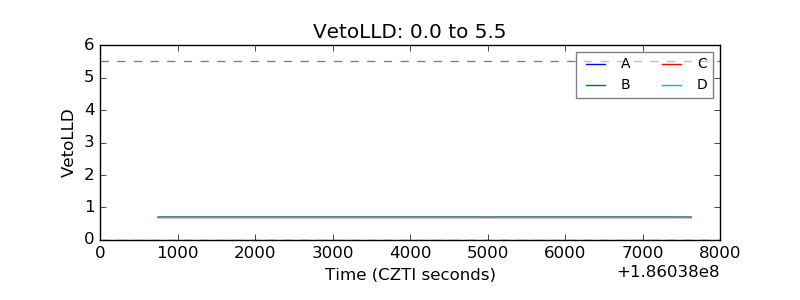 |
| Alpha Counter | 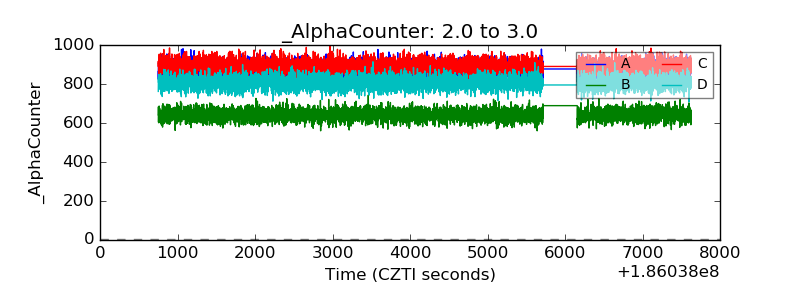 |
| _CPM_Rate | 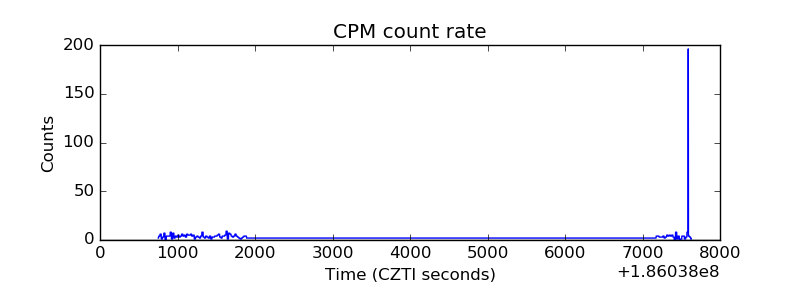 |
| CZT Counter | 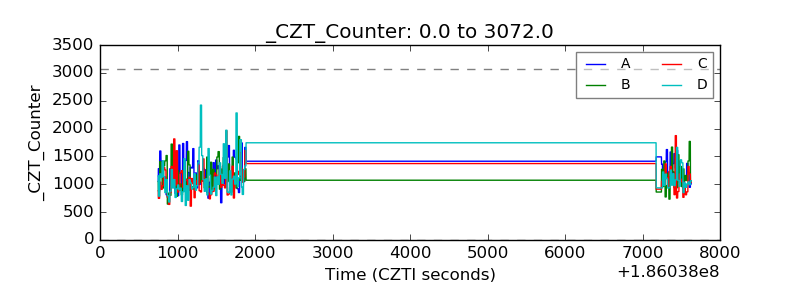 |
| +2.5 Volts monitor |  |
| +5 Volts monitor |  |
| _ROLL_ROT | 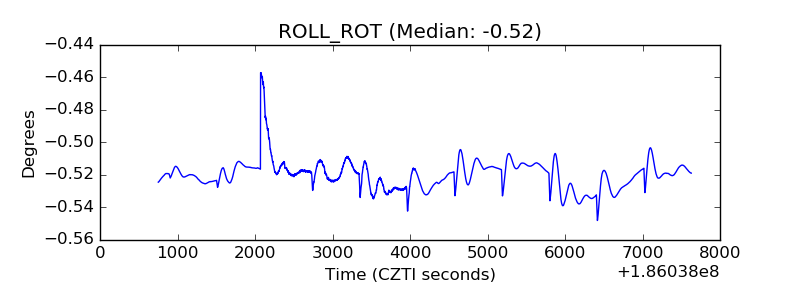 |
| _Roll_DEC | 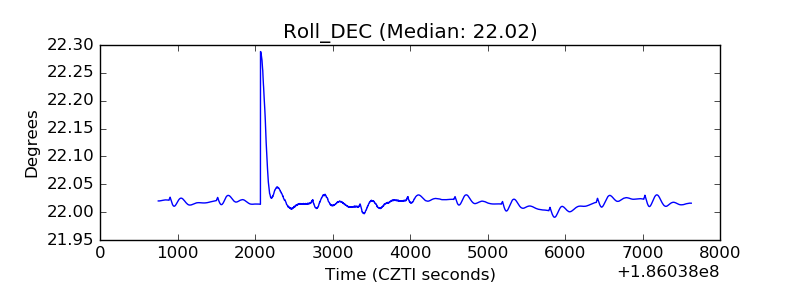 |
| _Roll_RA | 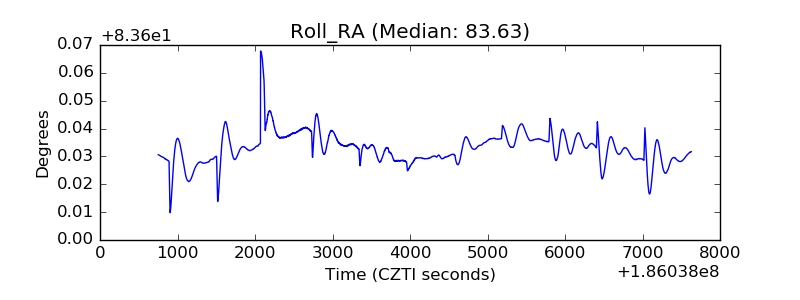 |
| Veto Counter | 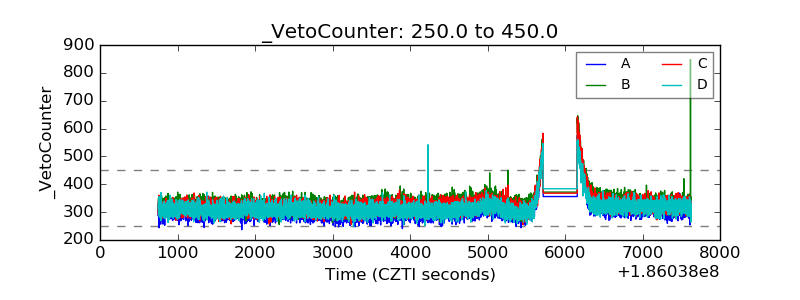 |