| Param | Original file | Final file |
|---|---|---|
| Filename | modeM0/AS1P01_156T01_9000000118_00848cztM0_level2.evt | modeM0/AS1P01_156T01_9000000118_00848cztM0_level2_quad_clean.evt |
| Size (bytes) | 1,140,563,520 | 62,496,000 |
| Size | 1.1 GB | 59.6 MB |
| Events in quadrant A | 8,574,601 | 356,711 |
| Events in quadrant B | 9,066,149 | 354,789 |
| Events in quadrant C | 8,329,028 | 354,144 |
| Events in quadrant D | 8,113,828 | 343,780 |
| Mode SS | |||
|---|---|---|---|
| Quadrant | BADHDUFLAG | Total packets | Discarded packets |
| A | 0 | 142 | 0 |
| B | 0 | 142 | 0 |
| C | 0 | 142 | 0 |
| D | 0 | 142 | 0 |
| Mode M9 | |||
|---|---|---|---|
| Quadrant | BADHDUFLAG | Total packets | Discarded packets |
| A | 0 | 10 | 0 |
| B | 0 | 10 | 0 |
| C | 0 | 10 | 0 |
| D | 0 | 10 | 0 |
| Mode M0 | |||
|---|---|---|---|
| Quadrant | BADHDUFLAG | Total packets | Discarded packets |
| A | 0 | 30347 | 0 |
| B | 0 | 31858 | 0 |
| C | 0 | 29640 | 0 |
| D | 0 | 28997 | 0 |
| Quadrant | Total seconds | Saturated seconds | Saturation percentage |
|---|---|---|---|
| A | 6922 | 25 | 0.361167% |
| B | 6922 | 43 | 0.621208% |
| C | 6922 | 33 | 0.476741% |
| D | 6921 | 88 | 1.271493% |
Noise dominated data is calculated using 1-second bins in cleaned event files. If a bin has >2000 counts, and if more than 50% of those come from <1% of pixels, then it is considered to be noise-dominated and hence unusable.
| Quadrant | # 1 sec bins | Bins with >0 counts | Bins with >2000 counts | High rate bins dominated by noise | Noise dominated (total time) | Noise dominated (detector-on time) | Marked lightcurve |
|---|---|---|---|---|---|---|---|
| A | 7797 | 6922 | 231 | 231 | 2.96% | 3.34% | 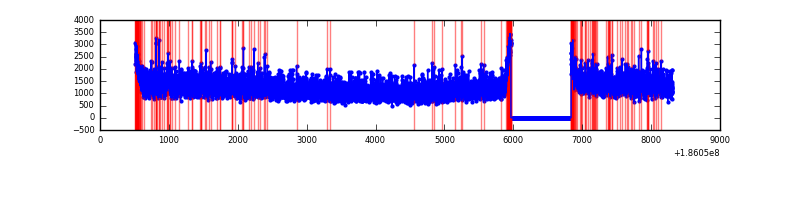 |
| B | 7797 | 6922 | 325 | 325 | 4.17% | 4.70% | 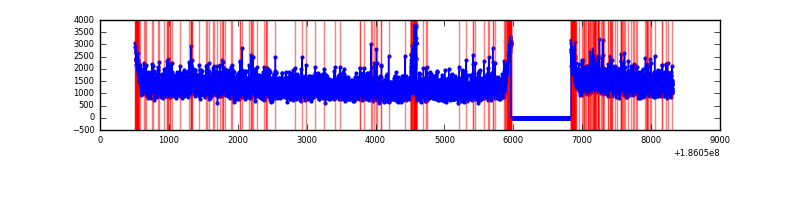 |
| C | 7797 | 6922 | 187 | 187 | 2.40% | 2.70% | 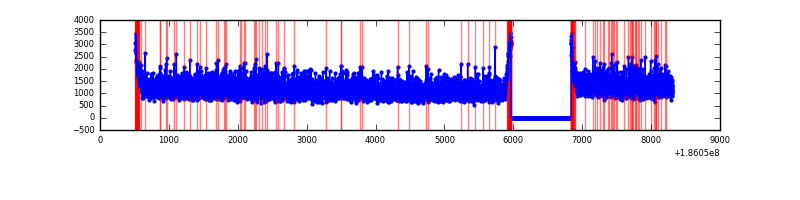 |
| D | 7796 | 6921 | 300 | 300 | 3.85% | 4.33% | 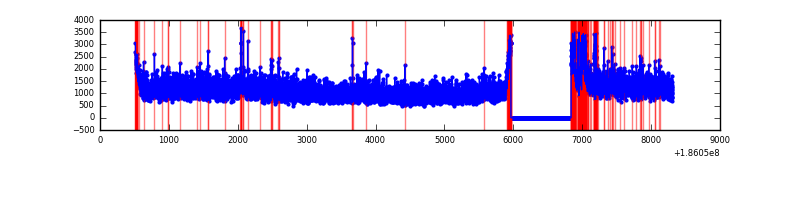 |
Top three noisy pixels from each quadrant. If the there are fewer than three noisy pixels in the level2.evt file, extra rows are filled as -1
| Pixel properties | Quadrant properties | ||||||
|---|---|---|---|---|---|---|---|
| Quadrant | DetID | PixID | Counts | Sigma | Mean | Median | Sigma |
| A | 15 | 171 | 41162 | 72.4 | 2218 | 2241 | 537.6 |
| A | 15 | 17 | 26930 | 45.93 | 2218 | 2241 | 537.6 |
| A | 11 | 79 | 8052 | 10.81 | 2218 | 2241 | 537.6 |
| B | 5 | 200 | 115730 | 209.58 | 2292 | 2303 | 541.2 |
| B | 2 | 2 | 52620 | 92.97 | 2292 | 2303 | 541.2 |
| B | 5 | 249 | 35286 | 60.94 | 2292 | 2303 | 541.2 |
| C | 15 | 241 | 43576 | 70.63 | 2099 | 2181 | 586.1 |
| C | 3 | 111 | 27331 | 42.91 | 2099 | 2181 | 586.1 |
| C | 7 | 159 | 17696 | 26.47 | 2099 | 2181 | 586.1 |
| D | 10 | 85 | 278222 | 433.26 | 2056 | 2137 | 637.2 |
| D | 1 | 4 | 64830 | 98.38 | 2056 | 2137 | 637.2 |
| D | 13 | 169 | 45399 | 67.89 | 2056 | 2137 | 637.2 |
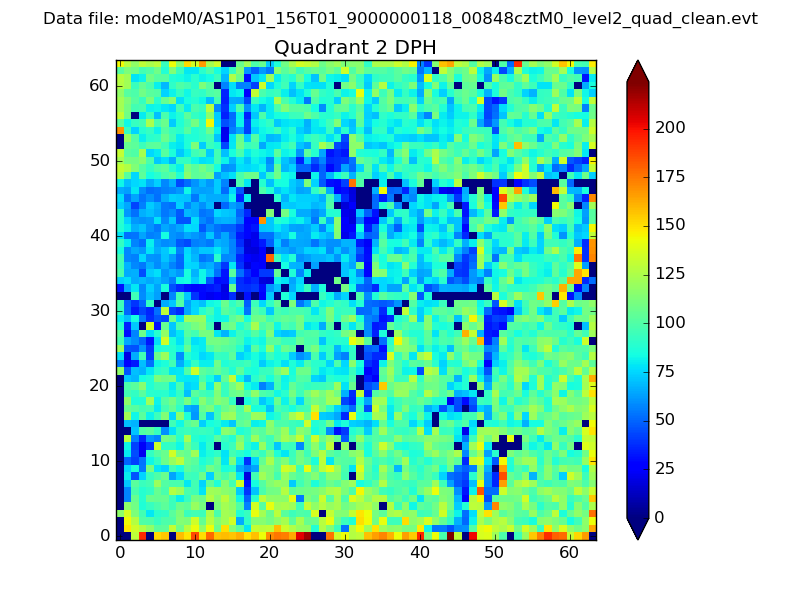
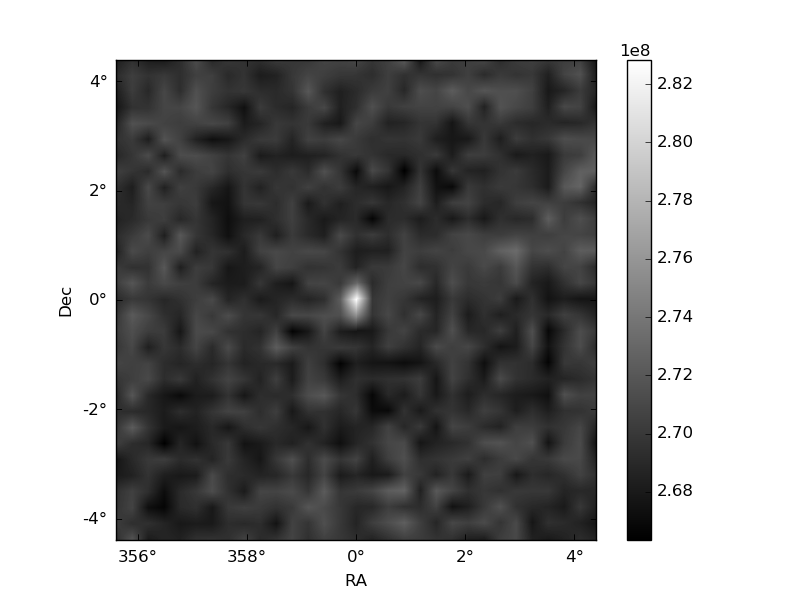
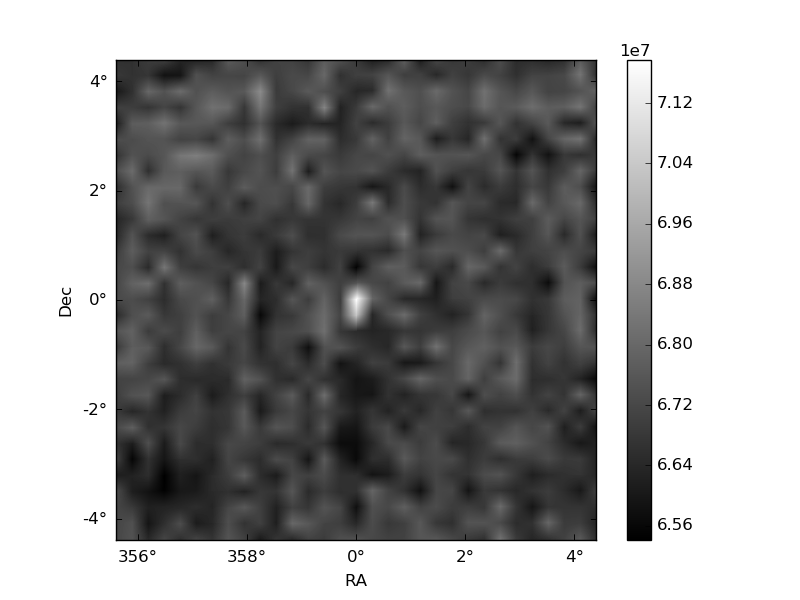
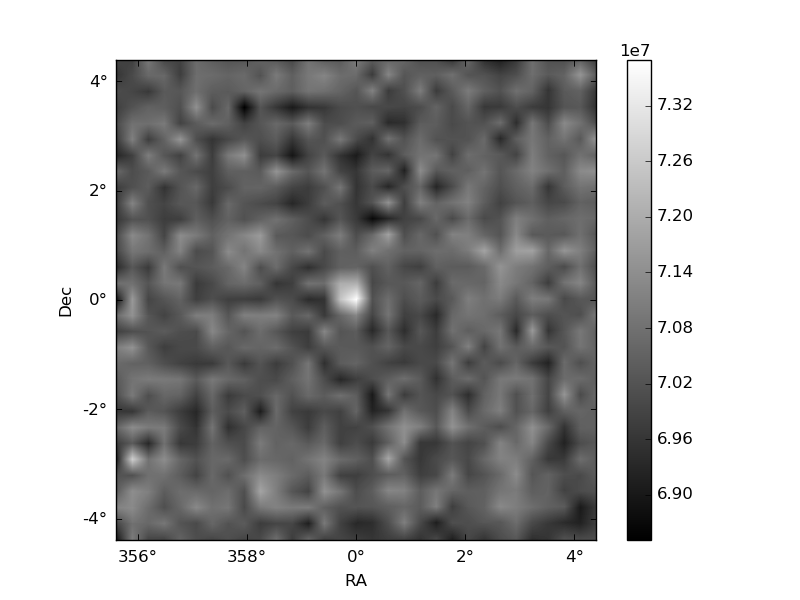
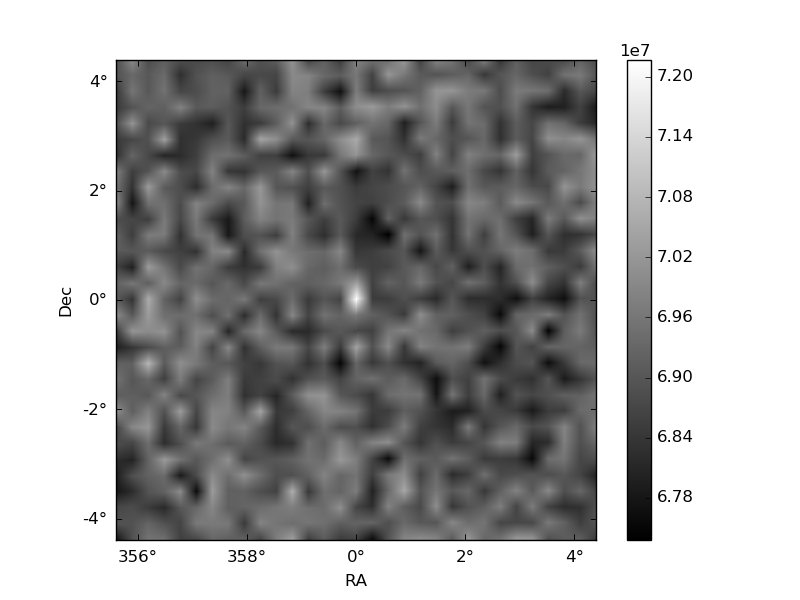
Histogram calculated using DETX and DETY for each event in the final _common_clean file
| Quadrant A | 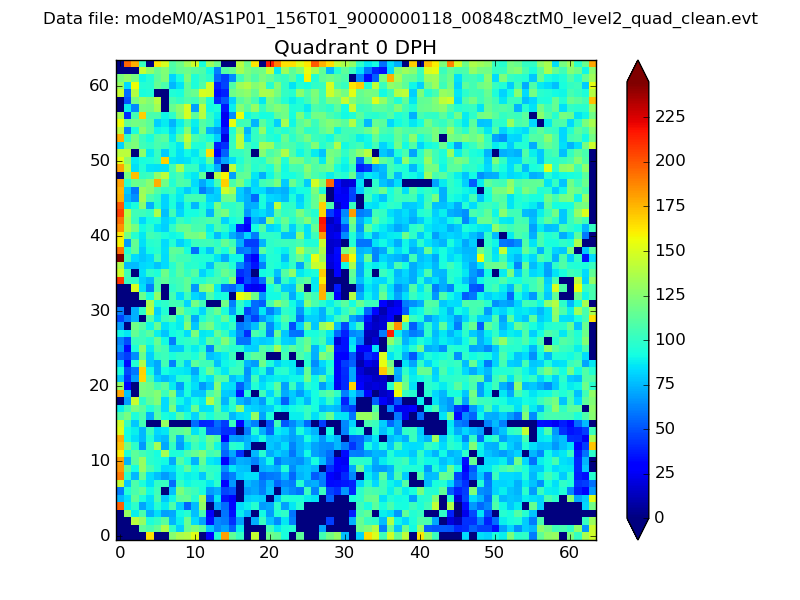 |
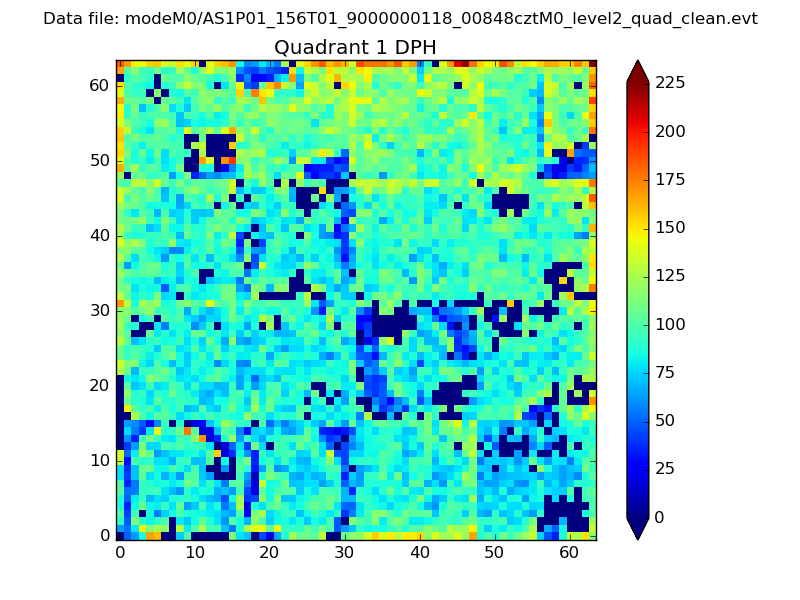 |
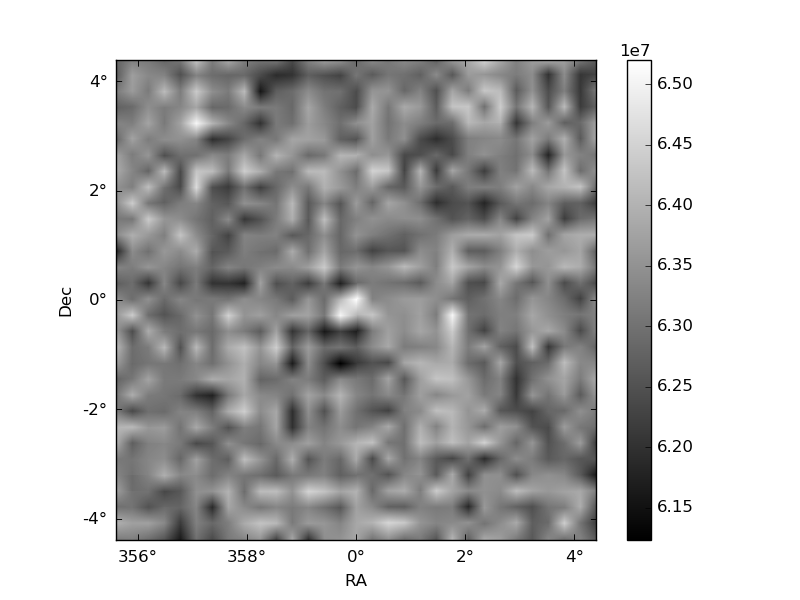
Quadrant B |
|---|---|---|---|
| Quadrant D | 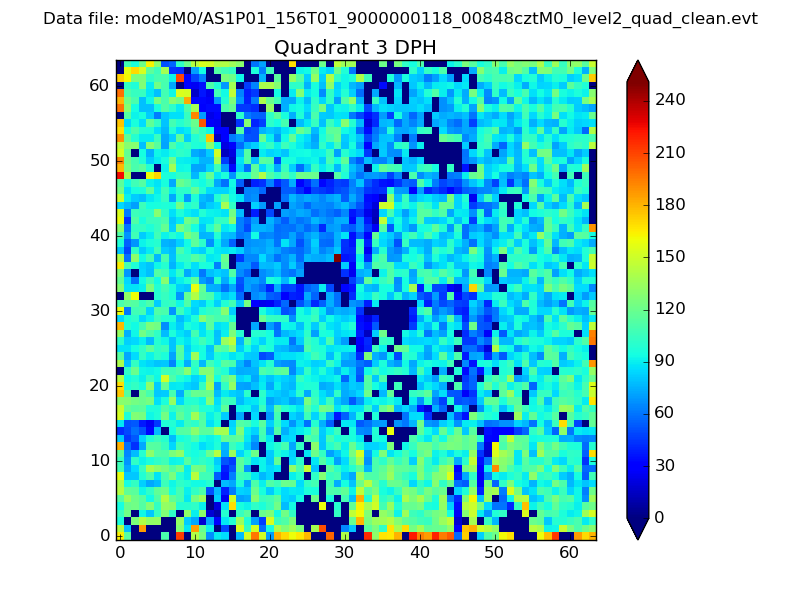 |
 |
Quadrant C |
| Plot type | Count rate plots | Images |
|---|---|---|
| Comparison with Poisson distribution Blue bars denote a histogram of data divided into 1 sec bins. Red curve is a Poisson curve with rate = median count rate of data. |
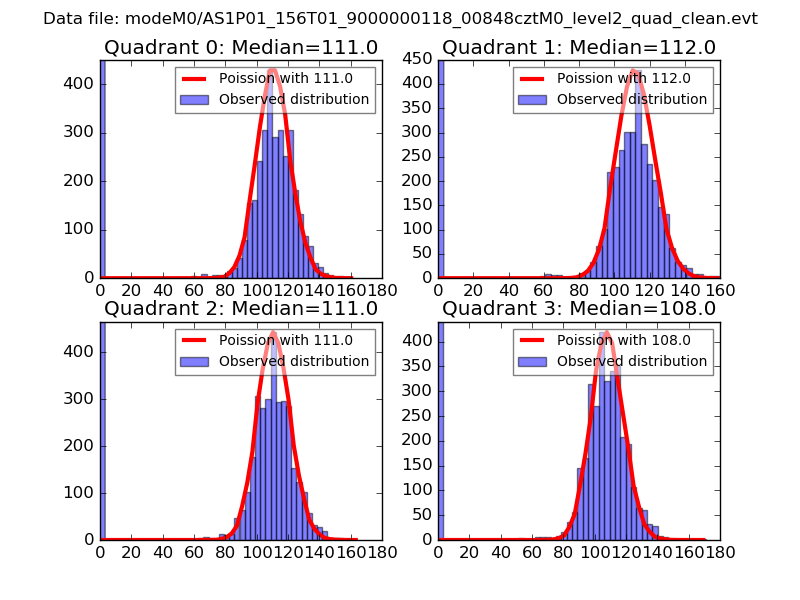 |
 |
| Quadrant-wise count rates Data is divided into 100 sec bins |
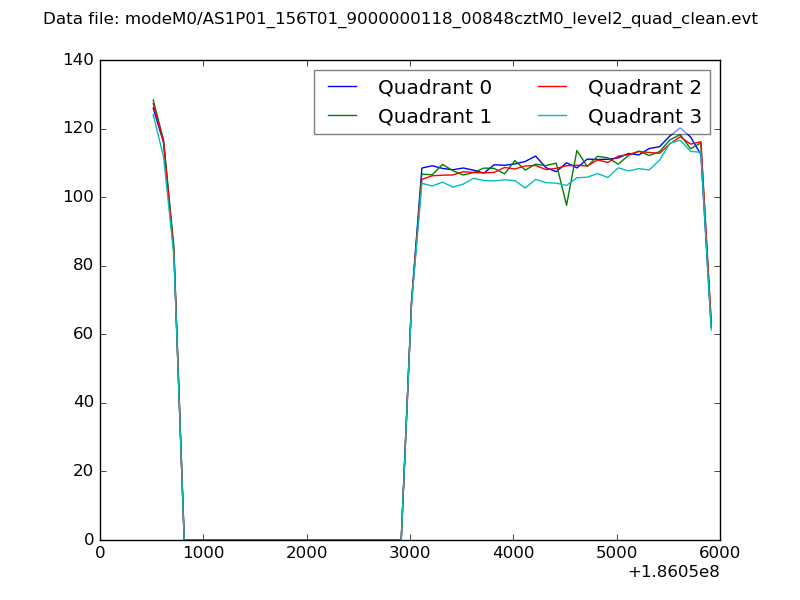 |
|
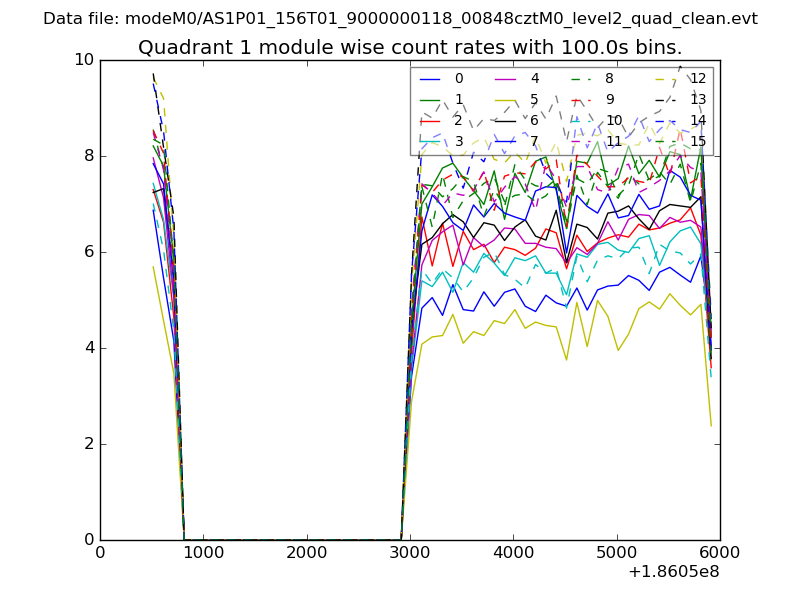
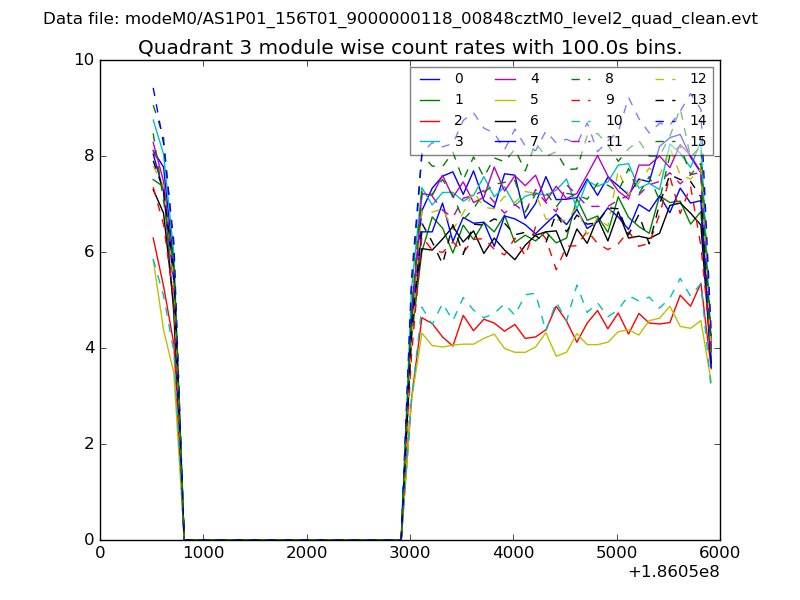
| Module-wise count rates for Quadrant A Data is divided into 100 sec bins |
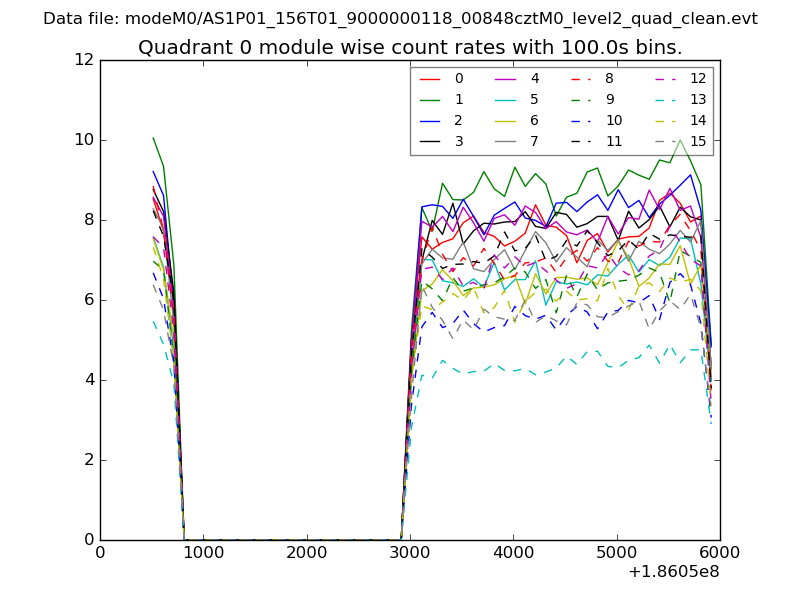 |
 |
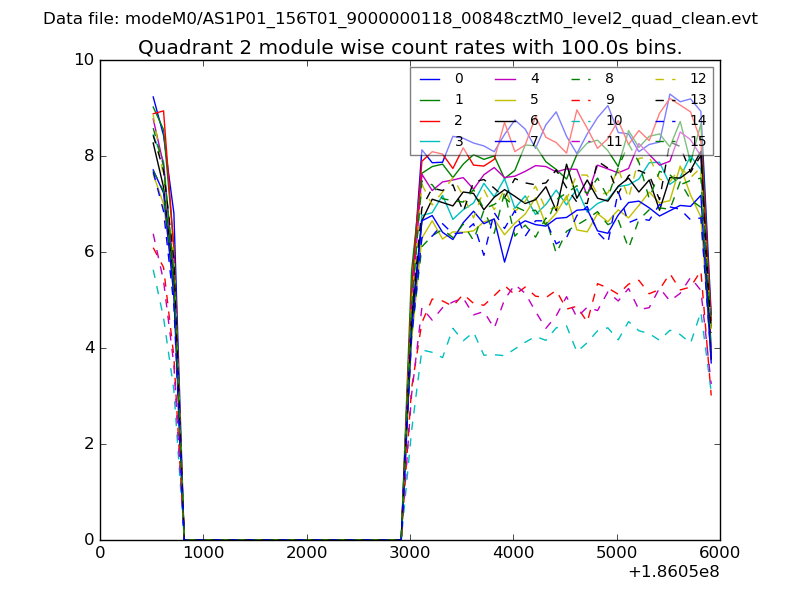
| Module-wise count rates for Quadrant B Data is divided into 100 sec bins |
 |
 |
| Module-wise count rates for Quadrant C Data is divided into 100 sec bins |
 |
 |
| Module-wise count rates for Quadrant D Data is divided into 100 sec bins |
 |
 |
| Parameter | Plot |
|---|---|
| CZT HV Monitor | 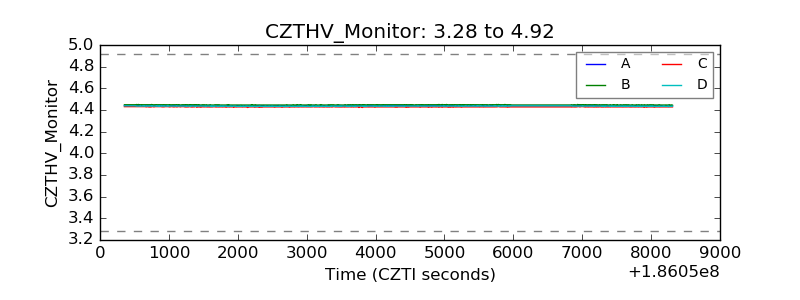 |
| D_VDD | 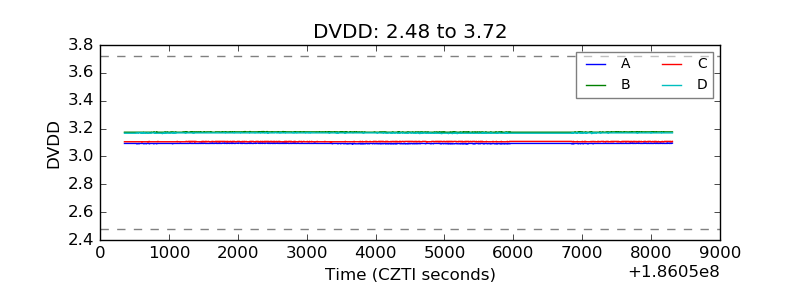 |
| Temperature 1 | 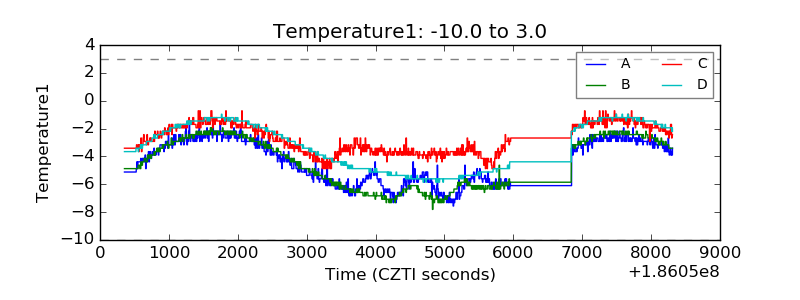 |
| Veto HV Monitor | 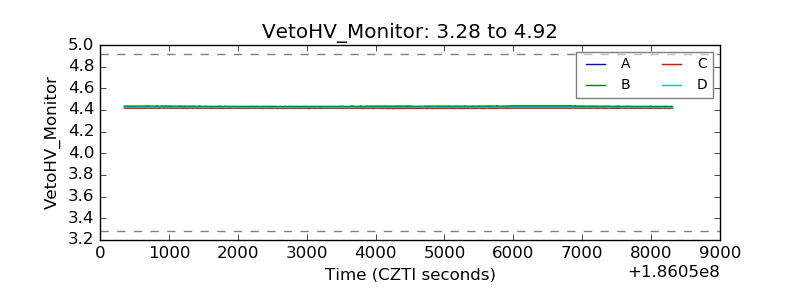 |
| Veto LLD | 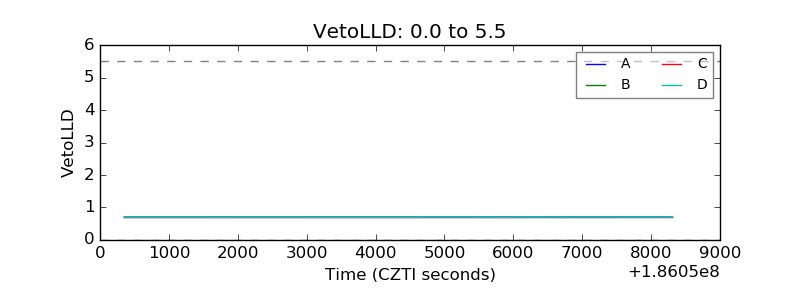 |
| Alpha Counter | 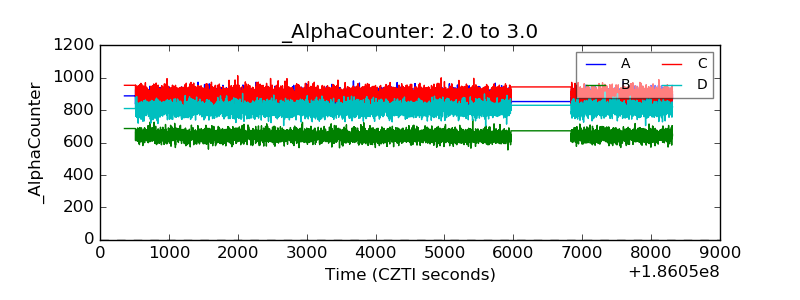 |
| _CPM_Rate | 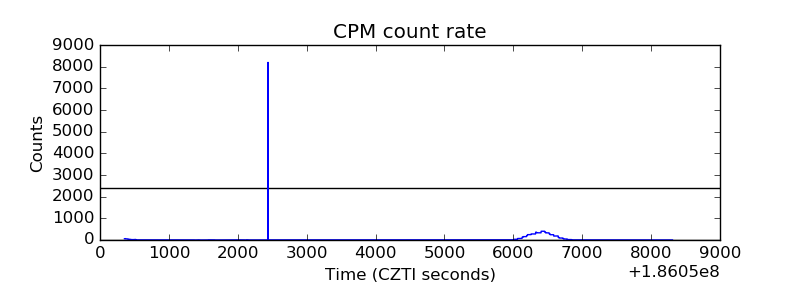 |
| CZT Counter | 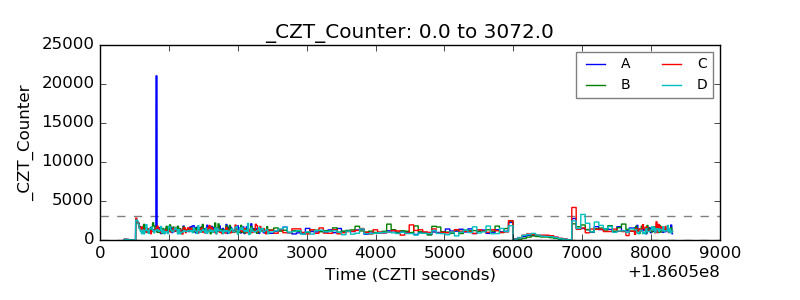 |
| +2.5 Volts monitor | 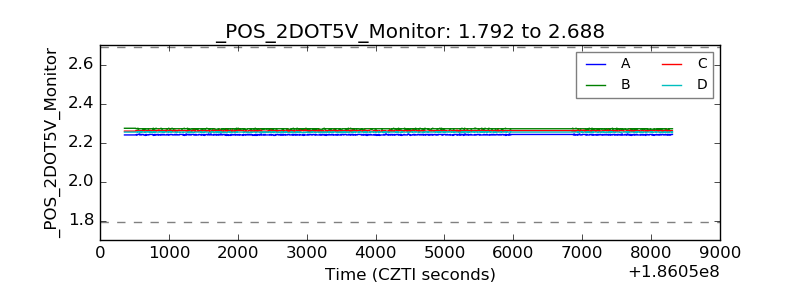 |
| +5 Volts monitor |  |
| _ROLL_ROT | 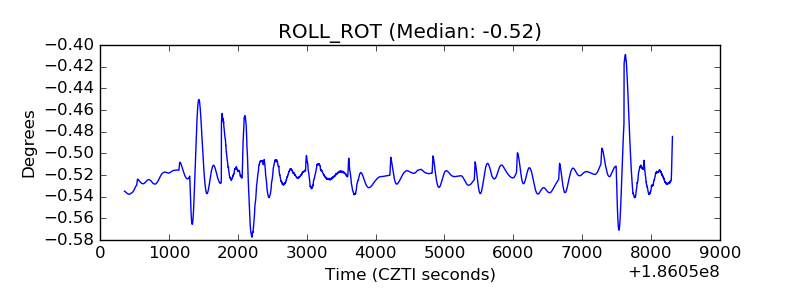 |
| _Roll_DEC | 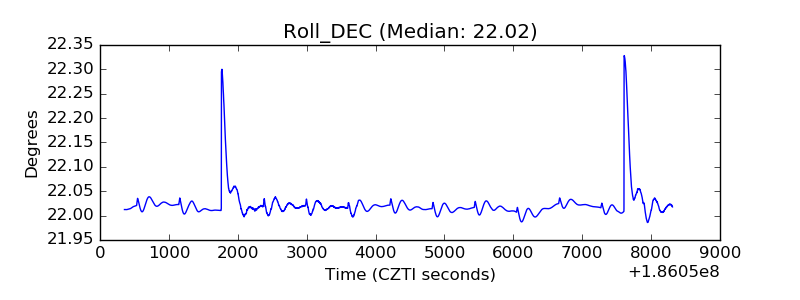 |
| _Roll_RA | 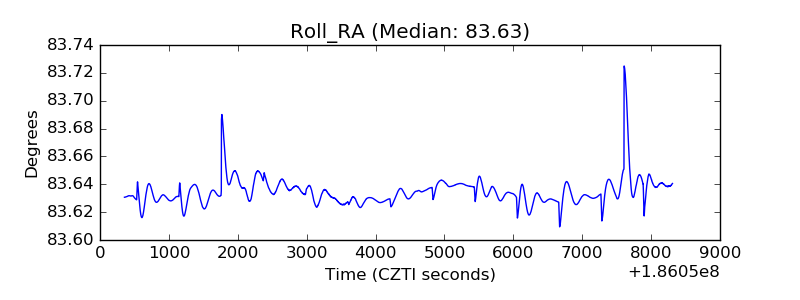 |
| Veto Counter | 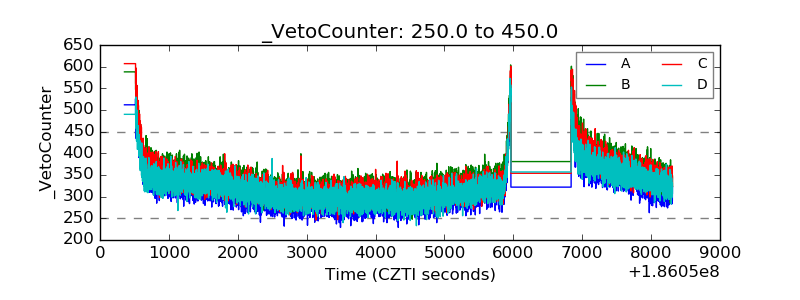 |