| Param | Original file | Final file |
|---|---|---|
| Filename | modeM0/AS1P01_156T01_9000000118_00849cztM0_level2.evt | modeM0/AS1P01_156T01_9000000118_00849cztM0_level2_quad_clean.evt |
| Size (bytes) | 1,163,246,400 | 66,700,800 |
| Size | 1.1 GB | 63.6 MB |
| Events in quadrant A | 8,685,309 | 390,081 |
| Events in quadrant B | 9,136,931 | 387,233 |
| Events in quadrant C | 8,544,562 | 384,127 |
| Events in quadrant D | 8,402,803 | 374,388 |
| Mode SS | |||
|---|---|---|---|
| Quadrant | BADHDUFLAG | Total packets | Discarded packets |
| A | 0 | 144 | 0 |
| B | 0 | 144 | 0 |
| C | 0 | 144 | 0 |
| D | 0 | 144 | 0 |
| Mode M9 | |||
|---|---|---|---|
| Quadrant | BADHDUFLAG | Total packets | Discarded packets |
| A | 0 | 18 | 0 |
| B | 0 | 18 | 0 |
| C | 0 | 18 | 0 |
| D | 0 | 18 | 0 |
| Mode M0 | |||
|---|---|---|---|
| Quadrant | BADHDUFLAG | Total packets | Discarded packets |
| A | 0 | 30717 | 0 |
| B | 0 | 32057 | 0 |
| C | 0 | 30335 | 0 |
| D | 0 | 29898 | 0 |
| Quadrant | Total seconds | Saturated seconds | Saturation percentage |
|---|---|---|---|
| A | 6938 | 57 | 0.821562% |
| B | 6937 | 59 | 0.850512% |
| C | 6937 | 69 | 0.994666% |
| D | 6938 | 121 | 1.744018% |
Noise dominated data is calculated using 1-second bins in cleaned event files. If a bin has >2000 counts, and if more than 50% of those come from <1% of pixels, then it is considered to be noise-dominated and hence unusable.
| Quadrant | # 1 sec bins | Bins with >0 counts | Bins with >2000 counts | High rate bins dominated by noise | Noise dominated (total time) | Noise dominated (detector-on time) | Marked lightcurve |
|---|---|---|---|---|---|---|---|
| A | 8823 | 6938 | 303 | 303 | 3.43% | 4.37% | 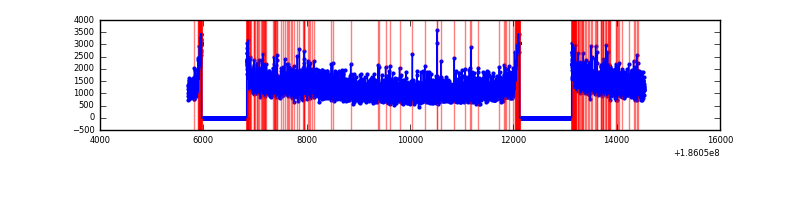 |
| B | 8822 | 6937 | 375 | 375 | 4.25% | 5.41% | 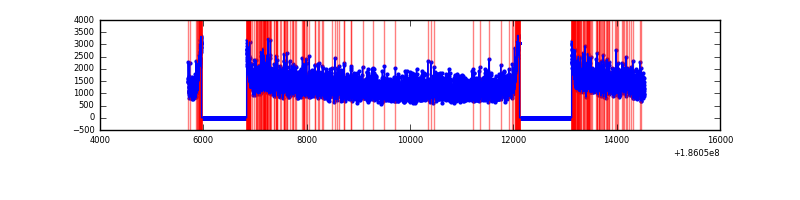 |
| C | 8822 | 6937 | 249 | 249 | 2.82% | 3.59% | 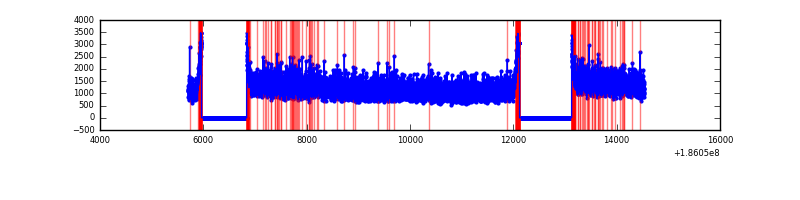 |
| D | 8823 | 6938 | 403 | 403 | 4.57% | 5.81% | 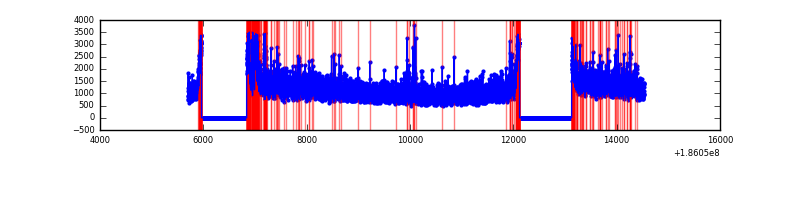 |
Top three noisy pixels from each quadrant. If the there are fewer than three noisy pixels in the level2.evt file, extra rows are filled as -1
| Pixel properties | Quadrant properties | ||||||
|---|---|---|---|---|---|---|---|
| Quadrant | DetID | PixID | Counts | Sigma | Mean | Median | Sigma |
| A | 15 | 171 | 12499 | 18.71 | 2259 | 2281 | 546.2 |
| A | 15 | 17 | 8783 | 11.9 | 2259 | 2281 | 546.2 |
| A | 11 | 79 | 8277 | 10.98 | 2259 | 2281 | 546.2 |
| B | 2 | 2 | 55103 | 95.81 | 2345 | 2362 | 550.5 |
| B | 0 | 23 | 24224 | 39.72 | 2345 | 2362 | 550.5 |
| B | 5 | 249 | 23665 | 38.7 | 2345 | 2362 | 550.5 |
| C | 15 | 241 | 61566 | 99.24 | 2146 | 2226 | 597.9 |
| C | 10 | 19 | 29171 | 45.06 | 2146 | 2226 | 597.9 |
| C | 3 | 111 | 28007 | 43.12 | 2146 | 2226 | 597.9 |
| D | 10 | 85 | 342135 | 523.7 | 2101 | 2185 | 649.1 |
| D | 1 | 4 | 71626 | 106.97 | 2101 | 2185 | 649.1 |
| D | 13 | 169 | 63940 | 95.13 | 2101 | 2185 | 649.1 |
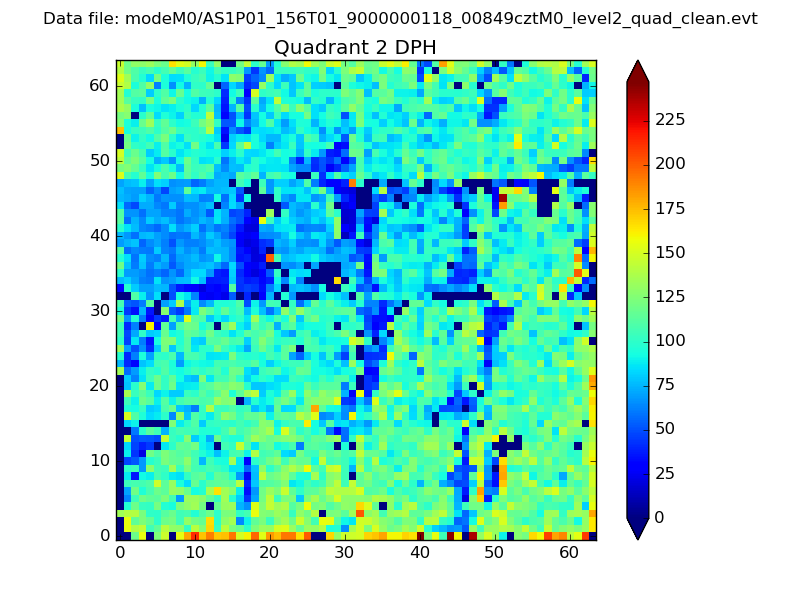
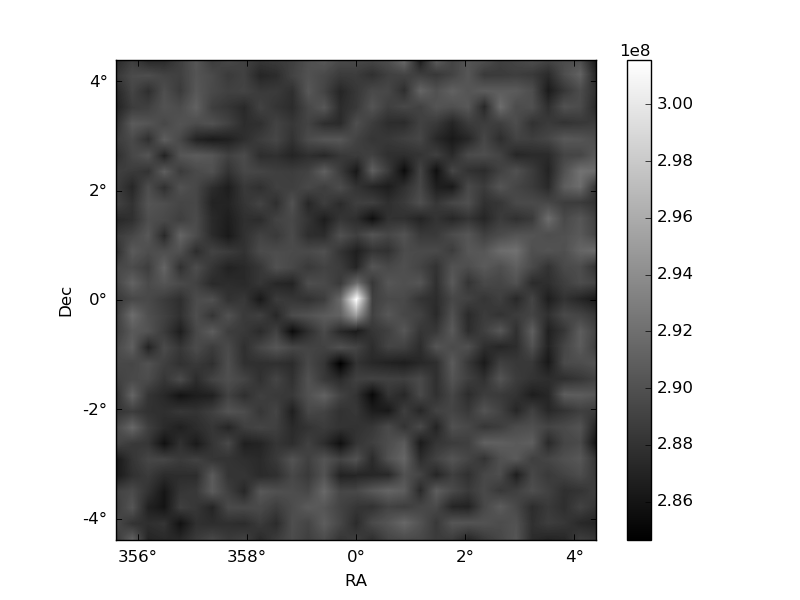
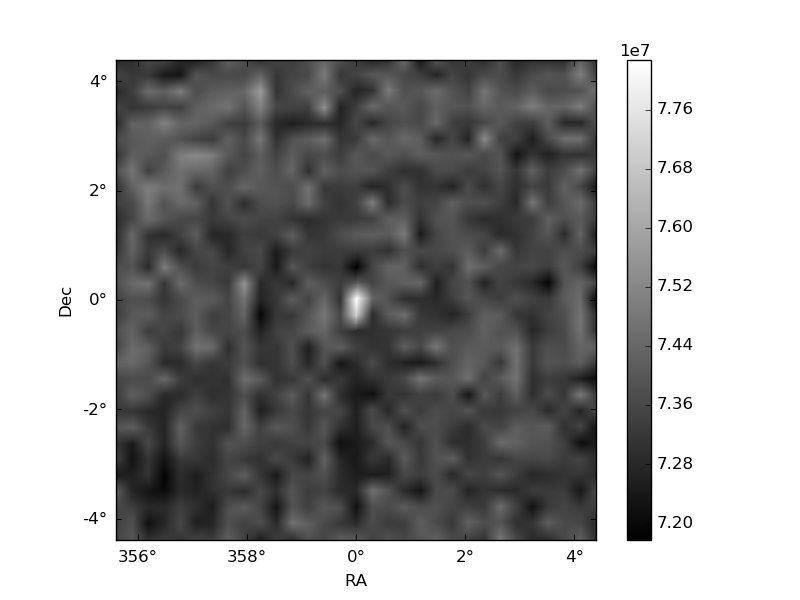
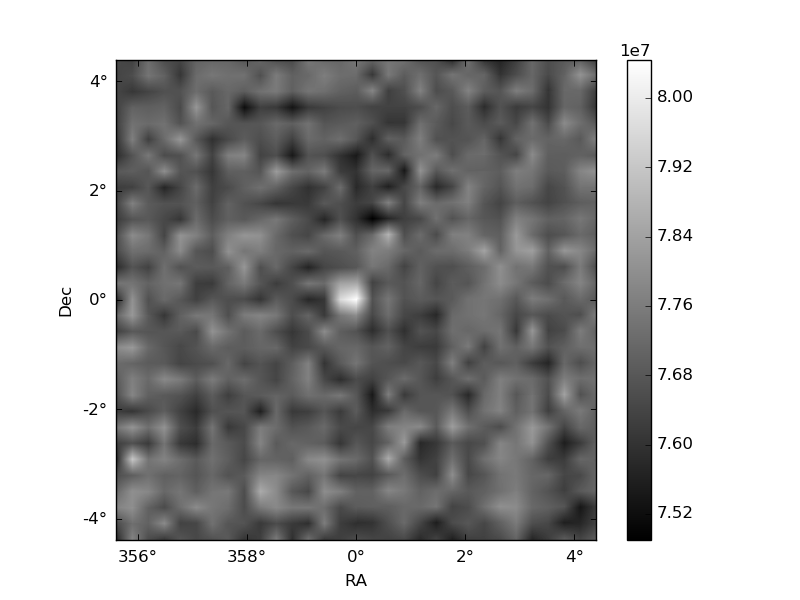
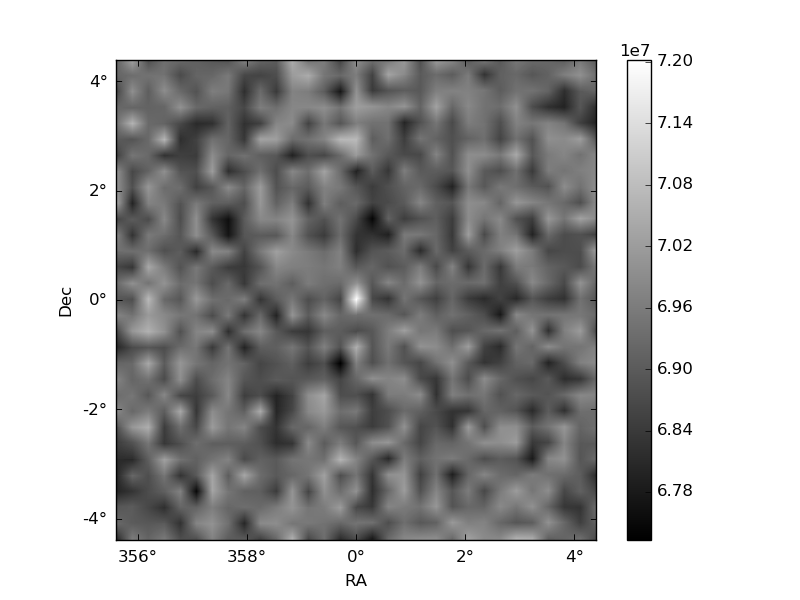
Histogram calculated using DETX and DETY for each event in the final _common_clean file
| Quadrant A | 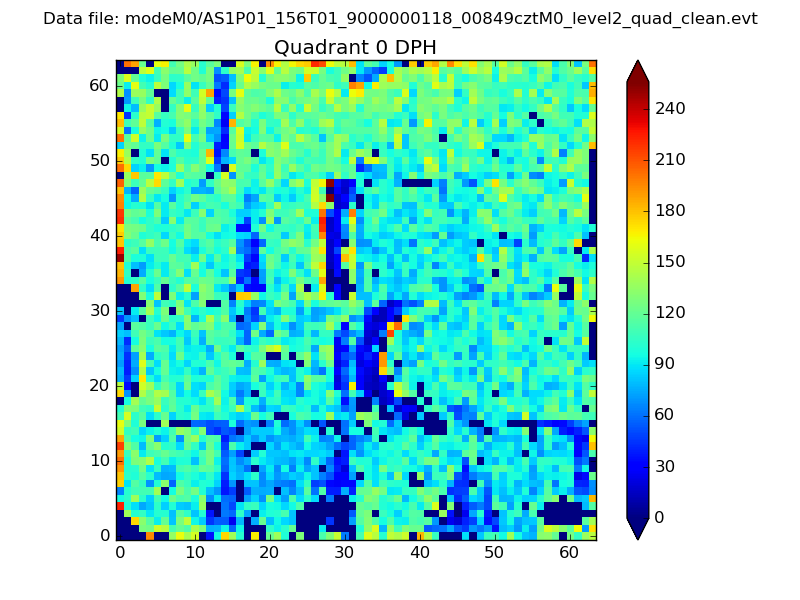 |
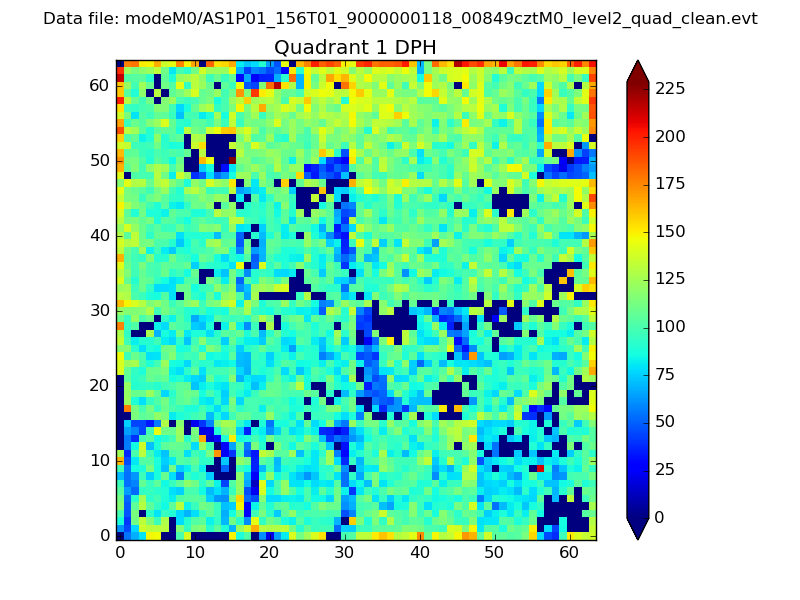 |
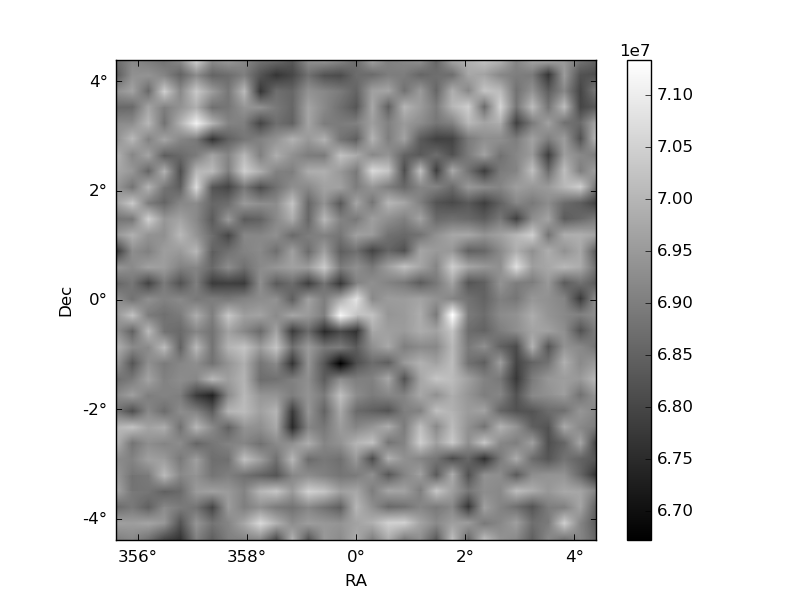
Quadrant B |
|---|---|---|---|
| Quadrant D | 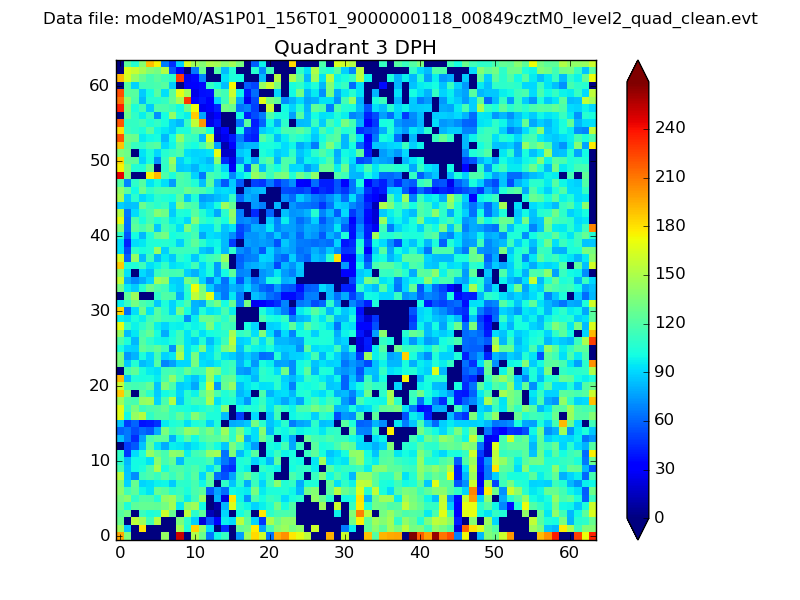 |
 |
Quadrant C |
| Plot type | Count rate plots | Images |
|---|---|---|
| Comparison with Poisson distribution Blue bars denote a histogram of data divided into 1 sec bins. Red curve is a Poisson curve with rate = median count rate of data. |
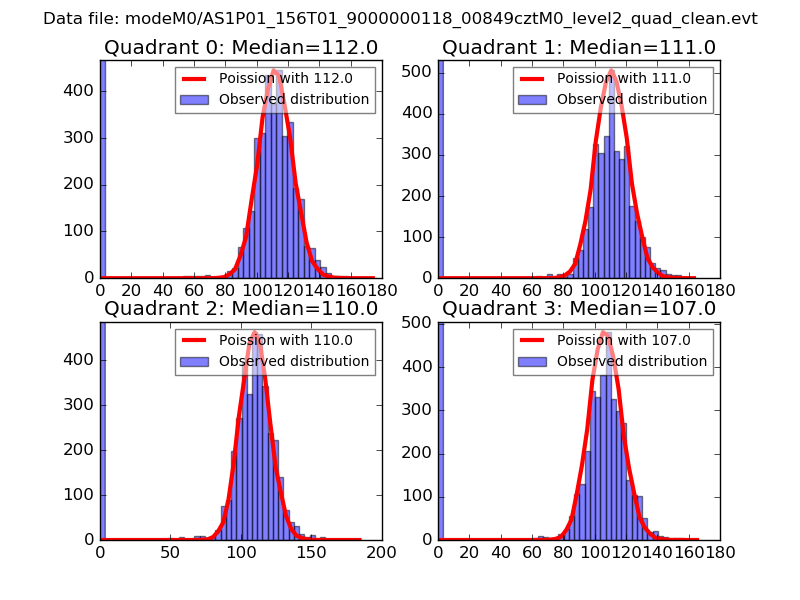 |
 |
| Quadrant-wise count rates Data is divided into 100 sec bins |
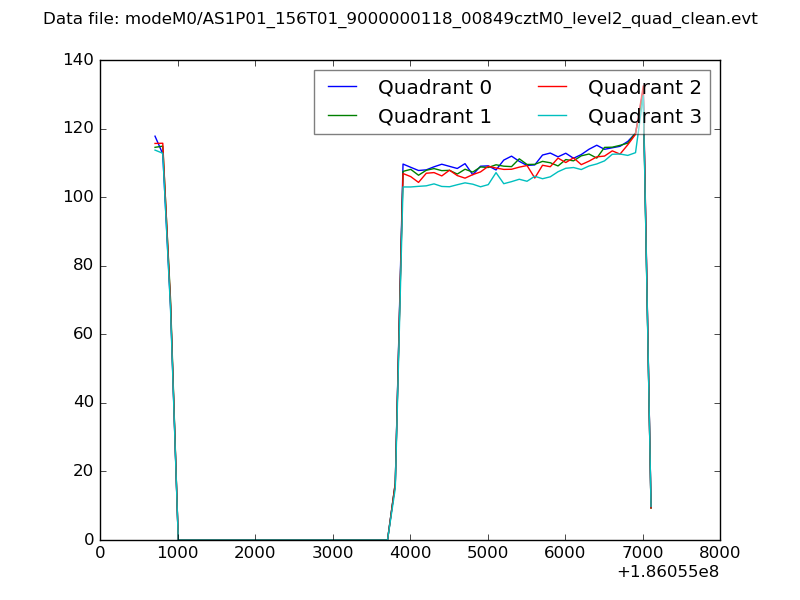 |
|
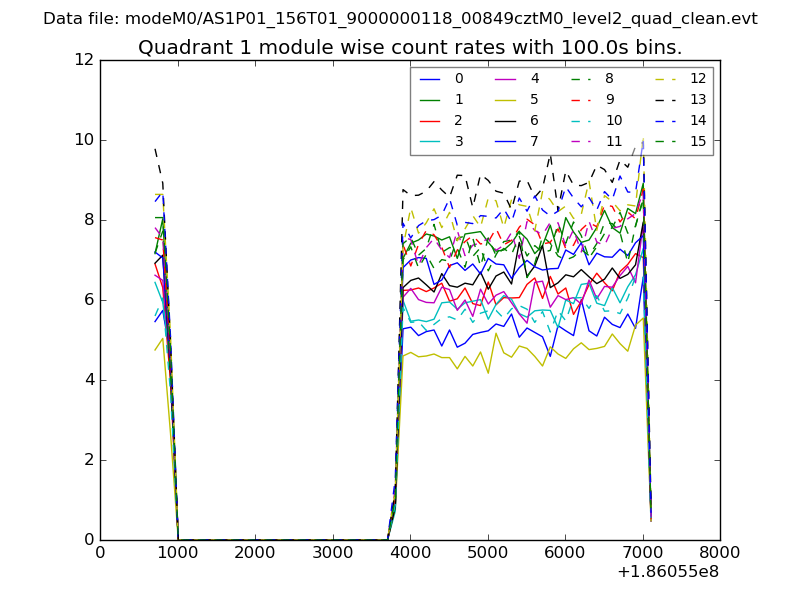
| Module-wise count rates for Quadrant A Data is divided into 100 sec bins |
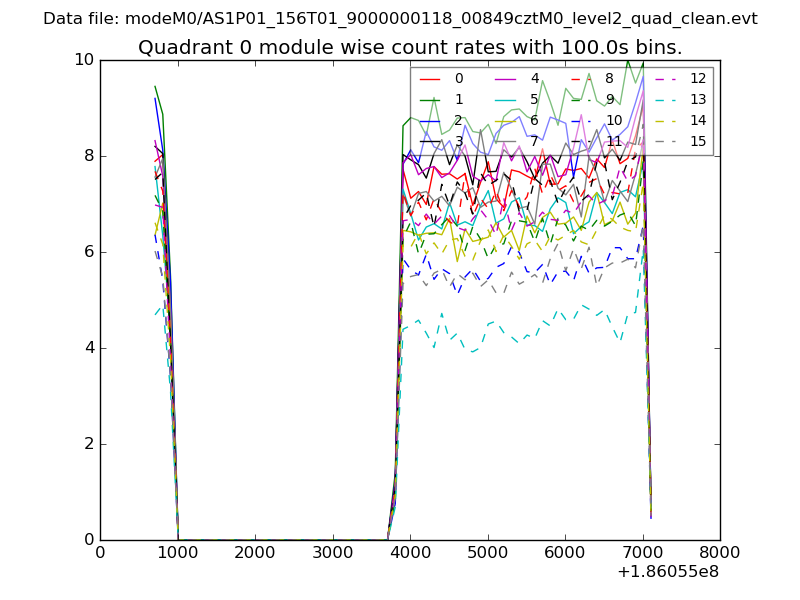 |
 |
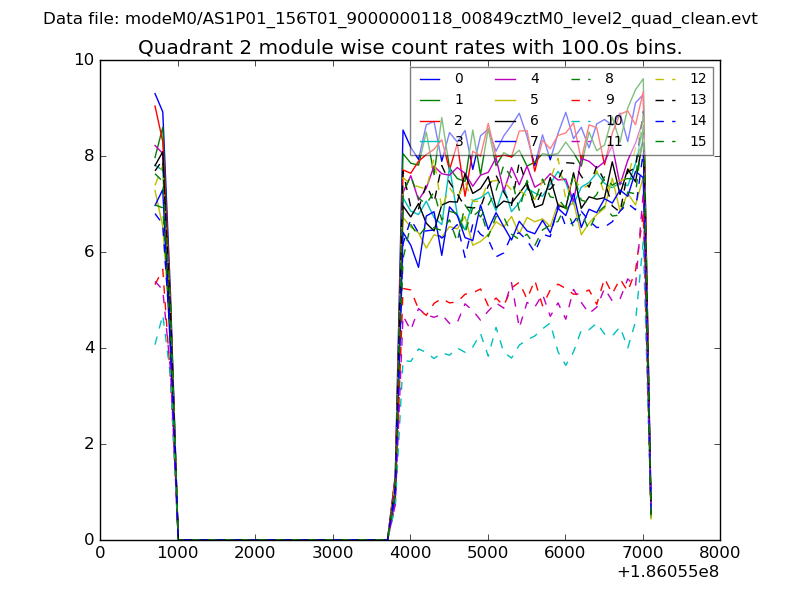
| Module-wise count rates for Quadrant B Data is divided into 100 sec bins |
 |
 |
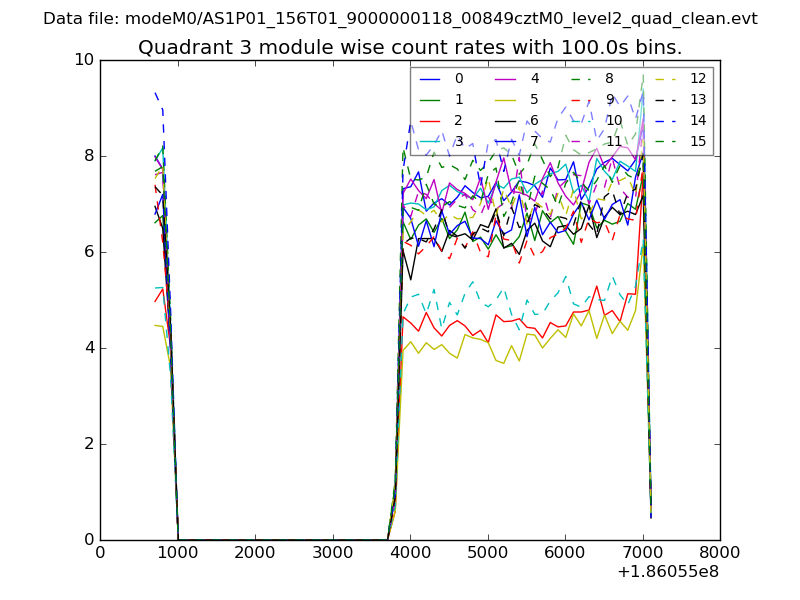
| Module-wise count rates for Quadrant C Data is divided into 100 sec bins |
 |
 |
| Module-wise count rates for Quadrant D Data is divided into 100 sec bins |
 |
 |
| Parameter | Plot |
|---|---|
| CZT HV Monitor | 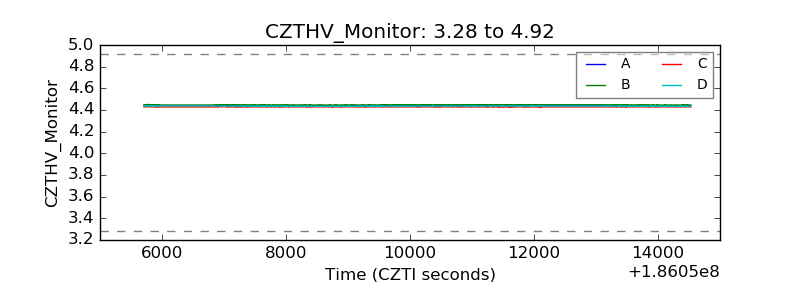 |
| D_VDD | 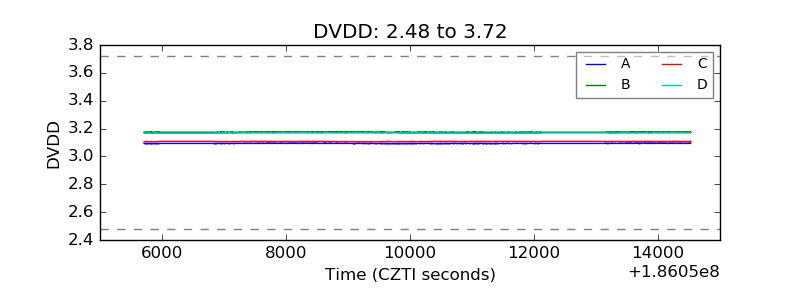 |
| Temperature 1 | 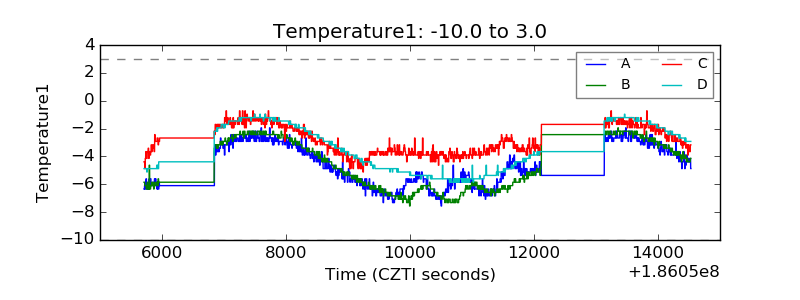 |
| Veto HV Monitor | 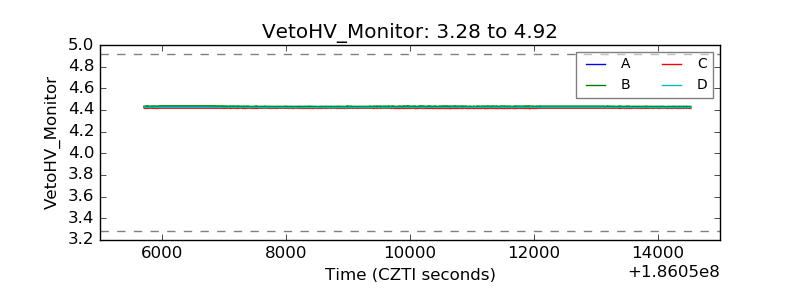 |
| Veto LLD | 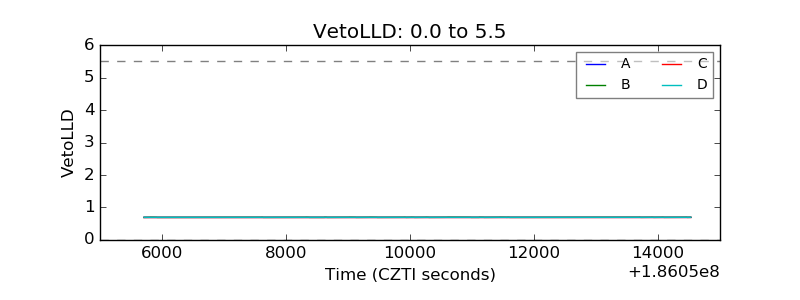 |
| Alpha Counter | 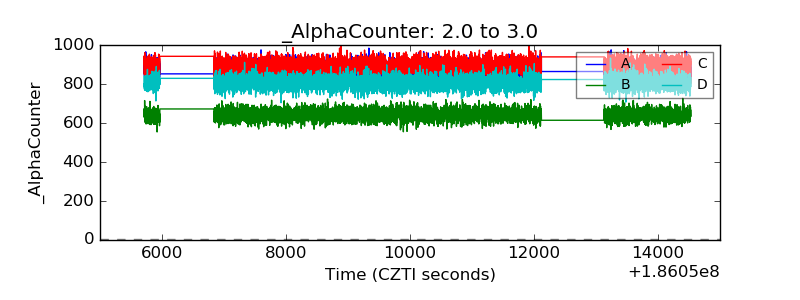 |
| _CPM_Rate | 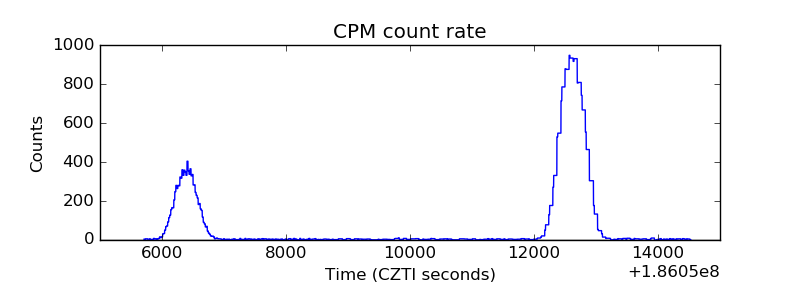 |
| CZT Counter | 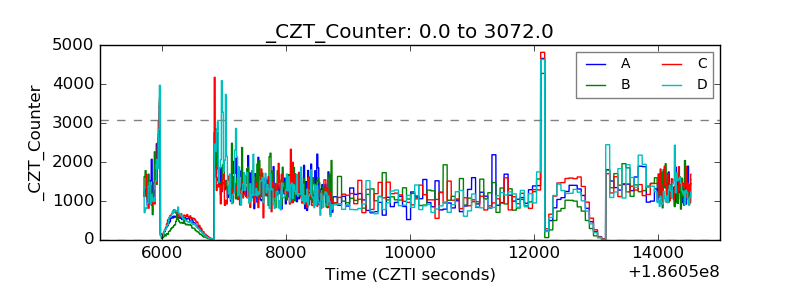 |
| +2.5 Volts monitor | 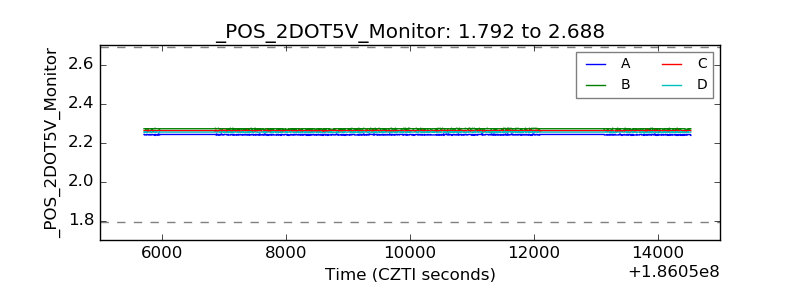 |
| +5 Volts monitor |  |
| _ROLL_ROT | 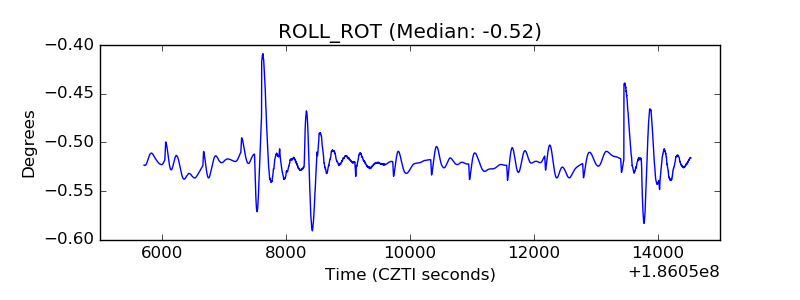 |
| _Roll_DEC | 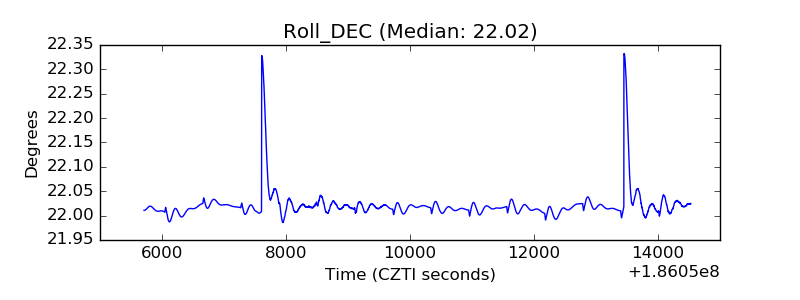 |
| _Roll_RA | 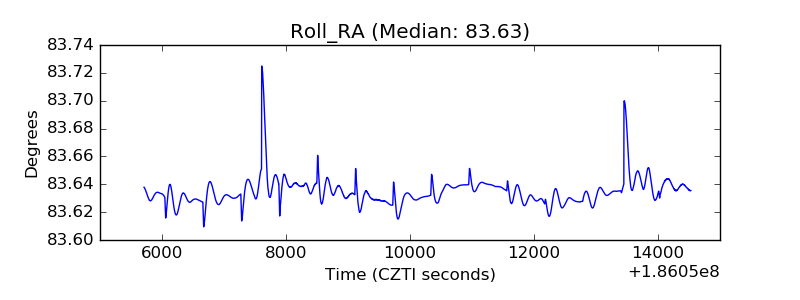 |
| Veto Counter | 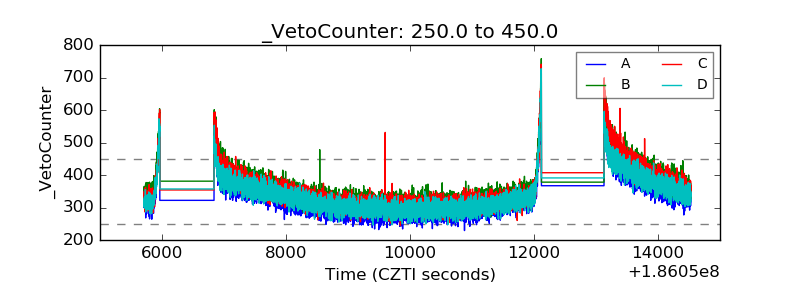 |