| Param | Original file | Final file |
|---|---|---|
| Filename | modeM0/AS1P01_156T01_9000000118_00851cztM0_level2.evt | modeM0/AS1P01_156T01_9000000118_00851cztM0_level2_quad_clean.evt |
| Size (bytes) | 1,063,031,040 | 68,351,040 |
| Size | 1013.8 MB | 65.2 MB |
| Events in quadrant A | 8,030,655 | 409,564 |
| Events in quadrant B | 8,585,356 | 408,388 |
| Events in quadrant C | 7,818,448 | 408,365 |
| Events in quadrant D | 7,334,373 | 395,232 |
| Mode SS | |||
|---|---|---|---|
| Quadrant | BADHDUFLAG | Total packets | Discarded packets |
| A | 0 | 130 | 0 |
| B | 0 | 130 | 0 |
| C | 0 | 130 | 0 |
| D | 0 | 130 | 0 |
| Mode M9 | |||
|---|---|---|---|
| Quadrant | BADHDUFLAG | Total packets | Discarded packets |
| A | 0 | 18 | 0 |
| B | 0 | 18 | 0 |
| C | 0 | 18 | 0 |
| D | 0 | 18 | 0 |
| Mode M0 | |||
|---|---|---|---|
| Quadrant | BADHDUFLAG | Total packets | Discarded packets |
| A | 0 | 28435 | 0 |
| B | 0 | 30040 | 0 |
| C | 0 | 27751 | 0 |
| D | 0 | 26369 | 0 |
| Quadrant | Total seconds | Saturated seconds | Saturation percentage |
|---|---|---|---|
| A | 6422 | 32 | 0.498287% |
| B | 6422 | 41 | 0.638430% |
| C | 6421 | 26 | 0.404921% |
| D | 6421 | 19 | 0.295904% |
Noise dominated data is calculated using 1-second bins in cleaned event files. If a bin has >2000 counts, and if more than 50% of those come from <1% of pixels, then it is considered to be noise-dominated and hence unusable.
| Quadrant | # 1 sec bins | Bins with >0 counts | Bins with >2000 counts | High rate bins dominated by noise | Noise dominated (total time) | Noise dominated (detector-on time) | Marked lightcurve |
|---|---|---|---|---|---|---|---|
| A | 7567 | 6423 | 309 | 309 | 4.08% | 4.81% | 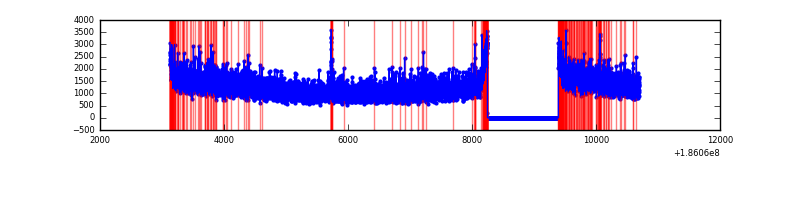 |
| B | 7567 | 6423 | 471 | 471 | 6.22% | 7.33% | 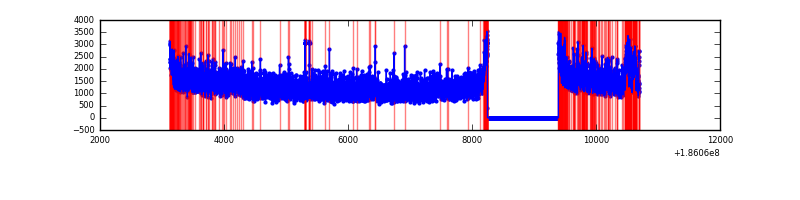 |
| C | 7566 | 6422 | 213 | 213 | 2.82% | 3.32% | 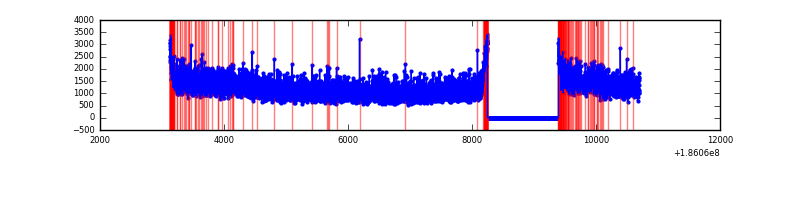 |
| D | 7566 | 6421 | 181 | 181 | 2.39% | 2.82% | 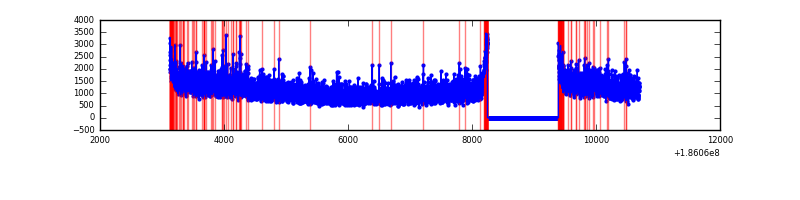 |
Top three noisy pixels from each quadrant. If the there are fewer than three noisy pixels in the level2.evt file, extra rows are filled as -1
| Pixel properties | Quadrant properties | ||||||
|---|---|---|---|---|---|---|---|
| Quadrant | DetID | PixID | Counts | Sigma | Mean | Median | Sigma |
| A | 15 | 171 | 56145 | 108.7 | 2062 | 2083 | 497.4 |
| A | 0 | 231 | 45361 | 87.01 | 2062 | 2083 | 497.4 |
| A | 15 | 233 | 12599 | 21.14 | 2062 | 2083 | 497.4 |
| B | 5 | 191 | 253323 | 500.92 | 2149 | 2163 | 501.4 |
| B | 2 | 2 | 55979 | 107.33 | 2149 | 2163 | 501.4 |
| B | 0 | 23 | 35621 | 66.73 | 2149 | 2163 | 501.4 |
| C | 10 | 19 | 24670 | 41.34 | 1977 | 2053 | 547.1 |
| C | 3 | 111 | 23967 | 40.06 | 1977 | 2053 | 547.1 |
| C | 15 | 241 | 23359 | 38.95 | 1977 | 2053 | 547.1 |
| D | 1 | 4 | 76189 | 126.15 | 1922 | 1995 | 588.2 |
| D | 5 | 254 | 12531 | 17.91 | 1922 | 1995 | 588.2 |
| D | 13 | 72 | 10762 | 14.91 | 1922 | 1995 | 588.2 |
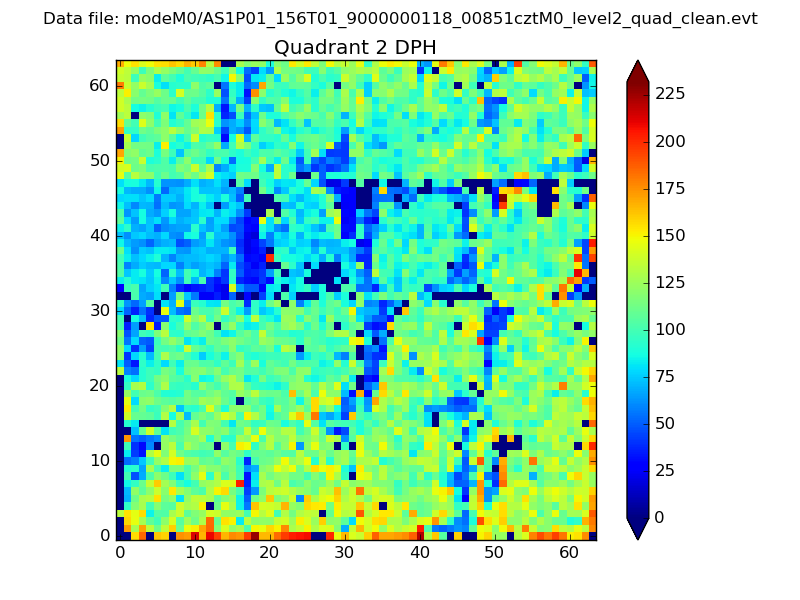
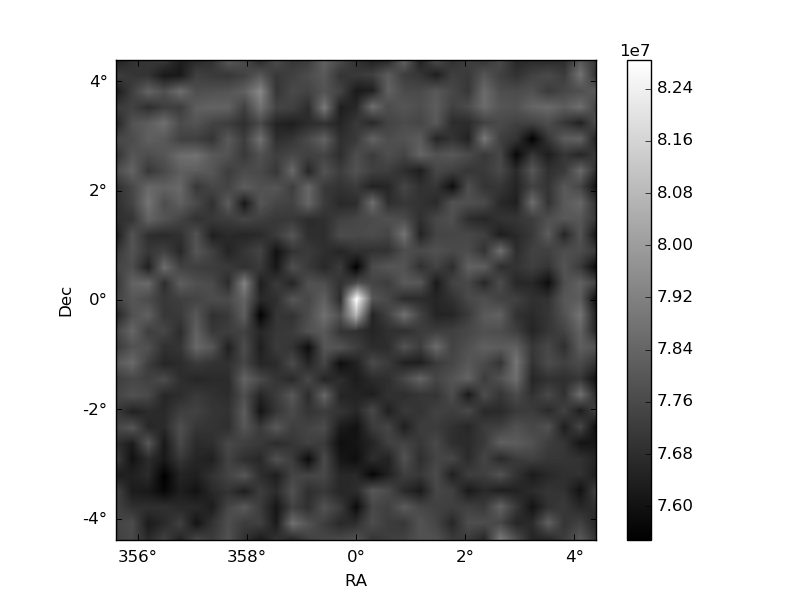
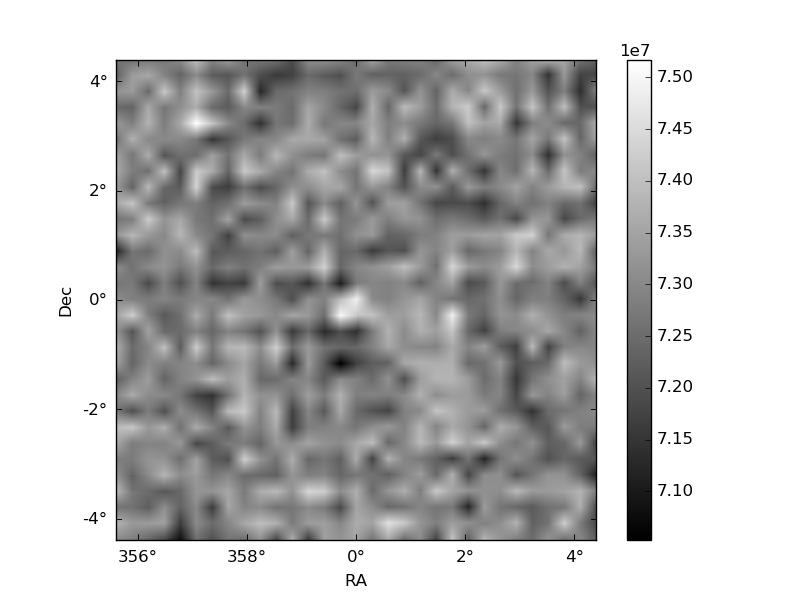
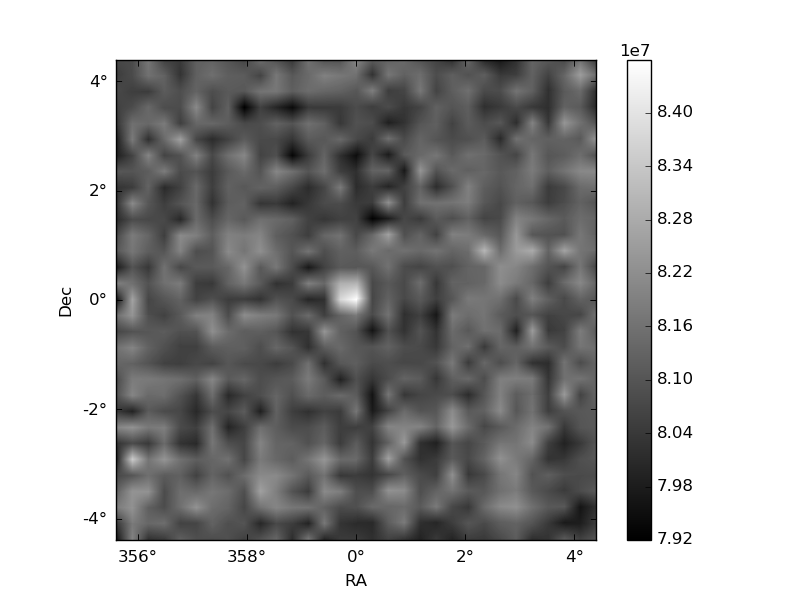
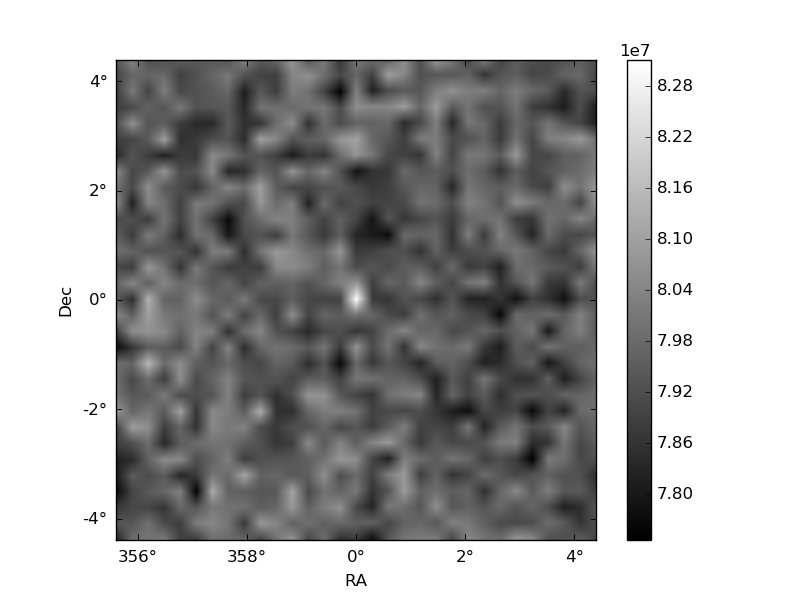
Histogram calculated using DETX and DETY for each event in the final _common_clean file
| Quadrant A | 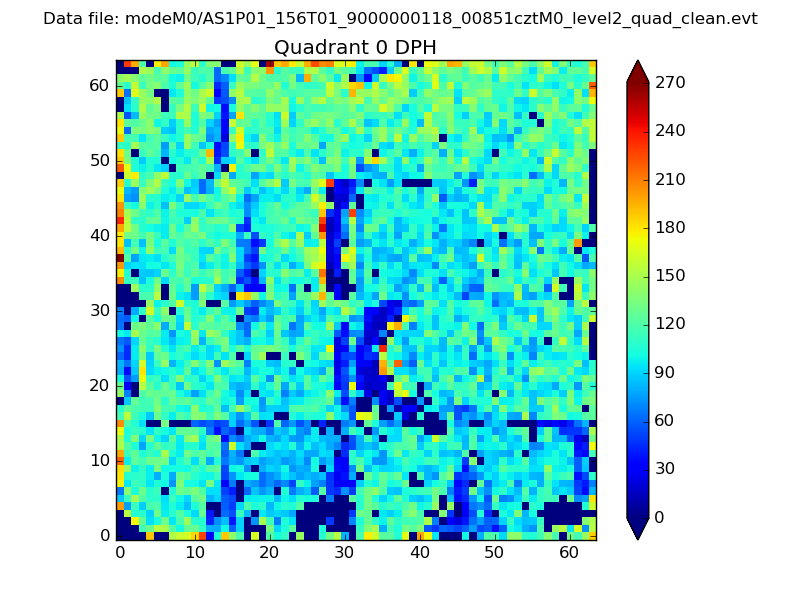 |
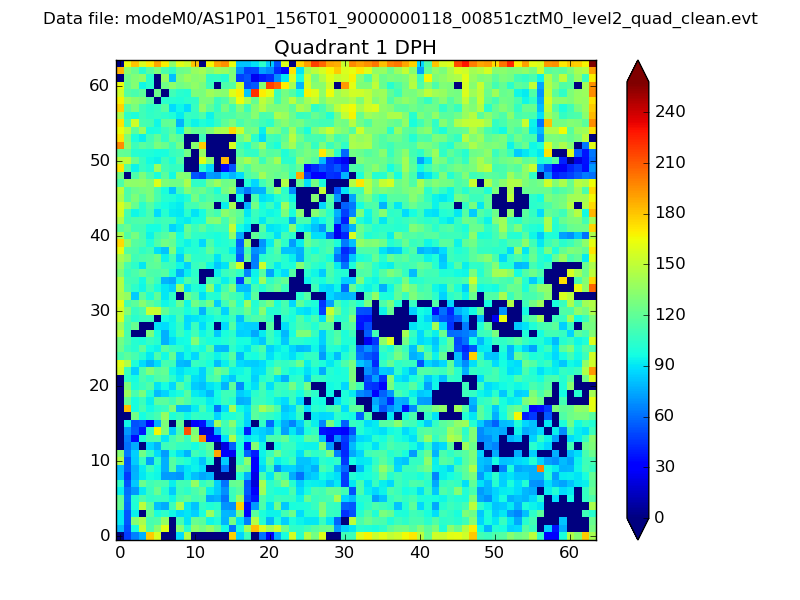 |
Quadrant B |
|---|---|---|---|
| Quadrant D | 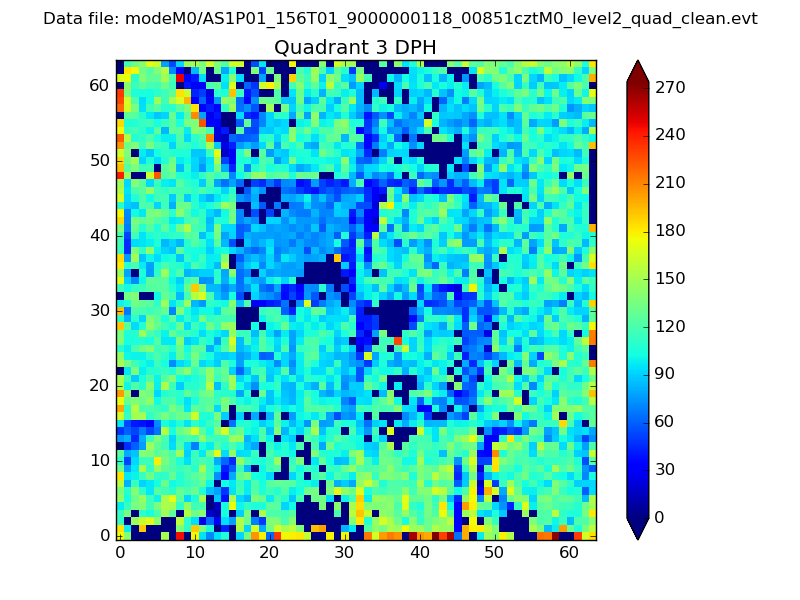 |
 |
Quadrant C |
| Plot type | Count rate plots | Images |
|---|---|---|
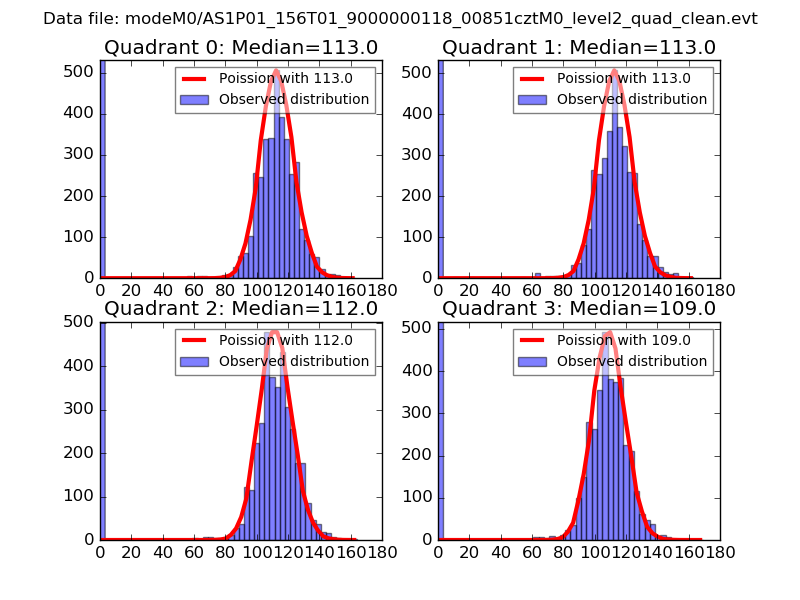
| Comparison with Poisson distribution Blue bars denote a histogram of data divided into 1 sec bins. Red curve is a Poisson curve with rate = median count rate of data. |
 |
 |
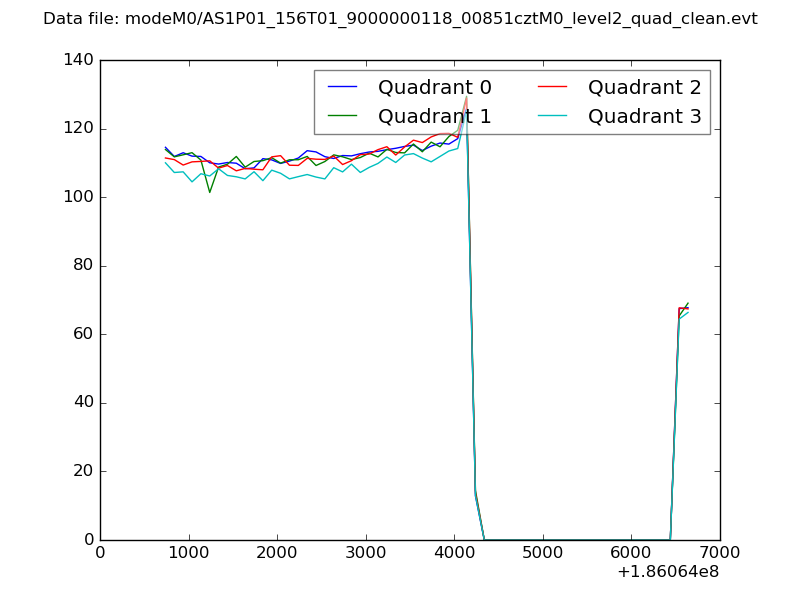
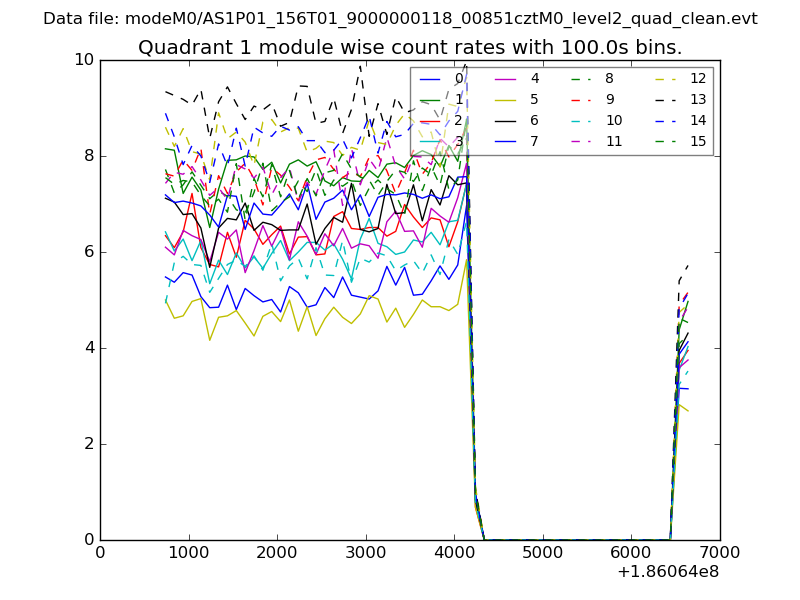
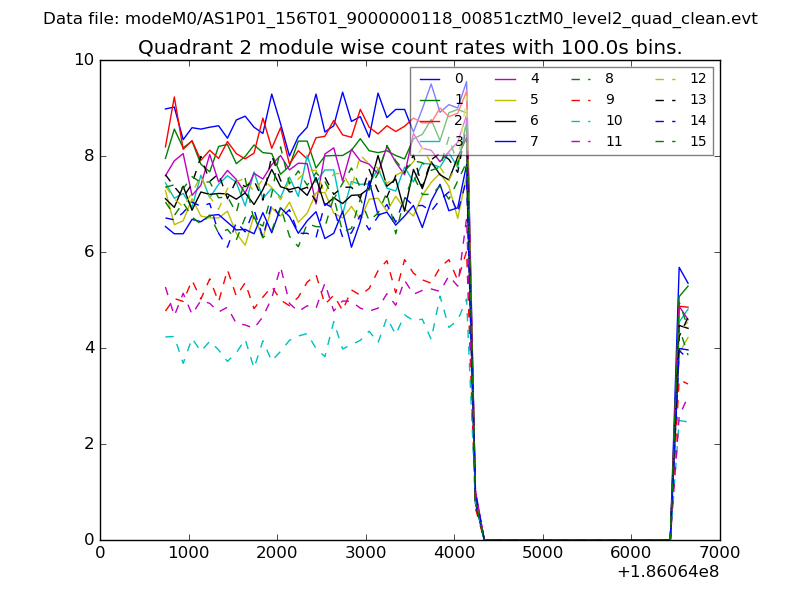
| Quadrant-wise count rates Data is divided into 100 sec bins |
 |
|
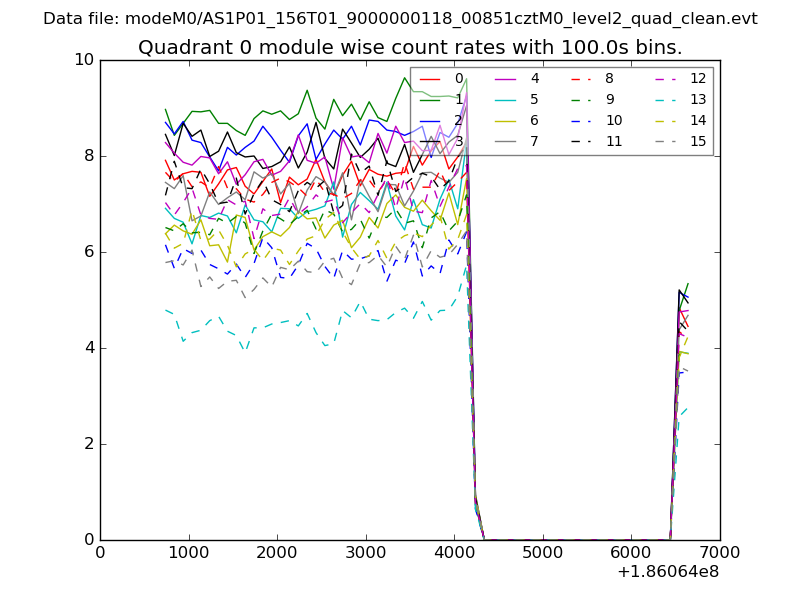
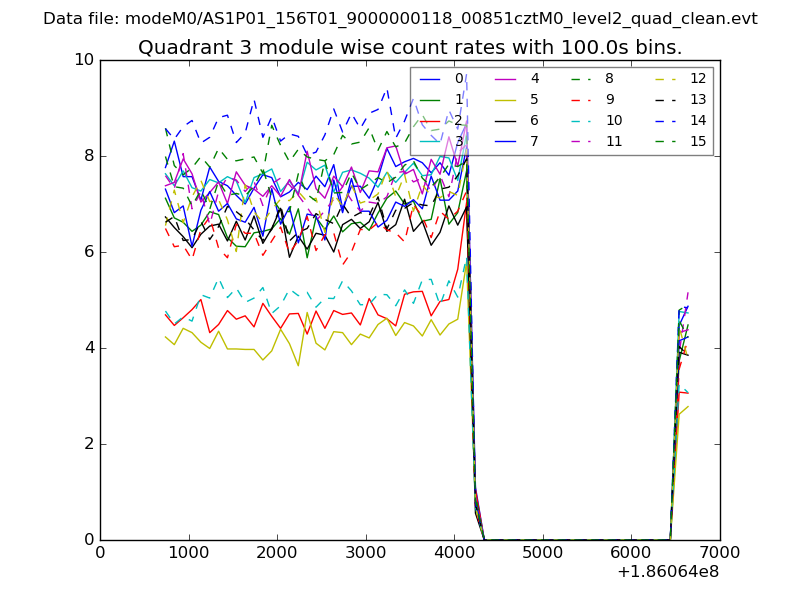
| Module-wise count rates for Quadrant A Data is divided into 100 sec bins |
 |
 |
| Module-wise count rates for Quadrant B Data is divided into 100 sec bins |
 |
 |
| Module-wise count rates for Quadrant C Data is divided into 100 sec bins |
 |
 |
| Module-wise count rates for Quadrant D Data is divided into 100 sec bins |
 |
 |
| Parameter | Plot |
|---|---|
| CZT HV Monitor | 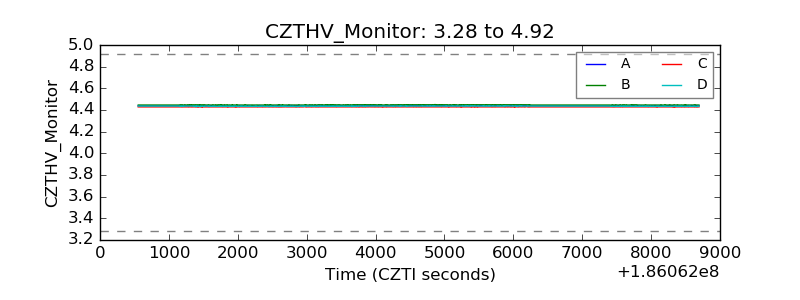 |
| D_VDD | 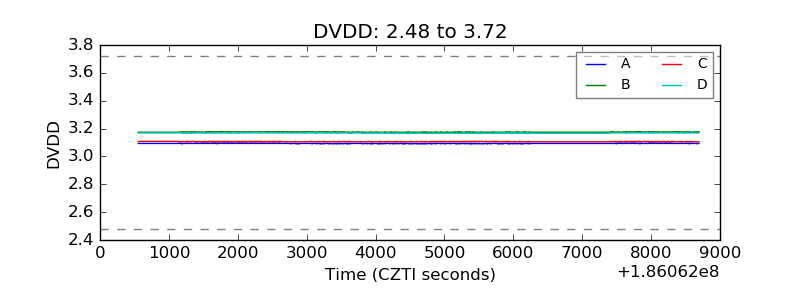 |
| Temperature 1 | 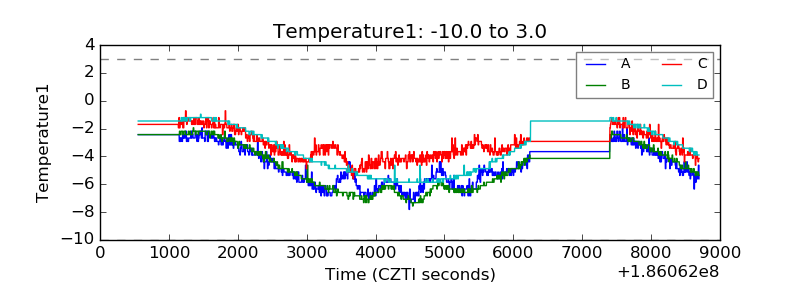 |
| Veto HV Monitor | 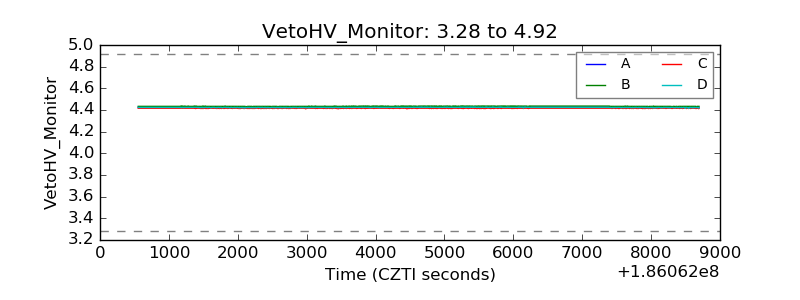 |
| Veto LLD | 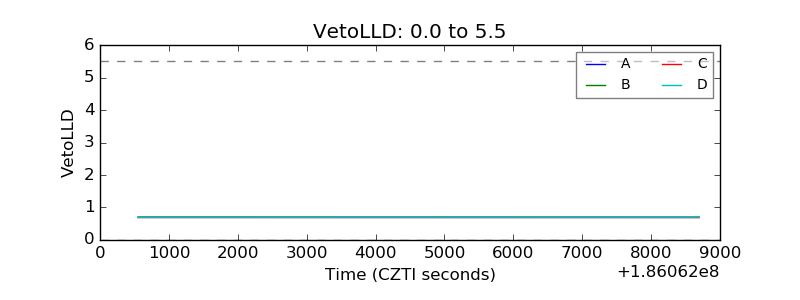 |
| Alpha Counter | 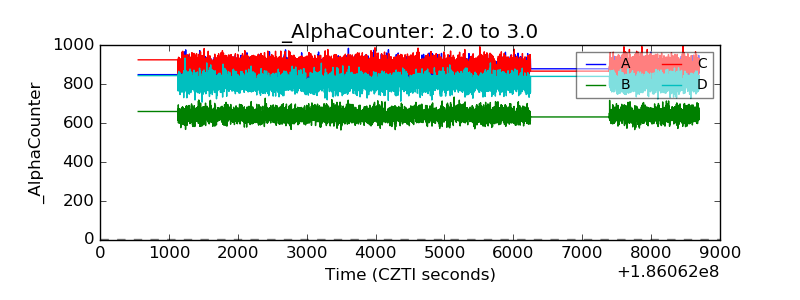 |
| _CPM_Rate | 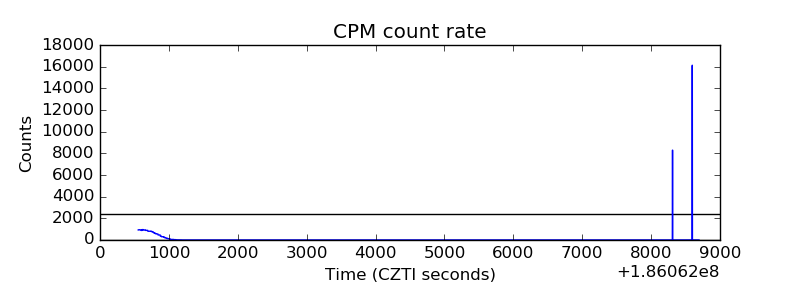 |
| CZT Counter | 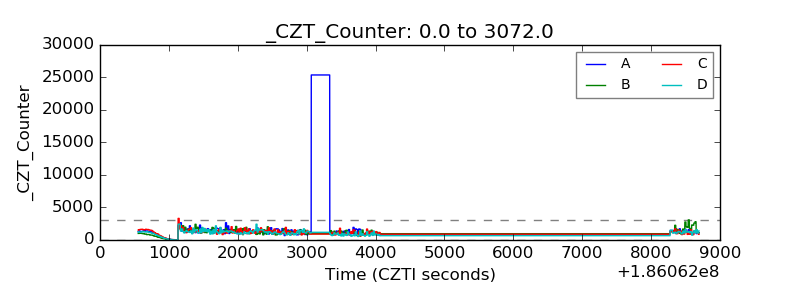 |
| +2.5 Volts monitor |  |
| +5 Volts monitor | 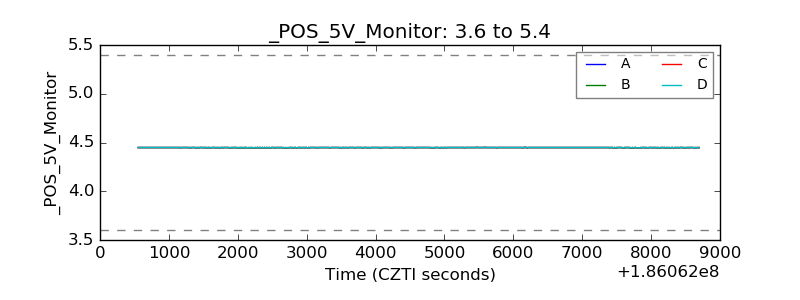 |
| _ROLL_ROT | 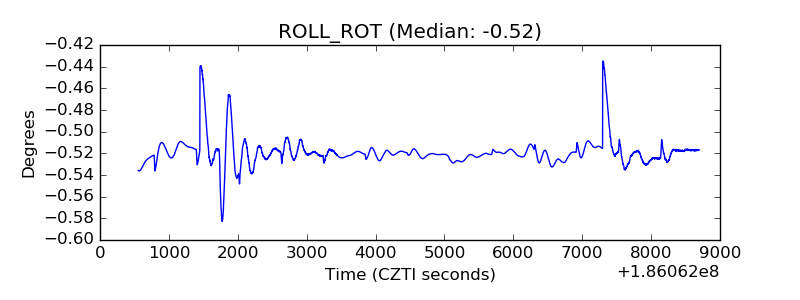 |
| _Roll_DEC | 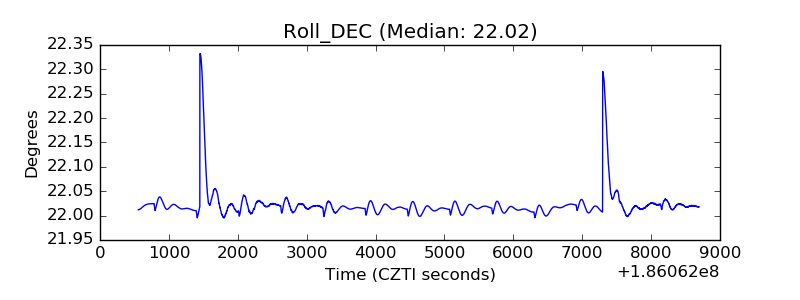 |
| _Roll_RA | 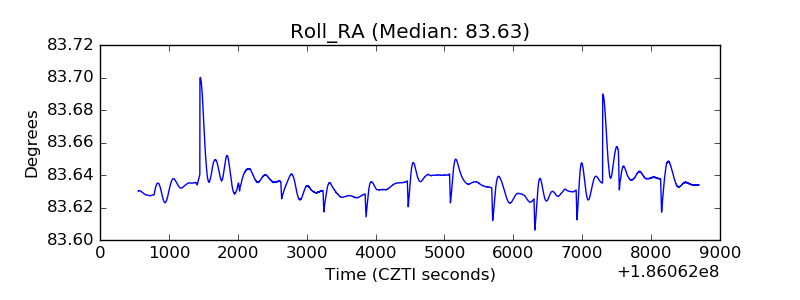 |
| Veto Counter | 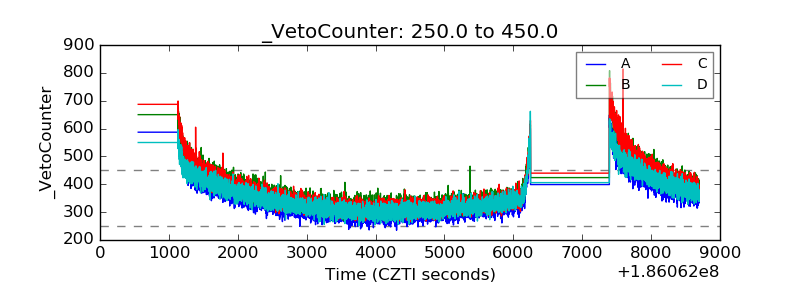 |