| Param | Original file | Final file |
|---|---|---|
| Filename | modeM0/AS1P01_165T02_9000000120cztM0_level2.fits | modeM0/AS1P01_165T02_9000000120cztM0_level2_quad_clean.evt |
| Size (bytes) | 336,055,680 | 368,233,920 |
| Size | 320.5 MB | 351.2 MB |
| Events in quadrant A | 1,958,360 | 2,215,835 |
| Events in quadrant B | 1,941,660 | 2,203,856 |
| Events in quadrant C | 1,944,956 | 2,112,772 |
| Events in quadrant D | 1,682,402 | 1,969,506 |
| Mode SS | |||
|---|---|---|---|
| Quadrant | BADHDUFLAG | Total packets | Discarded packets |
| A | 0 | 784 | 0 |
| B | 0 | 784 | 0 |
| C | 0 | 784 | 0 |
| D | 0 | 784 | 0 |
| Mode M0 | |||
|---|---|---|---|
| Quadrant | BADHDUFLAG | Total packets | Discarded packets |
| A | 0 | 164912 | 0 |
| B | 0 | 175640 | 0 |
| C | 0 | 161802 | 0 |
| D | 0 | 156469 | 0 |
| Mode M9 | |||
|---|---|---|---|
| Quadrant | BADHDUFLAG | Total packets | Discarded packets |
| A | 0 | 49 | 0 |
| B | 0 | 49 | 0 |
| C | 0 | 49 | 0 |
| D | 0 | 49 | 0 |
| Quadrant | Total seconds | Saturated seconds | Saturation percentage |
|---|---|---|---|
| A | 38585 | 98 | 0.253985% |
| B | 38585 | 334 | 0.865621% |
| C | 38585 | 120 | 0.311002% |
| D | 38585 | 368 | 0.953738% |
Noise dominated data is calculated using 1-second bins in cleaned event files. If a bin has >2000 counts, and if more than 50% of those come from <1% of pixels, then it is considered to be noise-dominated and hence unusable.
| Quadrant | # 1 sec bins | Bins with >0 counts | Bins with >2000 counts | High rate bins dominated by noise | Noise dominated (total time) | Noise dominated (detector-on time) | Marked lightcurve |
|---|---|---|---|---|---|---|---|
| A | 43580 | 38583 | 0 | 0 | 0.00% | 0.00% | 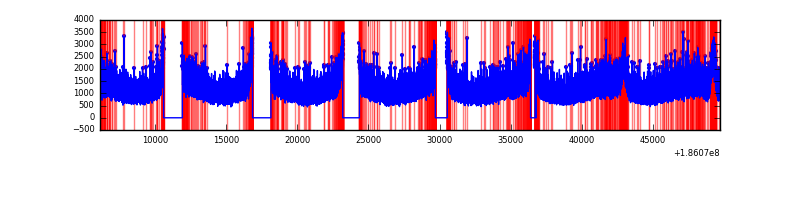 |
| B | 43579 | 38567 | 0 | 0 | 0.00% | 0.00% |  |
| C | 43579 | 38583 | 0 | 0 | 0.00% | 0.00% | 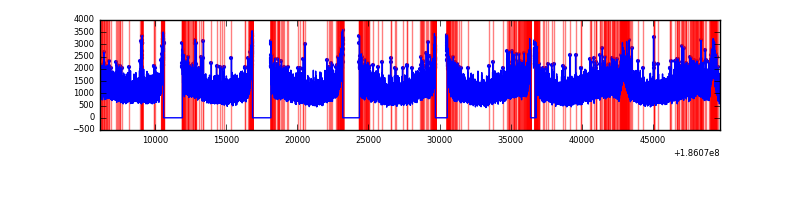 |
| D | 43580 | 38577 | 0 | 0 | 0.00% | 0.00% |  |
Top three noisy pixels from each quadrant. If the there are fewer than three noisy pixels in the level2.evt file, extra rows are filled as -1
| Pixel properties | Quadrant properties | ||||||
|---|---|---|---|---|---|---|---|
| Quadrant | DetID | PixID | Counts | Sigma | Mean | Median | Sigma |
| A | 7 | 110 | 1788 | 10.86 | 507 | 472 | 121.2 |
| A | 0 | 29 | 1770 | 10.71 | 507 | 472 | 121.2 |
| A | 14 | 188 | 1527 | 8.7 | 507 | 472 | 121.2 |
| B | 2 | 9 | 1524 | 10.78 | 513 | 486 | 96.3 |
| B | 14 | 254 | 1265 | 8.09 | 513 | 486 | 96.3 |
| B | 10 | 225 | 1261 | 8.05 | 513 | 486 | 96.3 |
| C | 9 | 242 | 1334 | 6.69 | 514 | 474 | 128.5 |
| C | 12 | 241 | 1301 | 6.44 | 514 | 474 | 128.5 |
| C | 3 | 235 | 1244 | 5.99 | 514 | 474 | 128.5 |
| D | 1 | 19 | 1275 | 7.13 | 480 | 439 | 117.2 |
| D | 6 | 44 | 1235 | 6.79 | 480 | 439 | 117.2 |
| D | 6 | 231 | 1214 | 6.61 | 480 | 439 | 117.2 |
Histogram calculated using DETX and DETY for each event in the final _common_clean file
| Quadrant A | 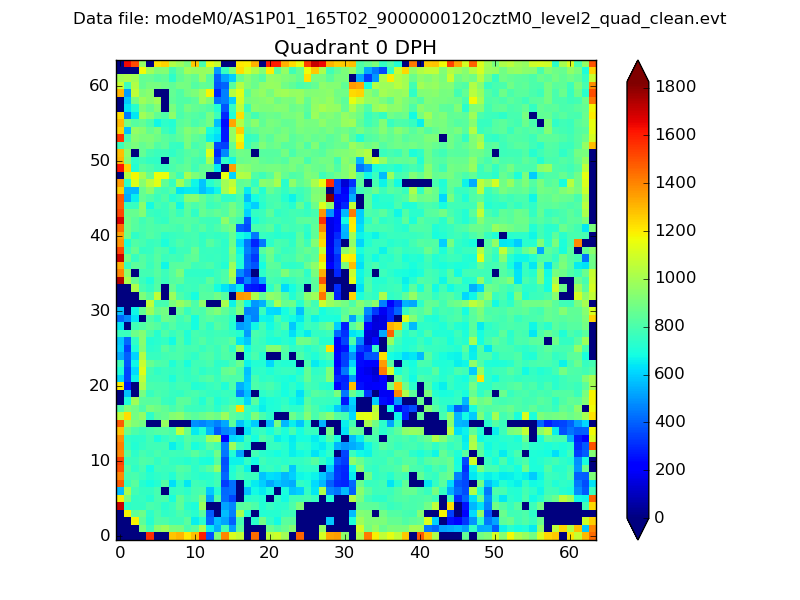 |
 |
Quadrant B |
|---|---|---|---|
| Quadrant D |  |
 |
Quadrant C |
| Plot type | Count rate plots | Images |
|---|---|---|
| Comparison with Poisson distribution Blue bars denote a histogram of data divided into 1 sec bins. Red curve is a Poisson curve with rate = median count rate of data. |
 |
 |
| Quadrant-wise count rates Data is divided into 100 sec bins |
 |
|
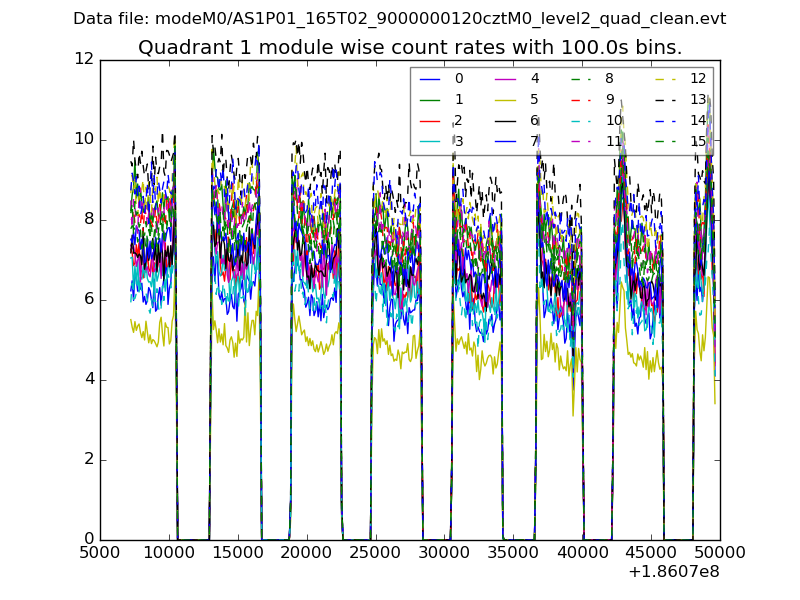
| Module-wise count rates for Quadrant A Data is divided into 100 sec bins |
 |
 |
| Module-wise count rates for Quadrant B Data is divided into 100 sec bins |
 |
 |
| Module-wise count rates for Quadrant C Data is divided into 100 sec bins |
 |
 |
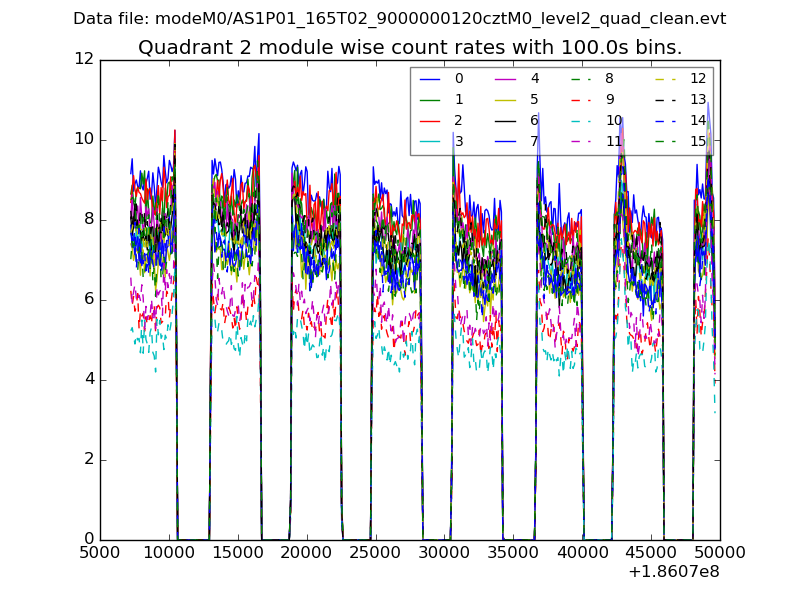
| Module-wise count rates for Quadrant D Data is divided into 100 sec bins |
 |
 |
| Parameter | Plot |
|---|---|
| CZT HV Monitor |  |
| D_VDD |  |
| Temperature 1 |  |
| Veto HV Monitor | 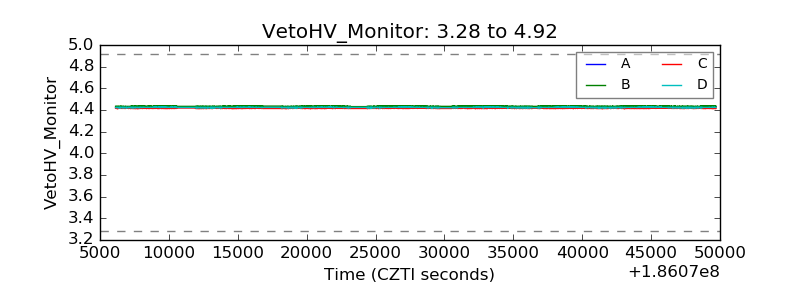 |
| Veto LLD | 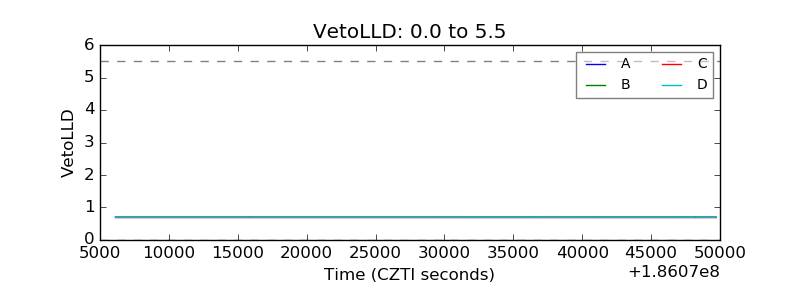 |
| Alpha Counter |  |
| _CPM_Rate | 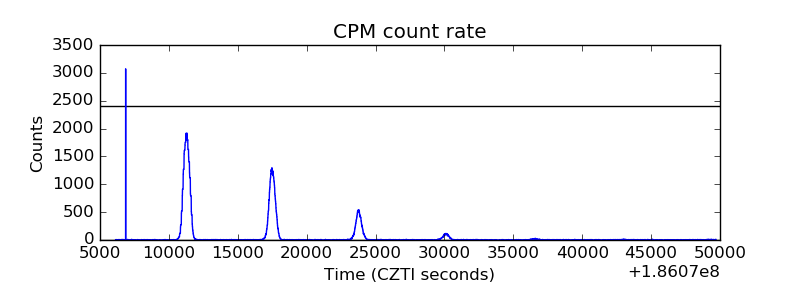 |
| CZT Counter | 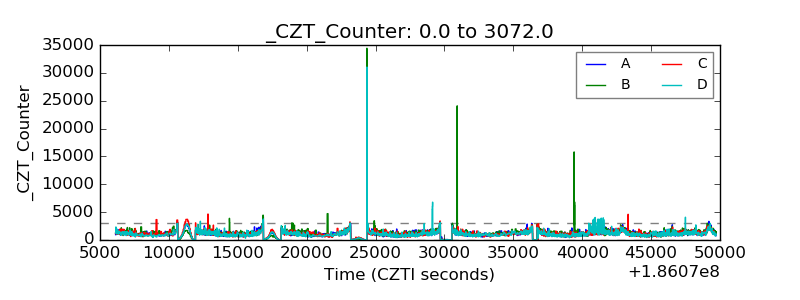 |
| +2.5 Volts monitor | 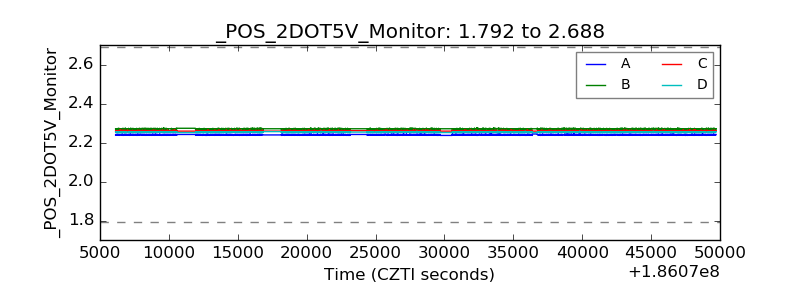 |
| +5 Volts monitor |  |
| _ROLL_ROT |  |
| _Roll_DEC | 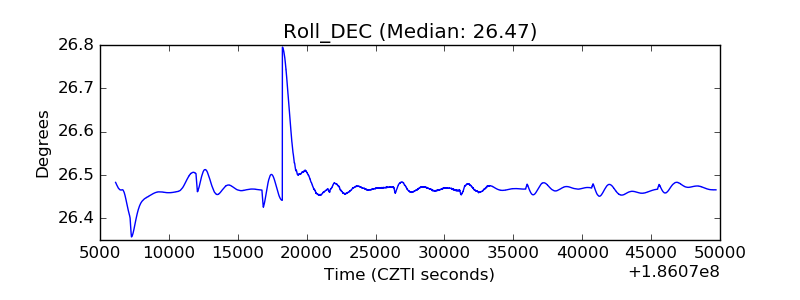 |
| _Roll_RA |  |
| Veto Counter |  |