| Param | Original file | Final file |
|---|---|---|
| Filename | modeM0/AS1P01_165T02_9000000120_00853cztM0_level2.evt | modeM0/AS1P01_165T02_9000000120_00853cztM0_level2_quad_clean.evt |
| Size (bytes) | 938,589,120 | 61,352,640 |
| Size | 895.1 MB | 58.5 MB |
| Events in quadrant A | 6,915,691 | 369,741 |
| Events in quadrant B | 7,637,936 | 366,648 |
| Events in quadrant C | 6,908,375 | 363,210 |
| Events in quadrant D | 6,582,792 | 357,000 |
| Mode SS | |||
|---|---|---|---|
| Quadrant | BADHDUFLAG | Total packets | Discarded packets |
| A | 0 | 118 | 0 |
| B | 0 | 118 | 0 |
| C | 0 | 118 | 0 |
| D | 0 | 118 | 0 |
| Mode M0 | |||
|---|---|---|---|
| Quadrant | BADHDUFLAG | Total packets | Discarded packets |
| A | 0 | 24576 | 0 |
| B | 0 | 26775 | 0 |
| C | 0 | 24612 | 0 |
| D | 0 | 23677 | 0 |
| Mode M9 | |||
|---|---|---|---|
| Quadrant | BADHDUFLAG | Total packets | Discarded packets |
| A | 0 | 13 | 0 |
| B | 0 | 13 | 0 |
| C | 0 | 13 | 0 |
| D | 0 | 13 | 0 |
| Quadrant | Total seconds | Saturated seconds | Saturation percentage |
|---|---|---|---|
| A | 5730 | 25 | 0.436300% |
| B | 5730 | 60 | 1.047120% |
| C | 5730 | 46 | 0.802792% |
| D | 5729 | 86 | 1.501135% |
Noise dominated data is calculated using 1-second bins in cleaned event files. If a bin has >2000 counts, and if more than 50% of those come from <1% of pixels, then it is considered to be noise-dominated and hence unusable.
| Quadrant | # 1 sec bins | Bins with >0 counts | Bins with >2000 counts | High rate bins dominated by noise | Noise dominated (total time) | Noise dominated (detector-on time) | Marked lightcurve |
|---|---|---|---|---|---|---|---|
| A | 7055 | 5730 | 193 | 193 | 2.74% | 3.37% | 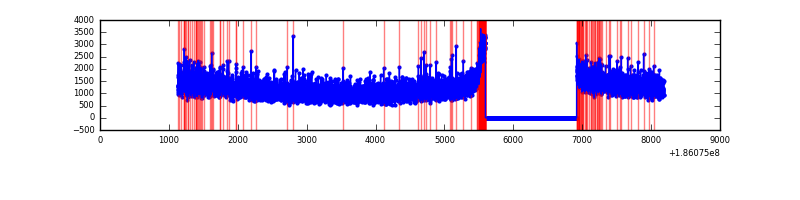 |
| B | 7055 | 5730 | 352 | 352 | 4.99% | 6.14% |  |
| C | 7055 | 5730 | 189 | 189 | 2.68% | 3.30% | 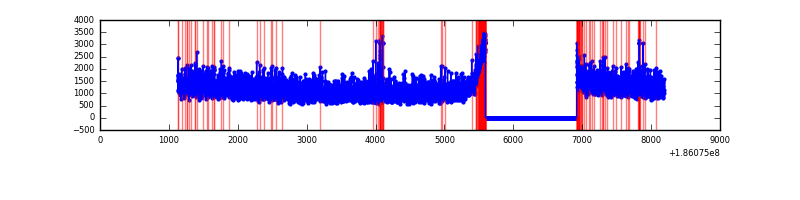 |
| D | 7054 | 5730 | 244 | 244 | 3.46% | 4.26% |  |
Top three noisy pixels from each quadrant. If the there are fewer than three noisy pixels in the level2.evt file, extra rows are filled as -1
| Pixel properties | Quadrant properties | ||||||
|---|---|---|---|---|---|---|---|
| Quadrant | DetID | PixID | Counts | Sigma | Mean | Median | Sigma |
| A | 12 | 189 | 7723 | 13.8 | 1798 | 1817 | 428.0 |
| A | 15 | 17 | 6922 | 11.93 | 1798 | 1817 | 428.0 |
| A | 11 | 79 | 6684 | 11.37 | 1798 | 1817 | 428.0 |
| B | 8 | 38 | 204166 | 461.02 | 1885 | 1901 | 438.7 |
| B | 0 | 184 | 52223 | 114.7 | 1885 | 1901 | 438.7 |
| B | 3 | 204 | 51161 | 112.28 | 1885 | 1901 | 438.7 |
| C | 9 | 83 | 68491 | 139.26 | 1730 | 1799 | 478.9 |
| C | 15 | 241 | 23444 | 45.2 | 1730 | 1799 | 478.9 |
| C | 3 | 111 | 20887 | 39.86 | 1730 | 1799 | 478.9 |
| D | 1 | 4 | 170589 | 350.81 | 1681 | 1715 | 481.4 |
| D | 2 | 16 | 42619 | 84.97 | 1681 | 1715 | 481.4 |
| D | 10 | 85 | 21052 | 40.17 | 1681 | 1715 | 481.4 |
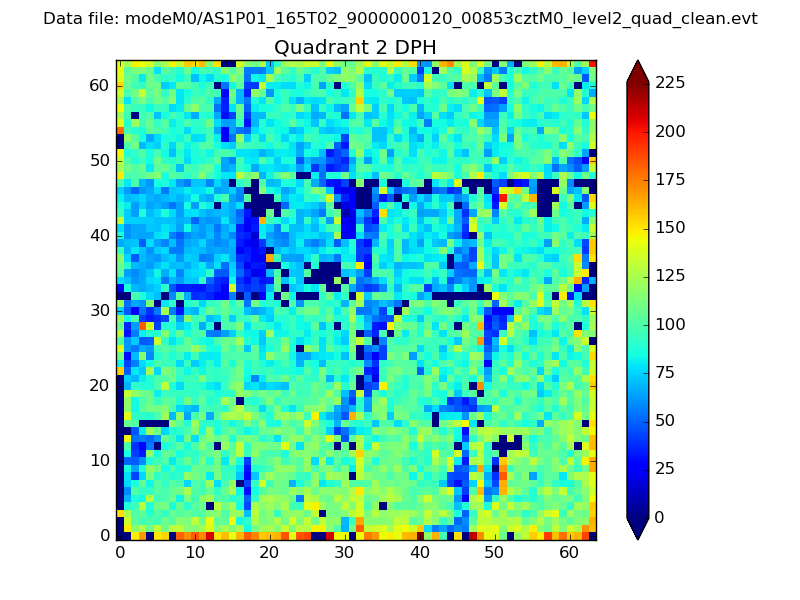
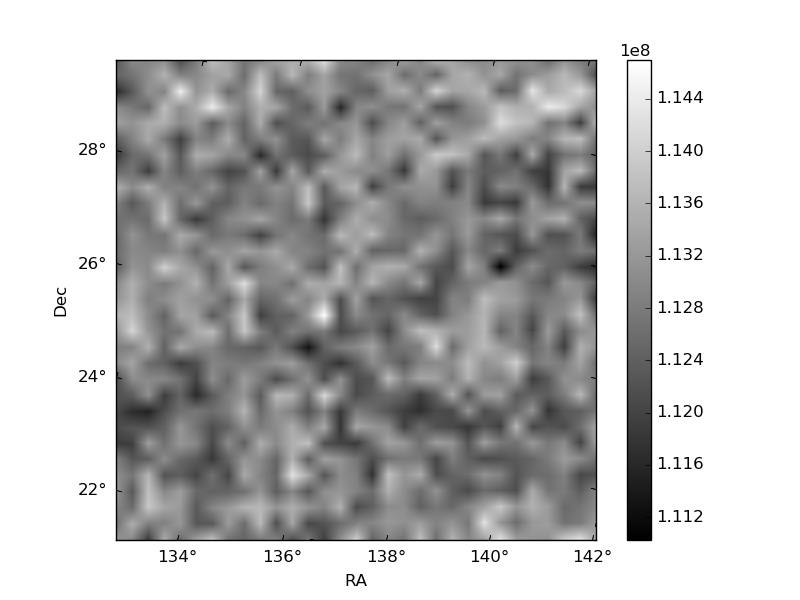
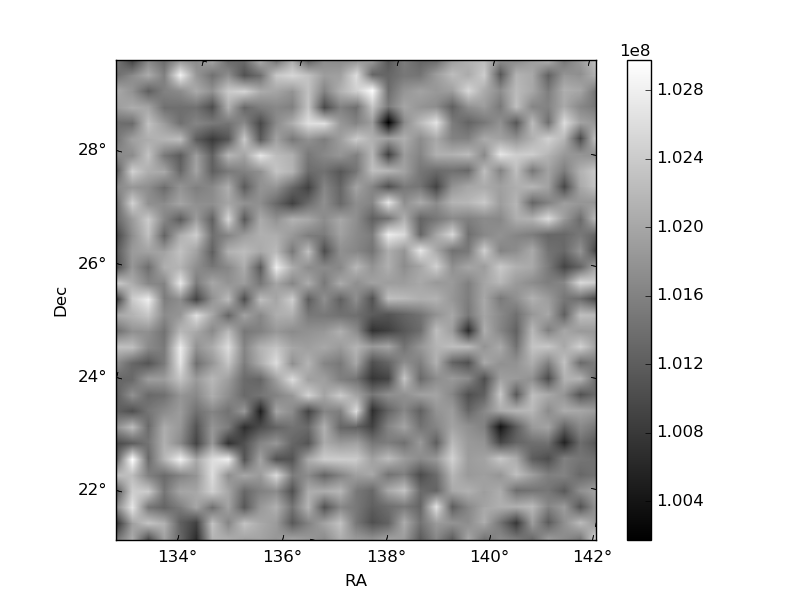
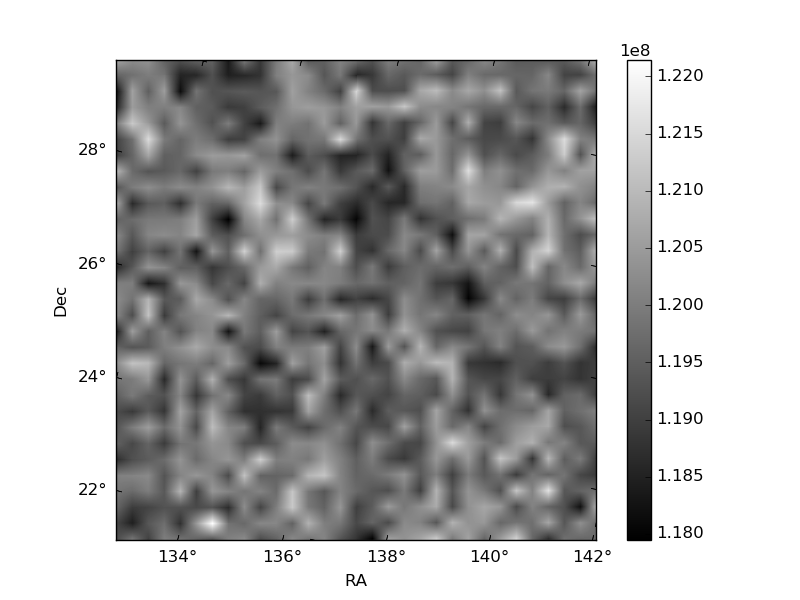
Histogram calculated using DETX and DETY for each event in the final _common_clean file
| Quadrant A | 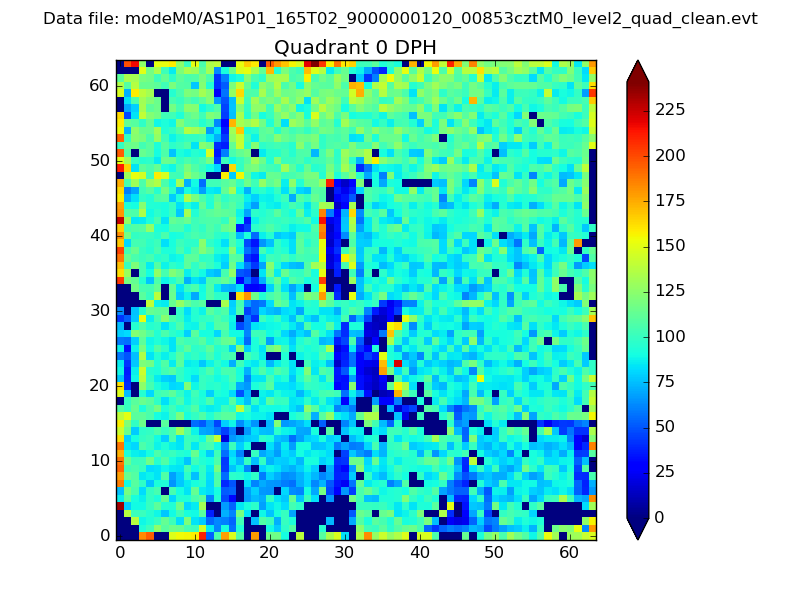 |
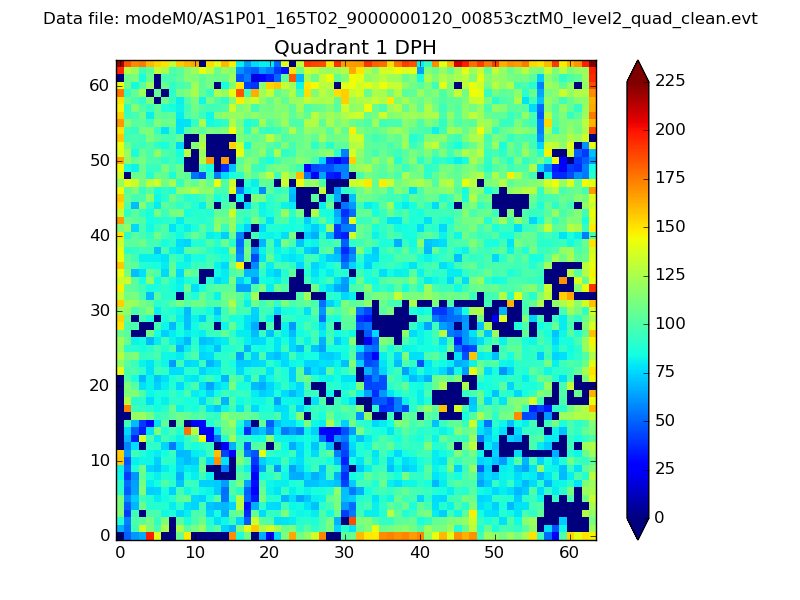 |
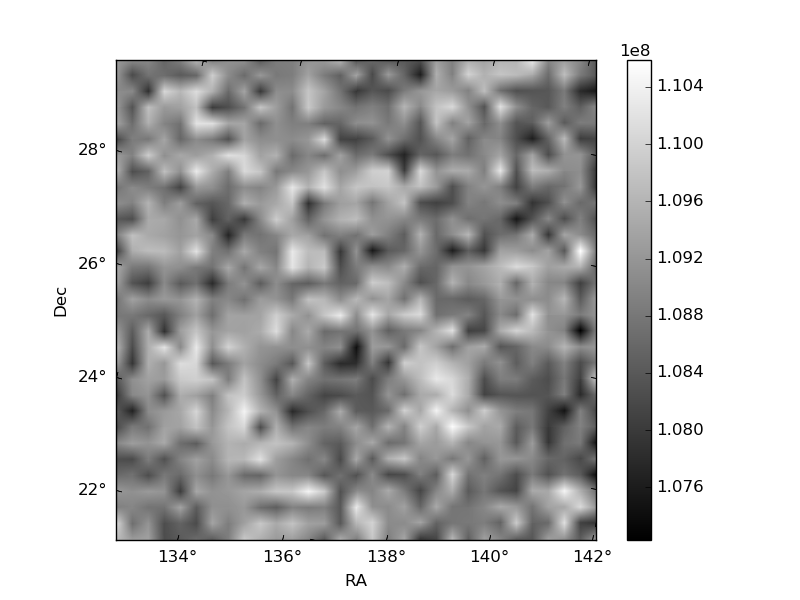
Quadrant B |
|---|---|---|---|
| Quadrant D | 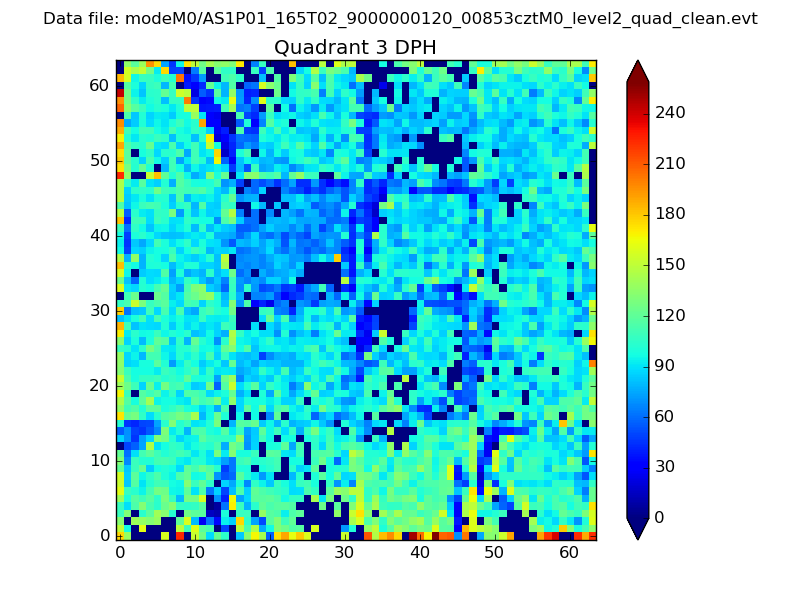 |
 |
Quadrant C |
| Plot type | Count rate plots | Images |
|---|---|---|
| Comparison with Poisson distribution Blue bars denote a histogram of data divided into 1 sec bins. Red curve is a Poisson curve with rate = median count rate of data. |
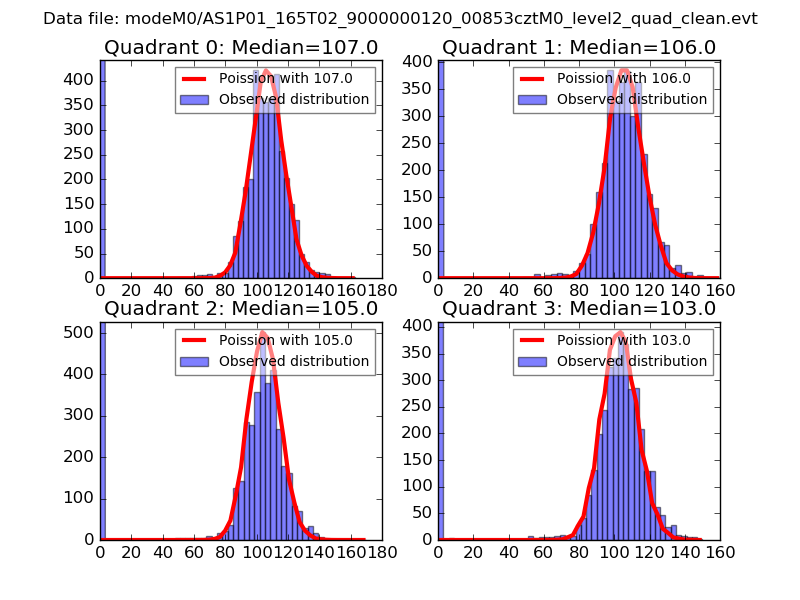 |
 |
| Quadrant-wise count rates Data is divided into 100 sec bins |
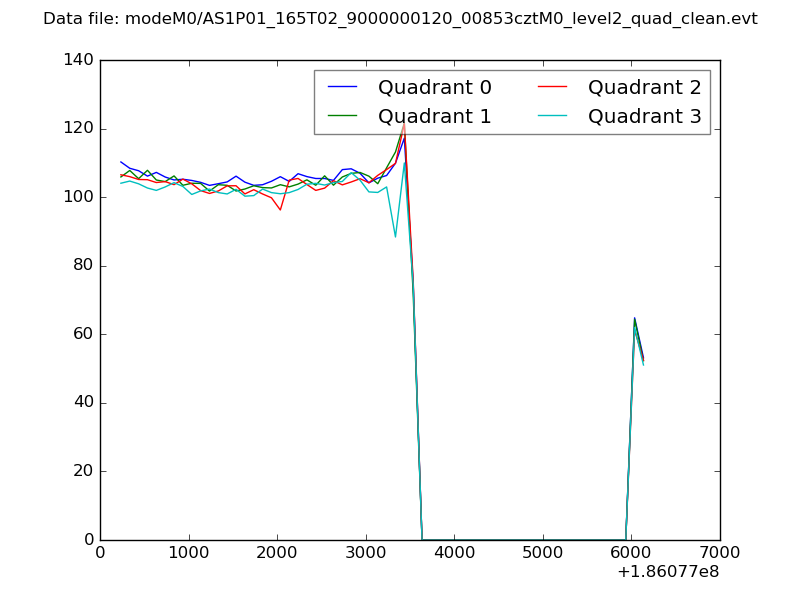 |
|
| Module-wise count rates for Quadrant A Data is divided into 100 sec bins |
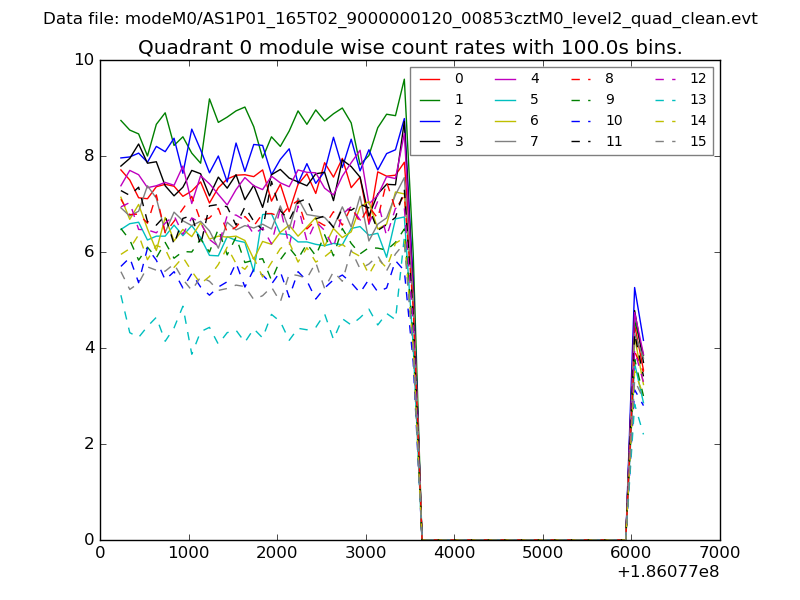 |
 |
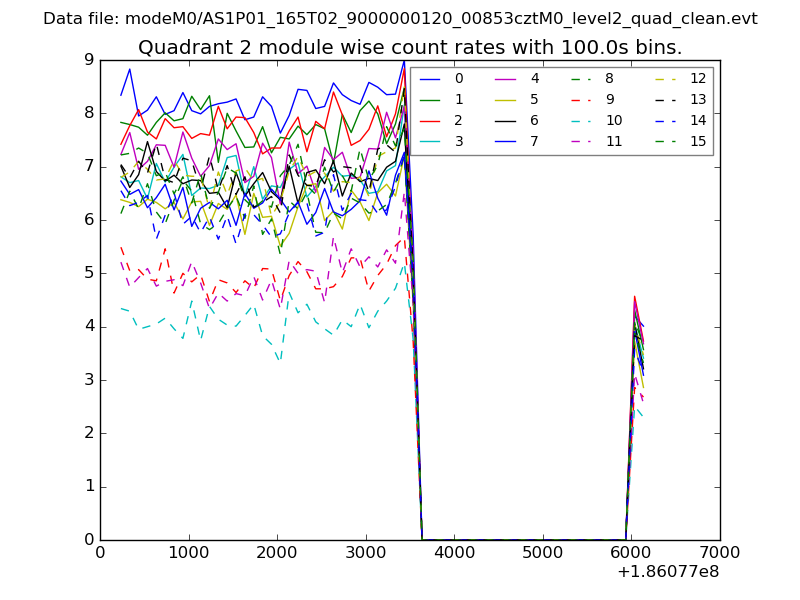
| Module-wise count rates for Quadrant B Data is divided into 100 sec bins |
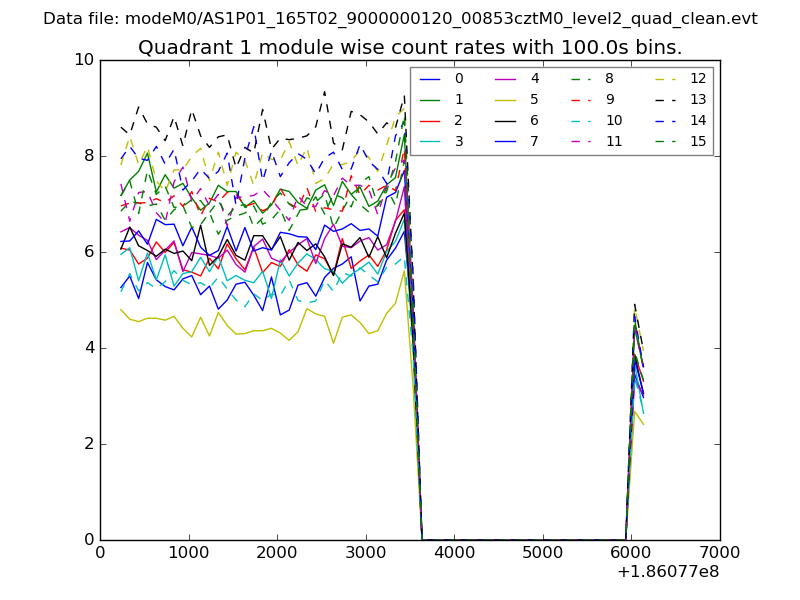 |
 |
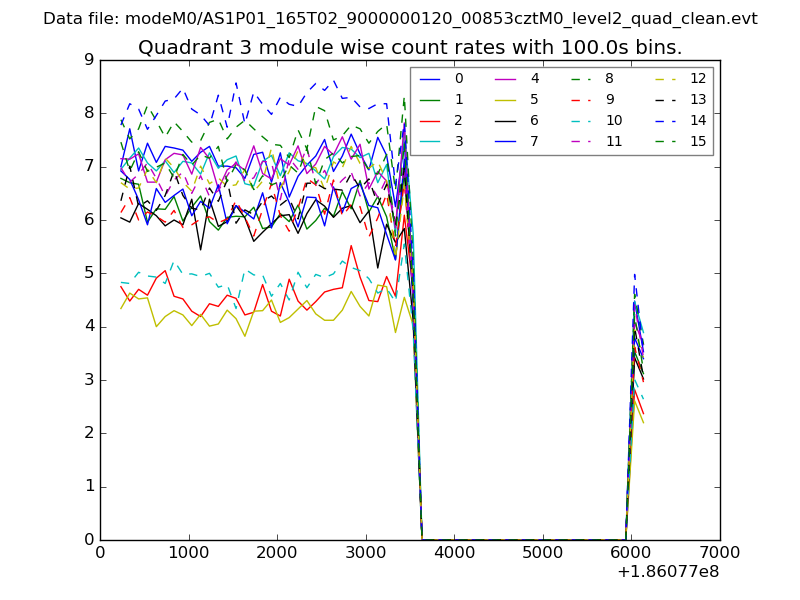
| Module-wise count rates for Quadrant C Data is divided into 100 sec bins |
 |
 |
| Module-wise count rates for Quadrant D Data is divided into 100 sec bins |
 |
 |
| Parameter | Plot |
|---|---|
| CZT HV Monitor | 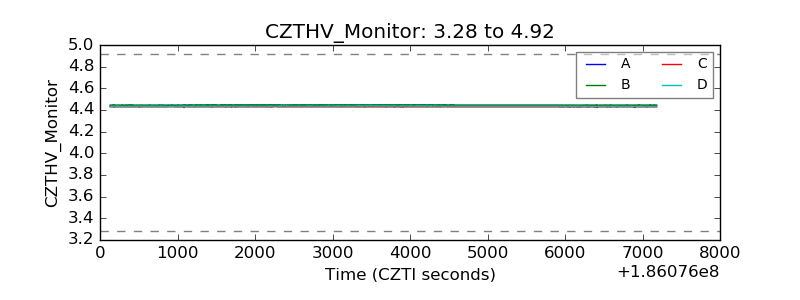 |
| D_VDD | 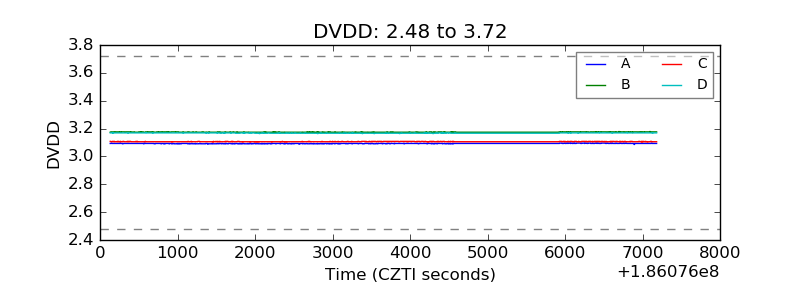 |
| Temperature 1 | 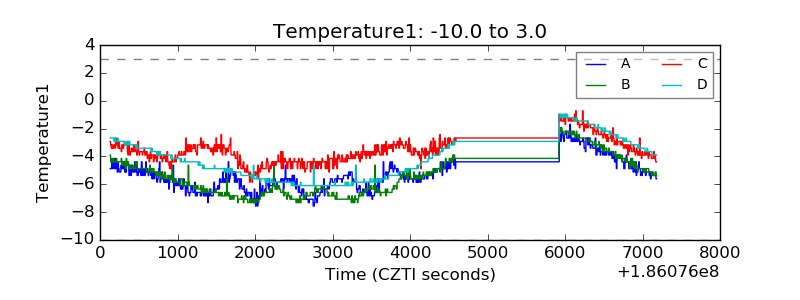 |
| Veto HV Monitor | 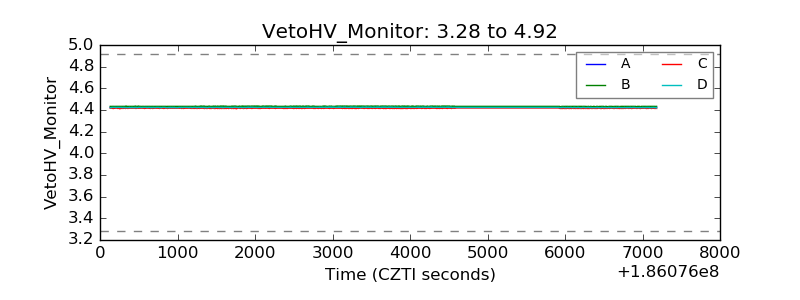 |
| Veto LLD | 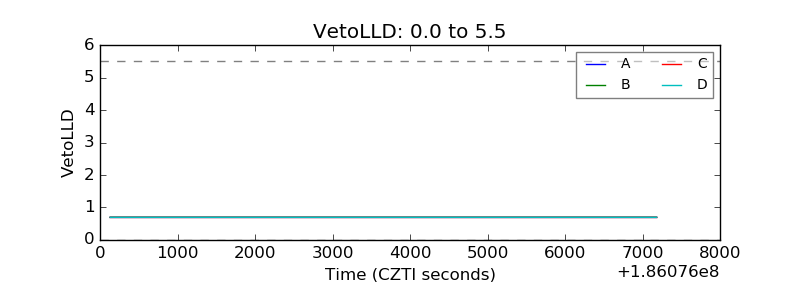 |
| Alpha Counter |  |
| _CPM_Rate | 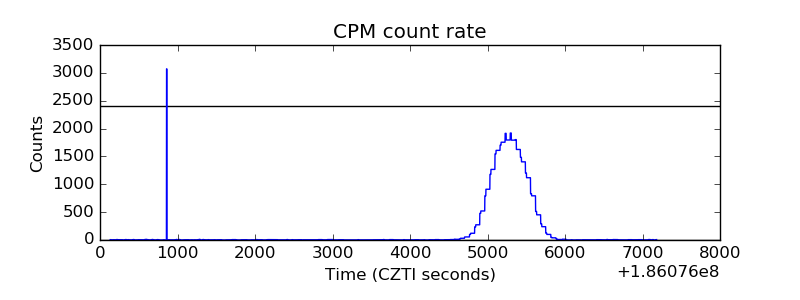 |
| CZT Counter | 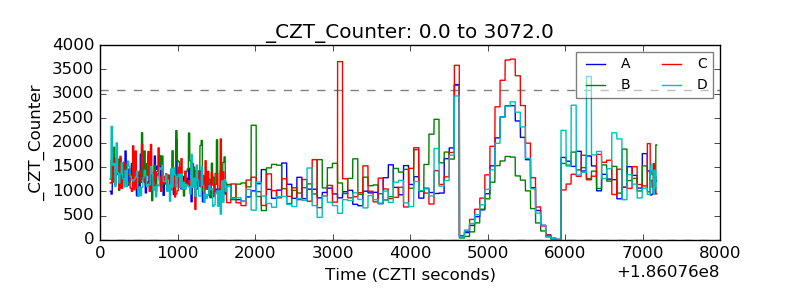 |
| +2.5 Volts monitor |  |
| +5 Volts monitor |  |
| _ROLL_ROT | 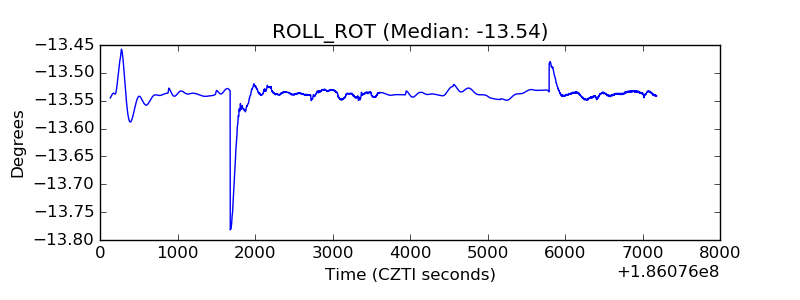 |
| _Roll_DEC | 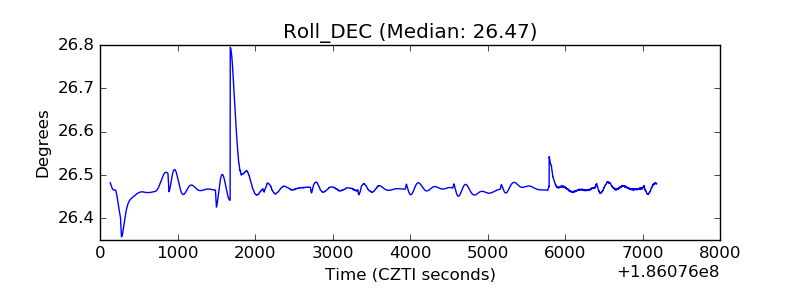 |
| _Roll_RA |  |
| Veto Counter | 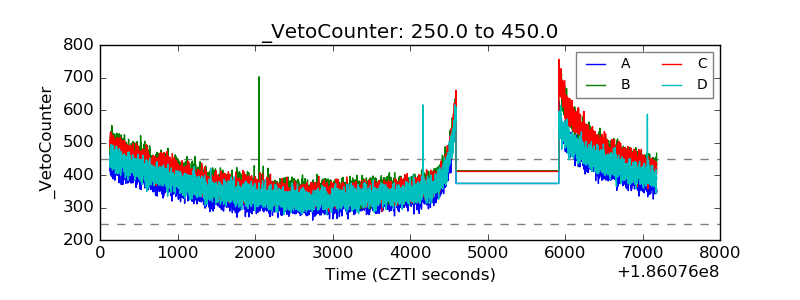 |