| Param | Original file | Final file |
|---|---|---|
| Filename | modeM0/AS1P01_165T02_9000000120_00854cztM0_level2.evt | modeM0/AS1P01_165T02_9000000120_00854cztM0_level2_quad_clean.evt |
| Size (bytes) | 953,403,840 | 72,541,440 |
| Size | 909.2 MB | 69.2 MB |
| Events in quadrant A | 7,109,373 | 449,193 |
| Events in quadrant B | 7,798,467 | 448,240 |
| Events in quadrant C | 7,026,832 | 445,311 |
| Events in quadrant D | 6,546,959 | 440,579 |
| Mode SS | |||
|---|---|---|---|
| Quadrant | BADHDUFLAG | Total packets | Discarded packets |
| A | 0 | 120 | 0 |
| B | 0 | 120 | 0 |
| C | 0 | 120 | 0 |
| D | 0 | 120 | 0 |
| Mode M0 | |||
|---|---|---|---|
| Quadrant | BADHDUFLAG | Total packets | Discarded packets |
| A | 0 | 25325 | 0 |
| B | 0 | 27332 | 0 |
| C | 0 | 25078 | 0 |
| D | 0 | 23726 | 0 |
| Mode M9 | |||
|---|---|---|---|
| Quadrant | BADHDUFLAG | Total packets | Discarded packets |
| A | 0 | 13 | 0 |
| B | 0 | 13 | 0 |
| C | 0 | 13 | 0 |
| D | 0 | 13 | 0 |
| Quadrant | Total seconds | Saturated seconds | Saturation percentage |
|---|---|---|---|
| A | 5914 | 33 | 0.557998% |
| B | 5914 | 70 | 1.183632% |
| C | 5913 | 39 | 0.659564% |
| D | 5913 | 20 | 0.338238% |
Noise dominated data is calculated using 1-second bins in cleaned event files. If a bin has >2000 counts, and if more than 50% of those come from <1% of pixels, then it is considered to be noise-dominated and hence unusable.
| Quadrant | # 1 sec bins | Bins with >0 counts | Bins with >2000 counts | High rate bins dominated by noise | Noise dominated (total time) | Noise dominated (detector-on time) | Marked lightcurve |
|---|---|---|---|---|---|---|---|
| A | 7214 | 5914 | 218 | 218 | 3.02% | 3.69% | 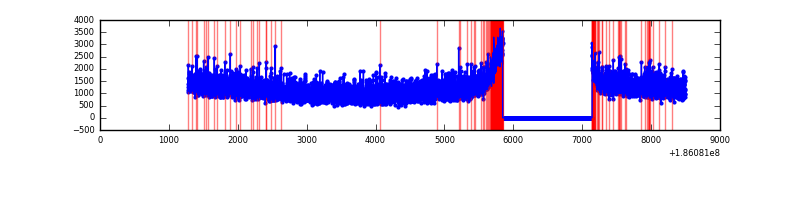 |
| B | 7214 | 5914 | 399 | 399 | 5.53% | 6.75% | 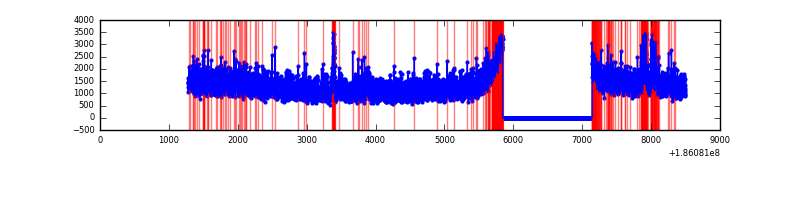 |
| C | 7213 | 5914 | 204 | 204 | 2.83% | 3.45% | 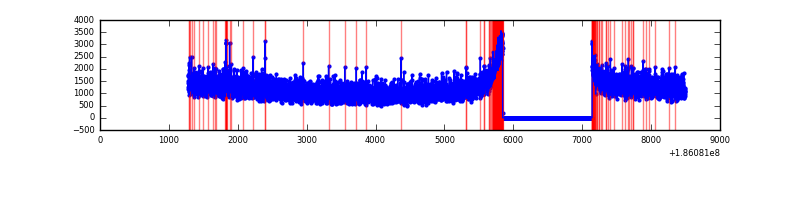 |
| D | 7213 | 5913 | 173 | 173 | 2.40% | 2.93% | 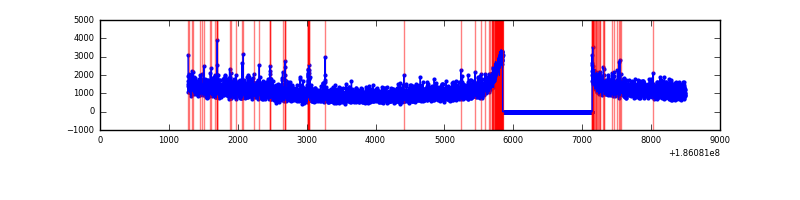 |
Top three noisy pixels from each quadrant. If the there are fewer than three noisy pixels in the level2.evt file, extra rows are filled as -1
| Pixel properties | Quadrant properties | ||||||
|---|---|---|---|---|---|---|---|
| Quadrant | DetID | PixID | Counts | Sigma | Mean | Median | Sigma |
| A | 14 | 79 | 17097 | 34.27 | 1846 | 1868 | 444.4 |
| A | 0 | 214 | 9215 | 16.53 | 1846 | 1868 | 444.4 |
| A | 11 | 79 | 6421 | 10.25 | 1846 | 1868 | 444.4 |
| B | 5 | 191 | 127033 | 274.24 | 1947 | 1959 | 456.1 |
| B | 0 | 184 | 95924 | 206.03 | 1947 | 1959 | 456.1 |
| B | 5 | 200 | 50726 | 106.93 | 1947 | 1959 | 456.1 |
| C | 9 | 83 | 22025 | 40.65 | 1780 | 1851 | 496.3 |
| C | 3 | 111 | 21362 | 39.31 | 1780 | 1851 | 496.3 |
| C | 15 | 241 | 19007 | 34.57 | 1780 | 1851 | 496.3 |
| D | 1 | 4 | 69863 | 130.49 | 1702 | 1761 | 521.9 |
| D | 7 | 207 | 33977 | 61.73 | 1702 | 1761 | 521.9 |
| D | 13 | 73 | 19929 | 34.81 | 1702 | 1761 | 521.9 |
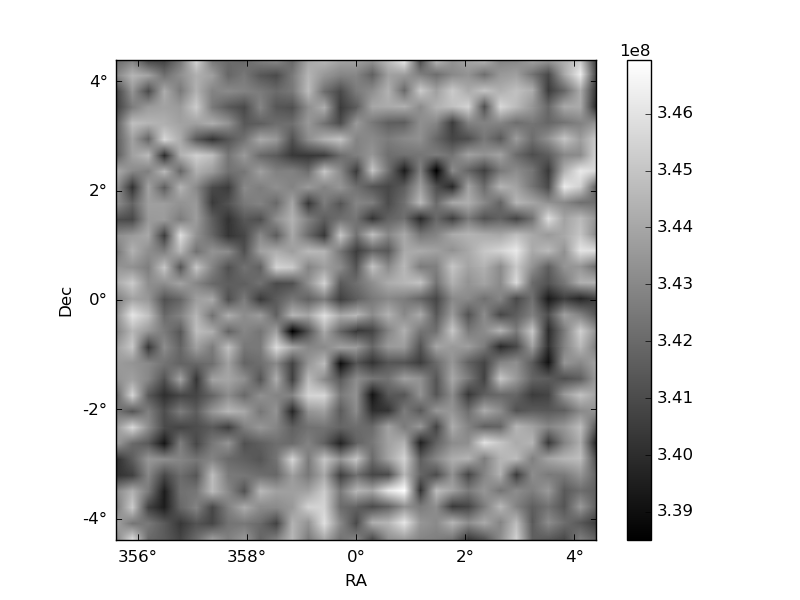
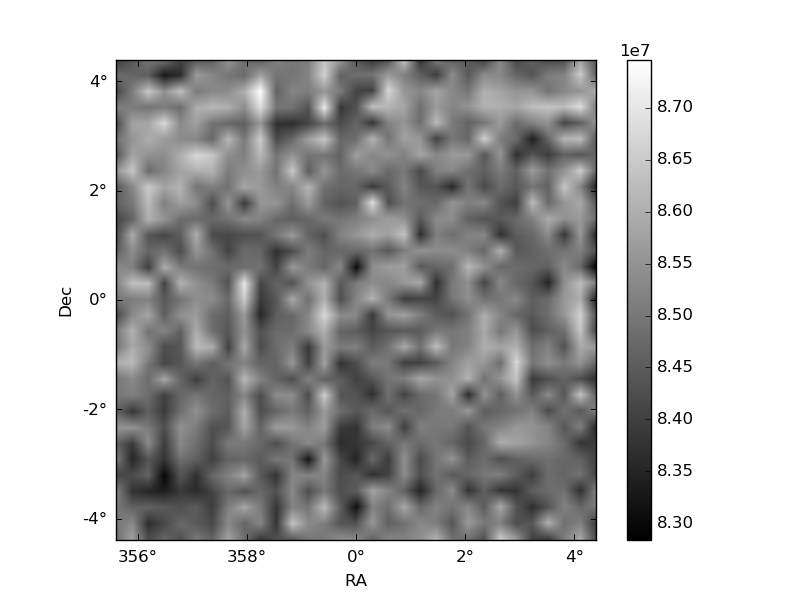
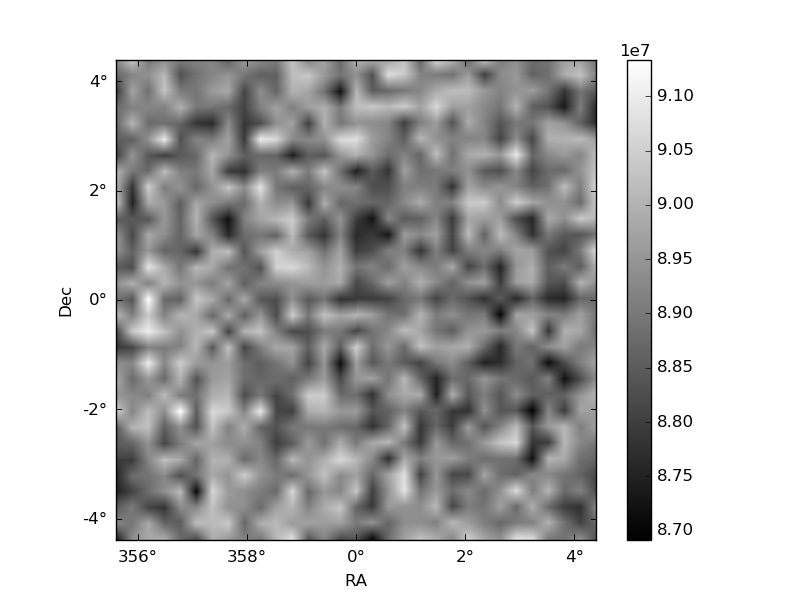
Histogram calculated using DETX and DETY for each event in the final _common_clean file
| Quadrant A | 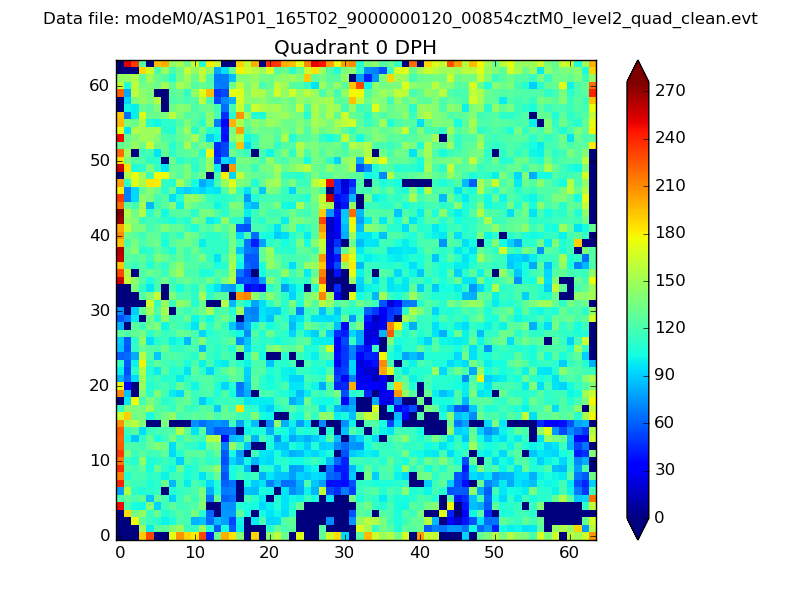 |
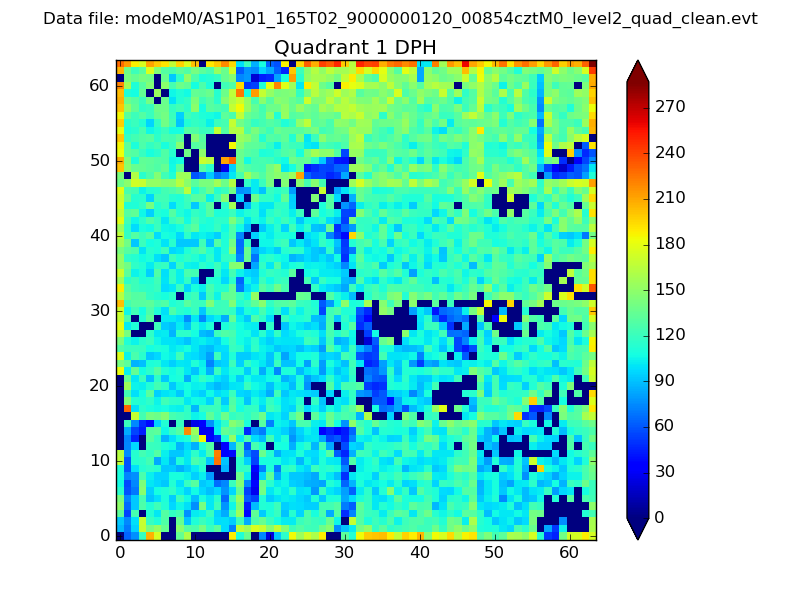 |
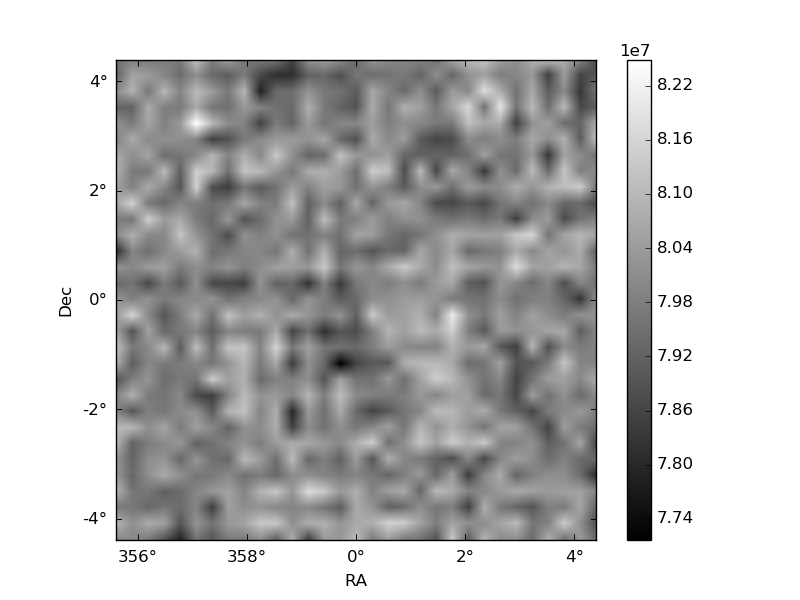
Quadrant B |
|---|---|---|---|
| Quadrant D | 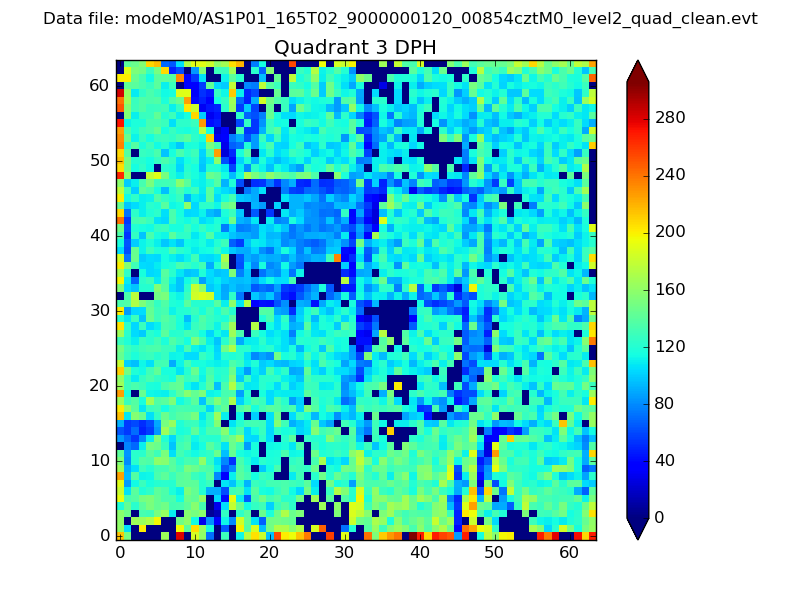 |
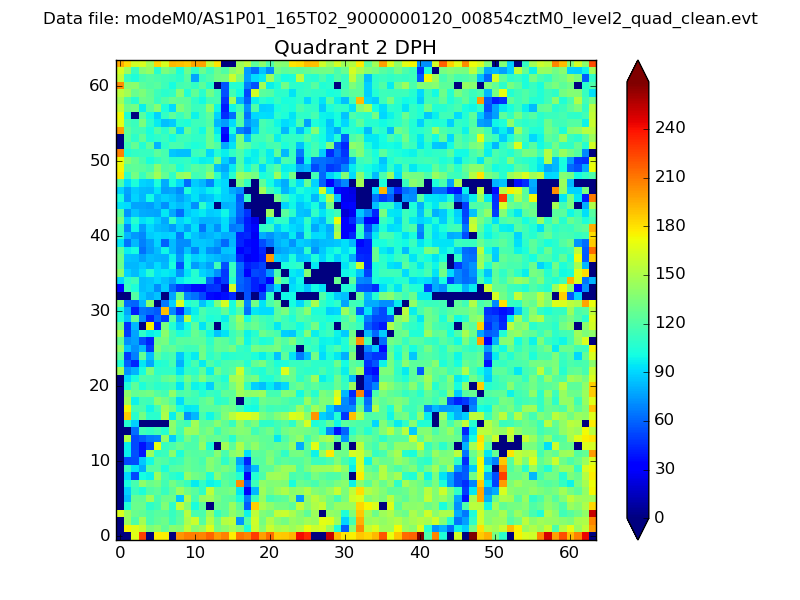 |
Quadrant C |
| Plot type | Count rate plots | Images |
|---|---|---|
| Comparison with Poisson distribution Blue bars denote a histogram of data divided into 1 sec bins. Red curve is a Poisson curve with rate = median count rate of data. |
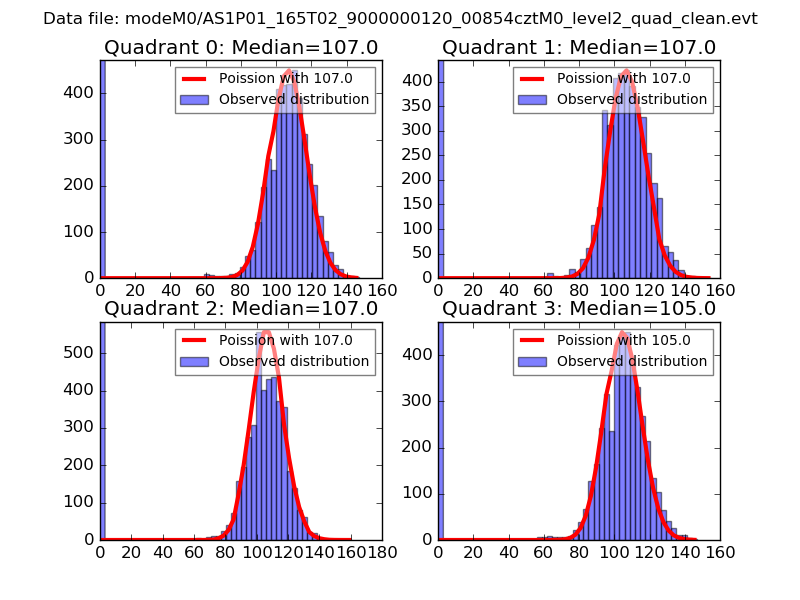 |
 |
| Quadrant-wise count rates Data is divided into 100 sec bins |
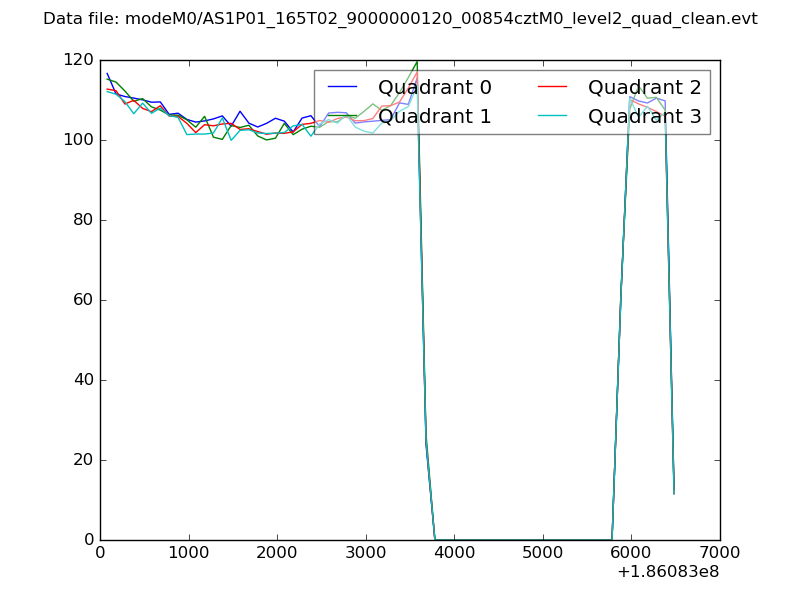 |
|
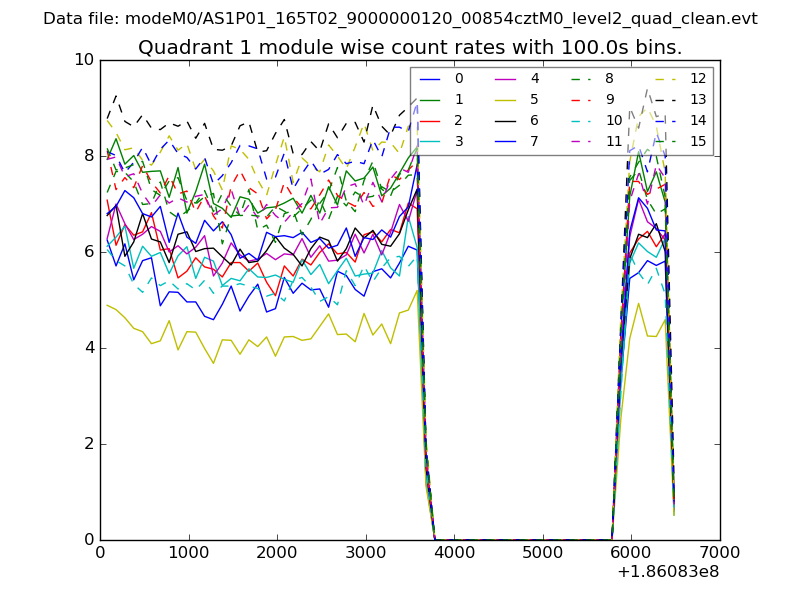
| Module-wise count rates for Quadrant A Data is divided into 100 sec bins |
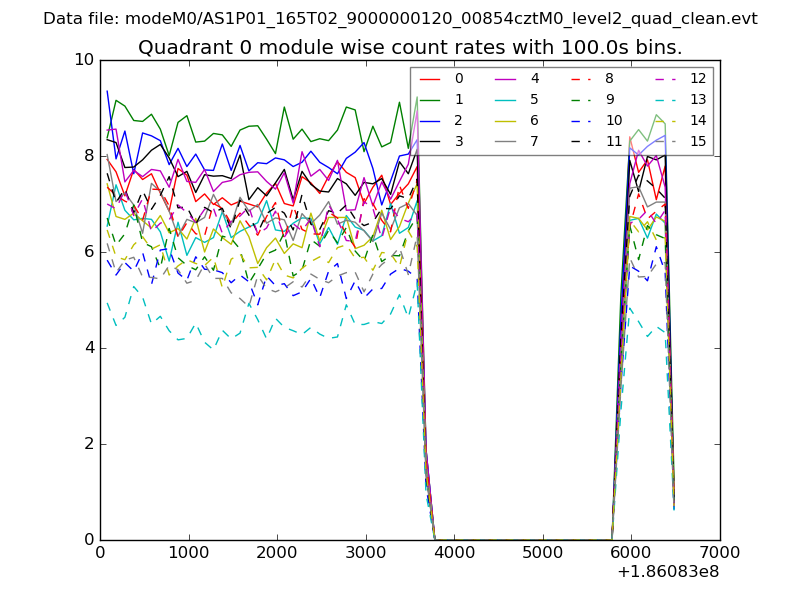 |
 |
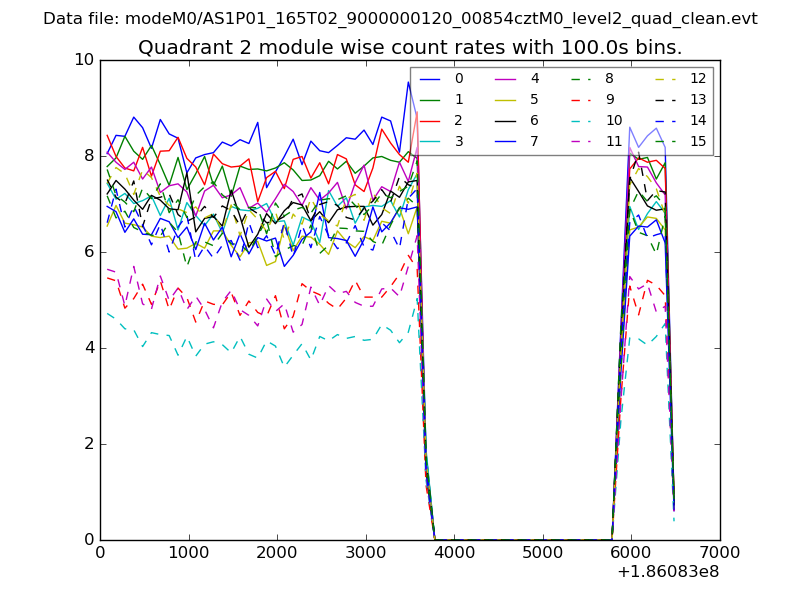
| Module-wise count rates for Quadrant B Data is divided into 100 sec bins |
 |
 |
| Module-wise count rates for Quadrant C Data is divided into 100 sec bins |
 |
 |
| Module-wise count rates for Quadrant D Data is divided into 100 sec bins |
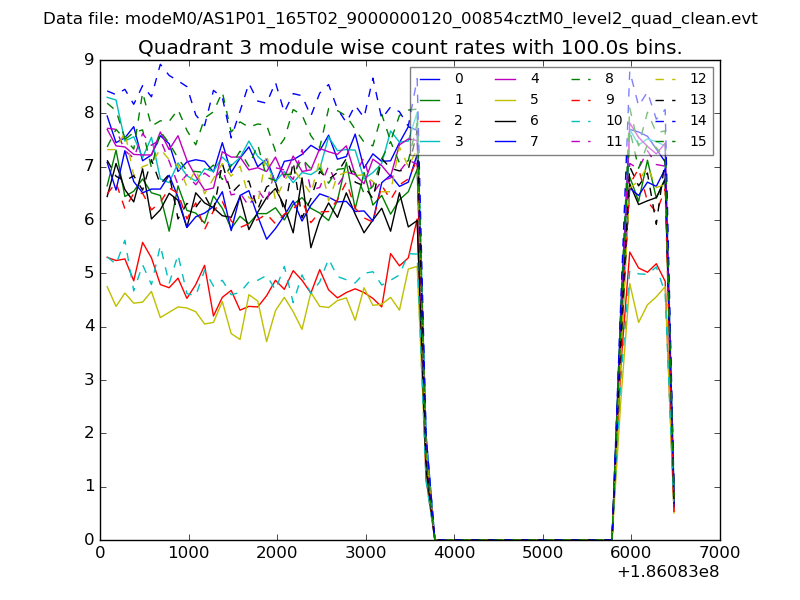 |
 |
| Parameter | Plot |
|---|---|
| CZT HV Monitor | 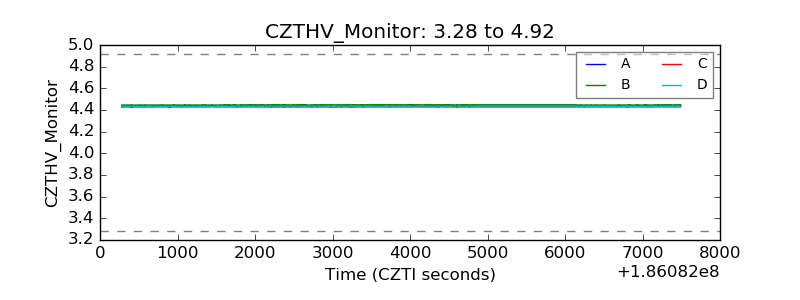 |
| D_VDD |  |
| Temperature 1 | 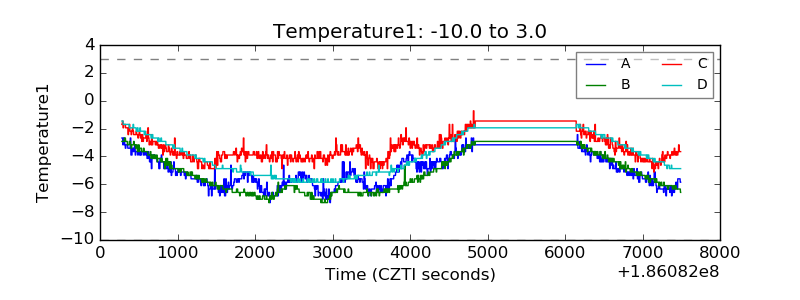 |
| Veto HV Monitor | 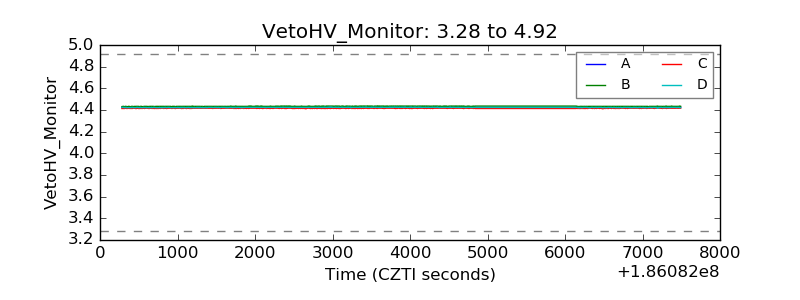 |
| Veto LLD | 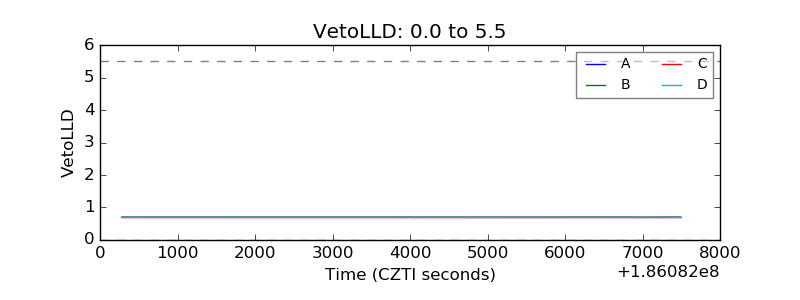 |
| Alpha Counter | 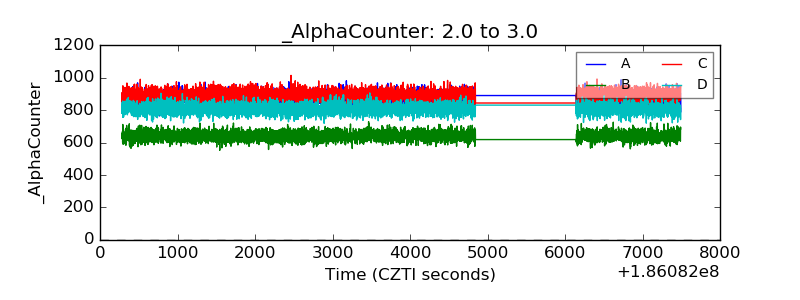 |
| _CPM_Rate | 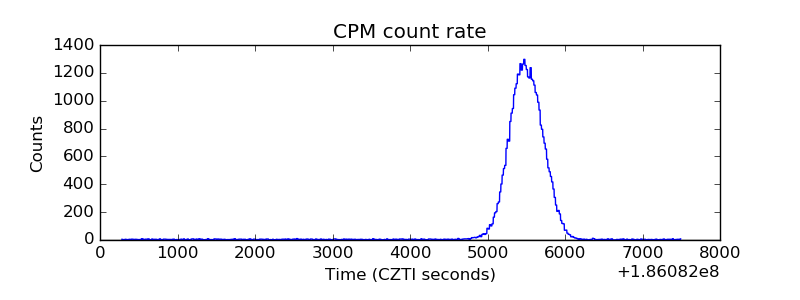 |
| CZT Counter |  |
| +2.5 Volts monitor |  |
| +5 Volts monitor |  |
| _ROLL_ROT | 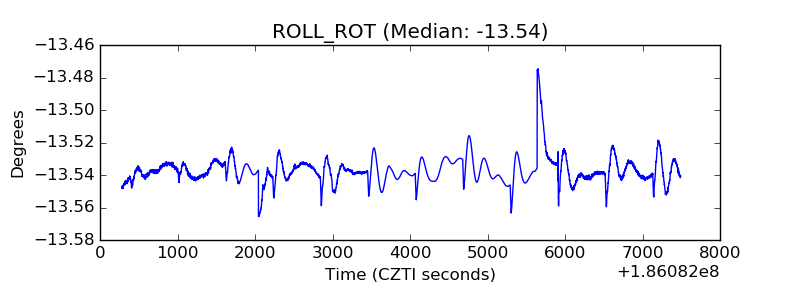 |
| _Roll_DEC | 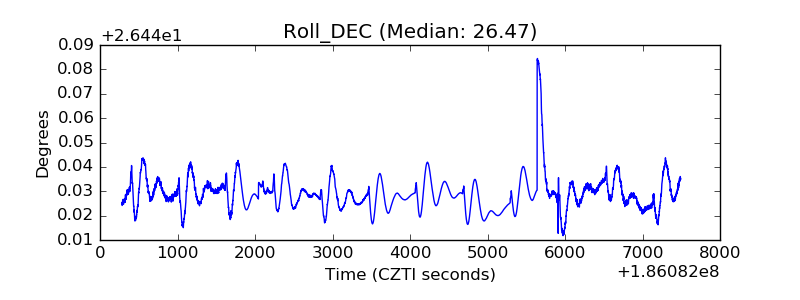 |
| _Roll_RA | 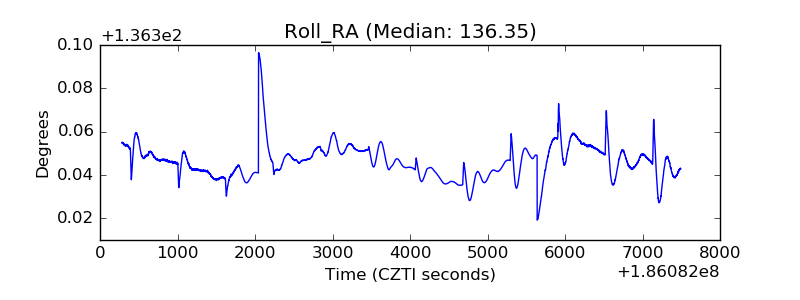 |
| Veto Counter | 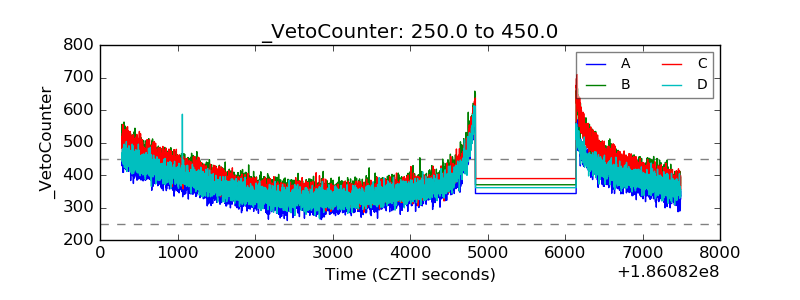 |