| Param | Original file | Final file |
|---|---|---|
| Filename | modeM0/AS1P01_165T02_9000000120_00857cztM0_level2.evt | modeM0/AS1P01_165T02_9000000120_00857cztM0_level2_quad_clean.evt |
| Size (bytes) | 1,143,164,160 | 83,240,640 |
| Size | 1.1 GB | 79.4 MB |
| Events in quadrant A | 8,646,630 | 510,722 |
| Events in quadrant B | 9,158,580 | 505,350 |
| Events in quadrant C | 8,420,439 | 498,108 |
| Events in quadrant D | 7,907,357 | 494,541 |
| Mode SS | |||
|---|---|---|---|
| Quadrant | BADHDUFLAG | Total packets | Discarded packets |
| A | 0 | 150 | 0 |
| B | 0 | 150 | 0 |
| C | 0 | 150 | 0 |
| D | 0 | 150 | 0 |
| Mode M0 | |||
|---|---|---|---|
| Quadrant | BADHDUFLAG | Total packets | Discarded packets |
| A | 0 | 30892 | 0 |
| B | 0 | 32448 | 0 |
| C | 0 | 30183 | 0 |
| D | 0 | 28816 | 0 |
| Mode M9 | |||
|---|---|---|---|
| Quadrant | BADHDUFLAG | Total packets | Discarded packets |
| A | 0 | 3 | 0 |
| B | 0 | 3 | 0 |
| C | 0 | 3 | 0 |
| D | 0 | 3 | 0 |
| Quadrant | Total seconds | Saturated seconds | Saturation percentage |
|---|---|---|---|
| A | 7350 | 10 | 0.136054% |
| B | 7350 | 34 | 0.462585% |
| C | 7351 | 5 | 0.068018% |
| D | 7350 | 20 | 0.272109% |
Noise dominated data is calculated using 1-second bins in cleaned event files. If a bin has >2000 counts, and if more than 50% of those come from <1% of pixels, then it is considered to be noise-dominated and hence unusable.
| Quadrant | # 1 sec bins | Bins with >0 counts | Bins with >2000 counts | High rate bins dominated by noise | Noise dominated (total time) | Noise dominated (detector-on time) | Marked lightcurve |
|---|---|---|---|---|---|---|---|
| A | 7695 | 7352 | 268 | 268 | 3.48% | 3.65% | 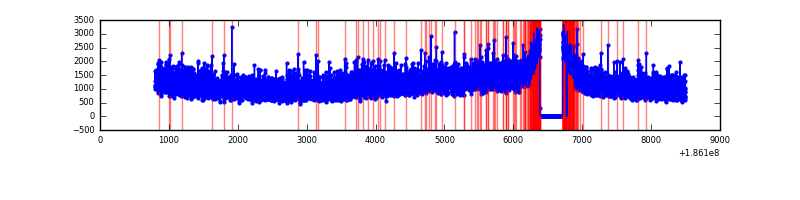 |
| B | 7695 | 7351 | 358 | 358 | 4.65% | 4.87% | 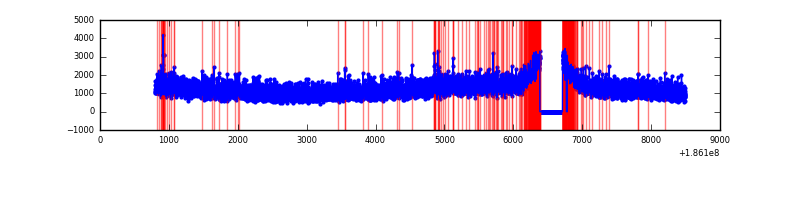 |
| C | 7696 | 7353 | 267 | 267 | 3.47% | 3.63% | 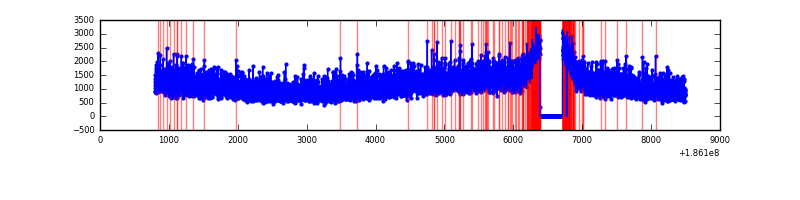 |
| D | 7695 | 7352 | 215 | 215 | 2.79% | 2.92% | 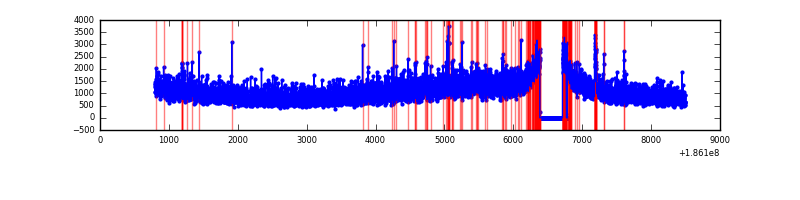 |
Top three noisy pixels from each quadrant. If the there are fewer than three noisy pixels in the level2.evt file, extra rows are filled as -1
| Pixel properties | Quadrant properties | ||||||
|---|---|---|---|---|---|---|---|
| Quadrant | DetID | PixID | Counts | Sigma | Mean | Median | Sigma |
| A | 14 | 79 | 23245 | 38.67 | 2243 | 2270 | 542.4 |
| A | 0 | 214 | 11859 | 17.68 | 2243 | 2270 | 542.4 |
| A | 11 | 79 | 8582 | 11.64 | 2243 | 2270 | 542.4 |
| B | 15 | 22 | 38378 | 64.66 | 2368 | 2381 | 556.7 |
| B | 5 | 249 | 32971 | 54.95 | 2368 | 2381 | 556.7 |
| B | 4 | 222 | 26952 | 44.14 | 2368 | 2381 | 556.7 |
| C | 3 | 111 | 28967 | 44.63 | 2137 | 2215 | 599.4 |
| C | 15 | 241 | 23403 | 35.35 | 2137 | 2215 | 599.4 |
| C | 3 | 79 | 17190 | 24.98 | 2137 | 2215 | 599.4 |
| D | 13 | 73 | 53666 | 80.79 | 2050 | 2126 | 638.0 |
| D | 13 | 13 | 48799 | 73.16 | 2050 | 2126 | 638.0 |
| D | 1 | 4 | 38142 | 56.46 | 2050 | 2126 | 638.0 |
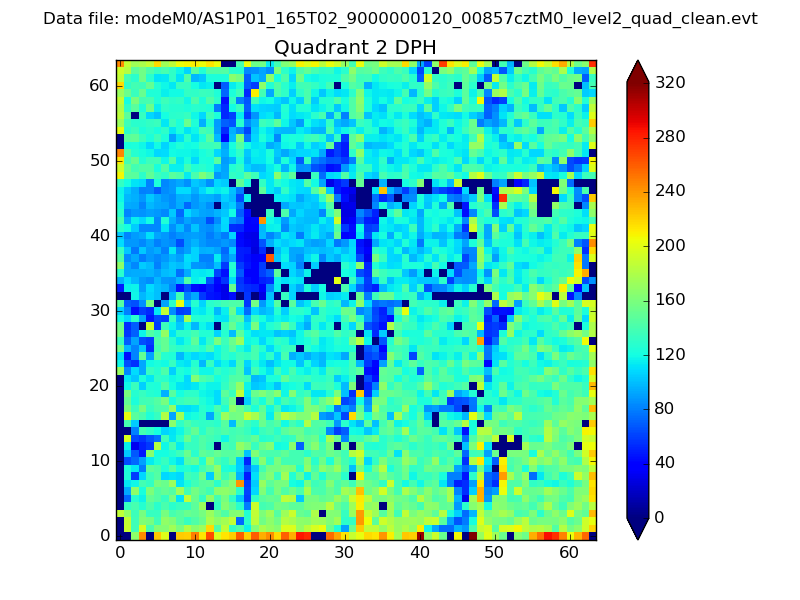
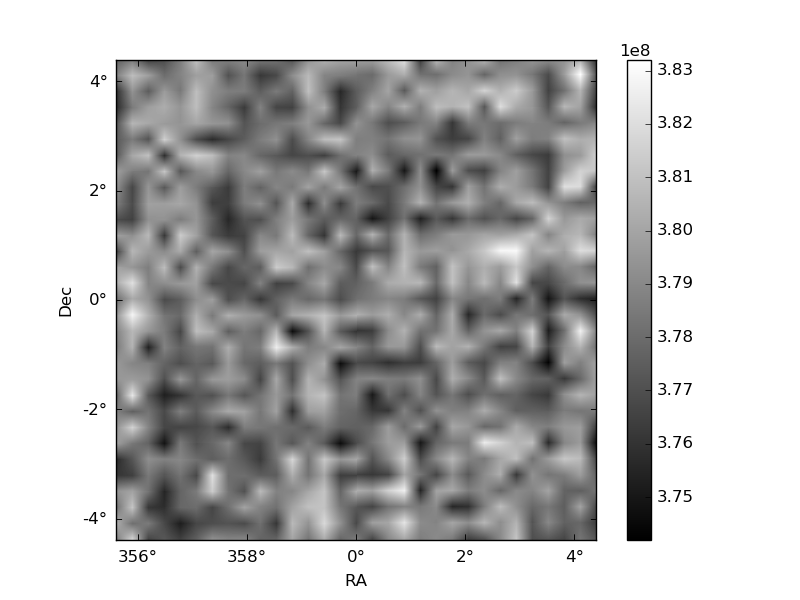
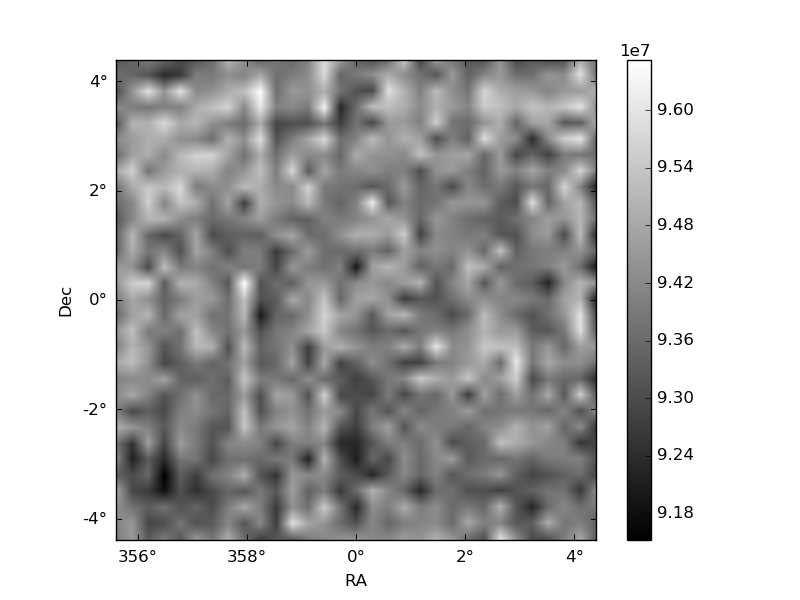
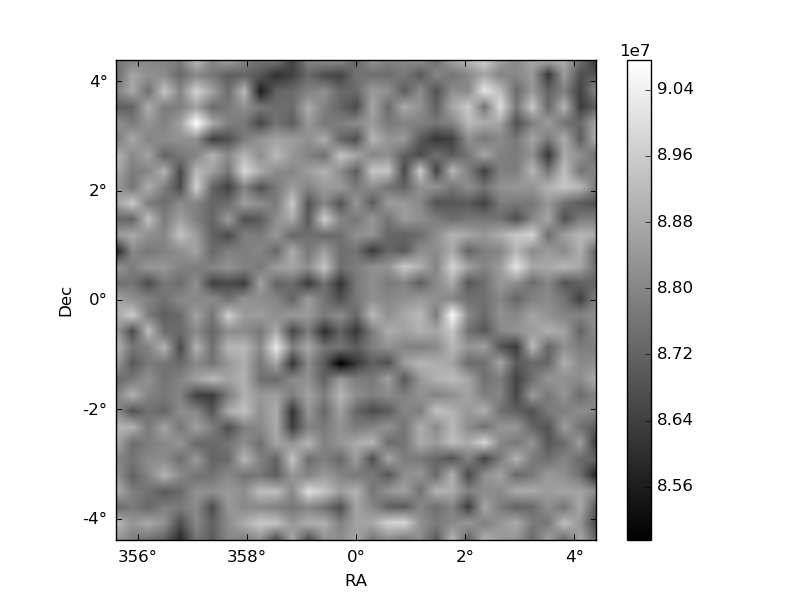
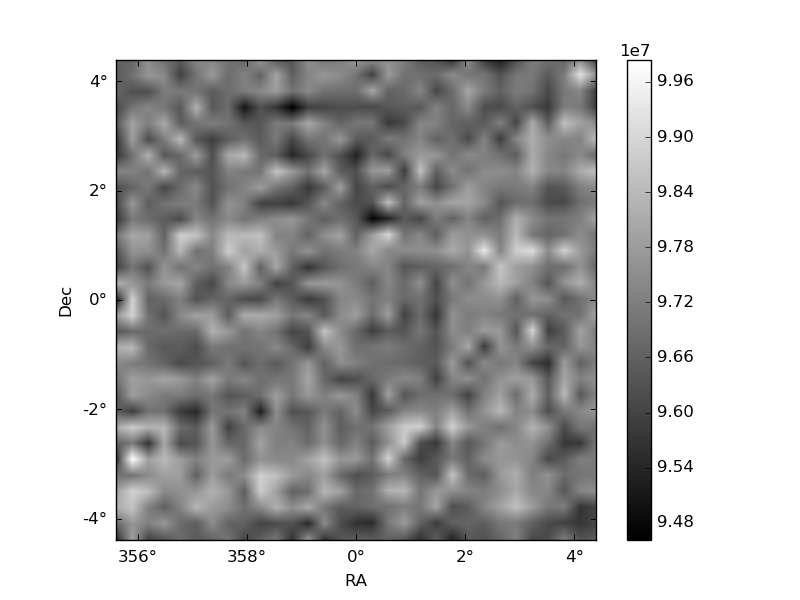
Histogram calculated using DETX and DETY for each event in the final _common_clean file
| Quadrant A | 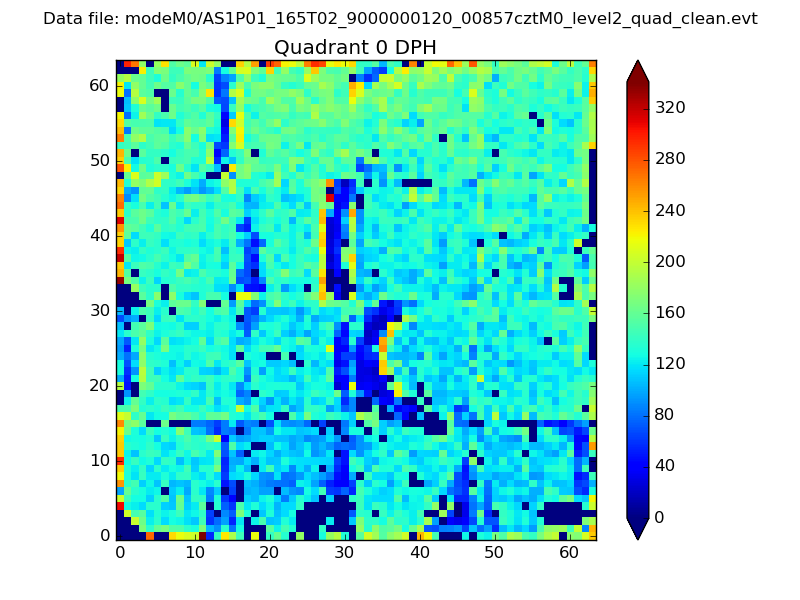 |
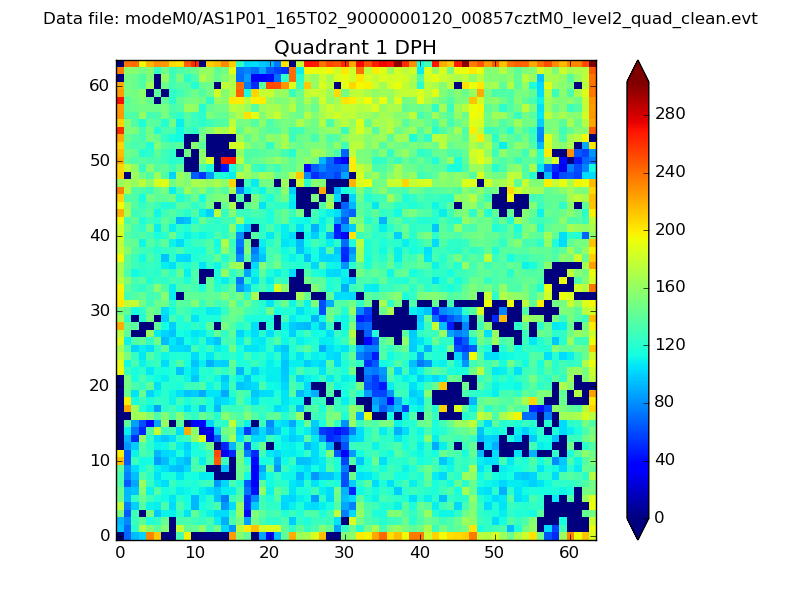 |
Quadrant B |
|---|---|---|---|
| Quadrant D | 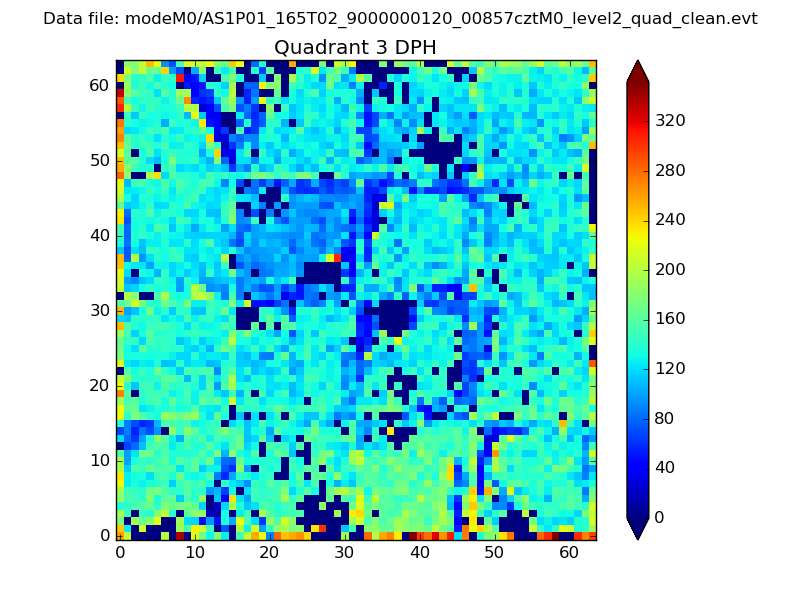 |
 |
Quadrant C |
| Plot type | Count rate plots | Images |
|---|---|---|
| Comparison with Poisson distribution Blue bars denote a histogram of data divided into 1 sec bins. Red curve is a Poisson curve with rate = median count rate of data. |
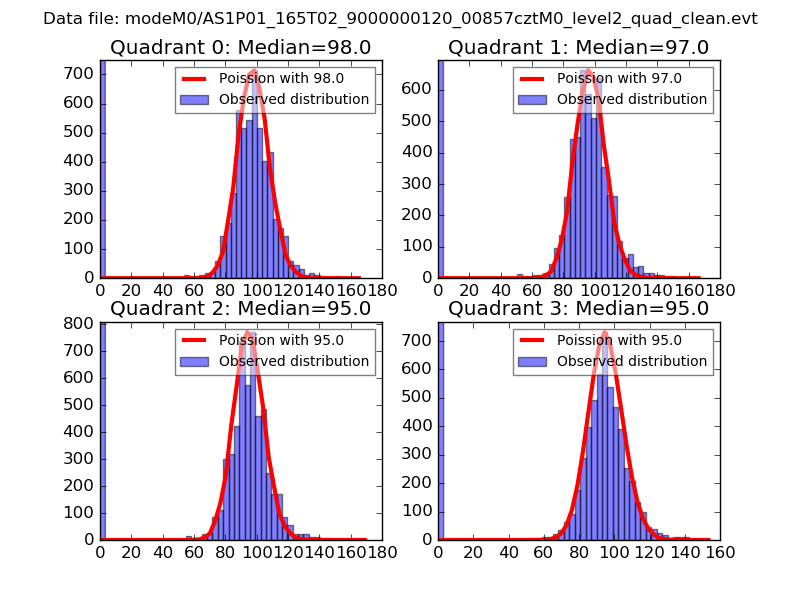 |
 |
| Quadrant-wise count rates Data is divided into 100 sec bins |
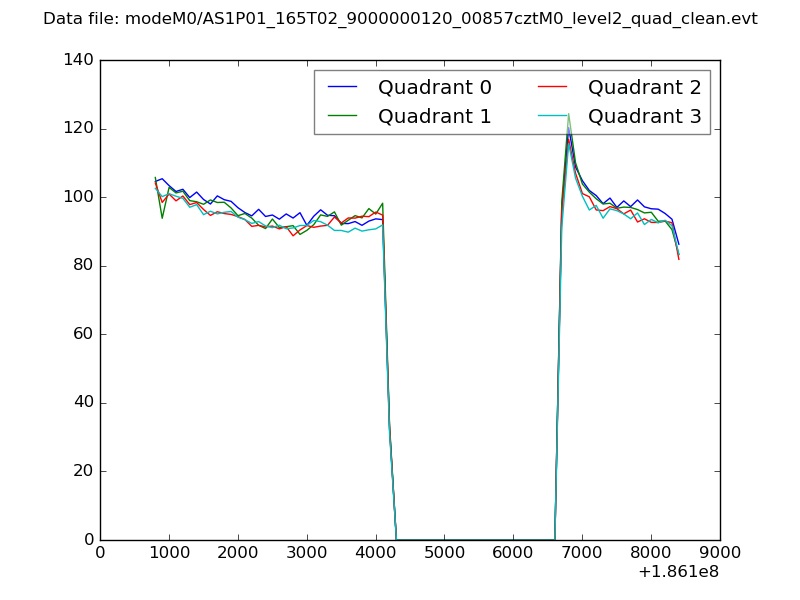 |
|
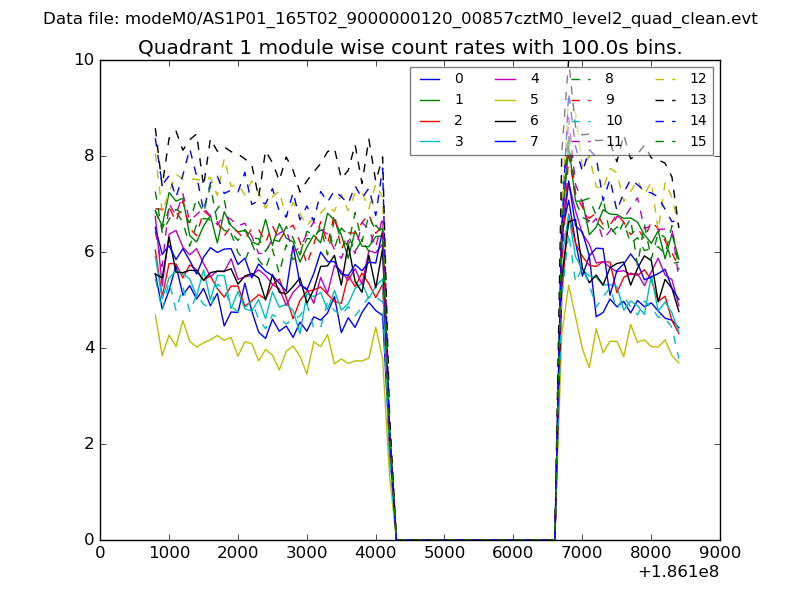
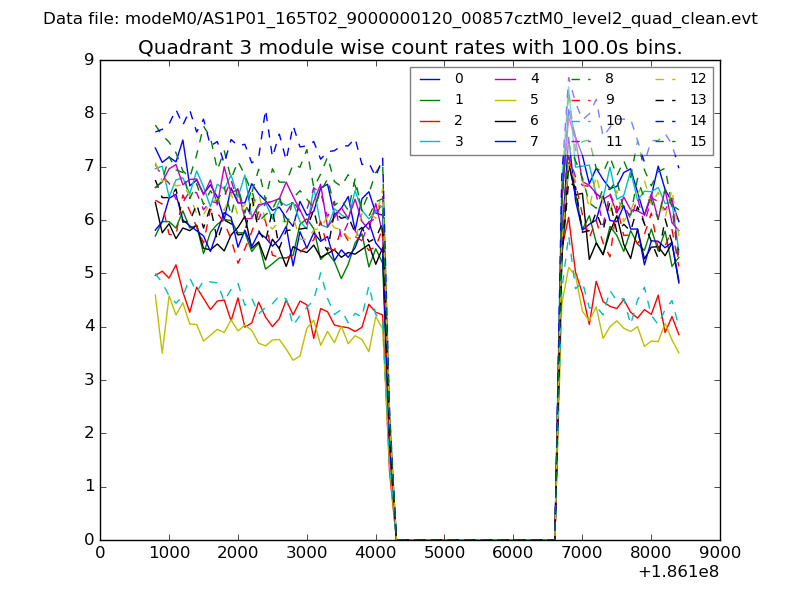
| Module-wise count rates for Quadrant A Data is divided into 100 sec bins |
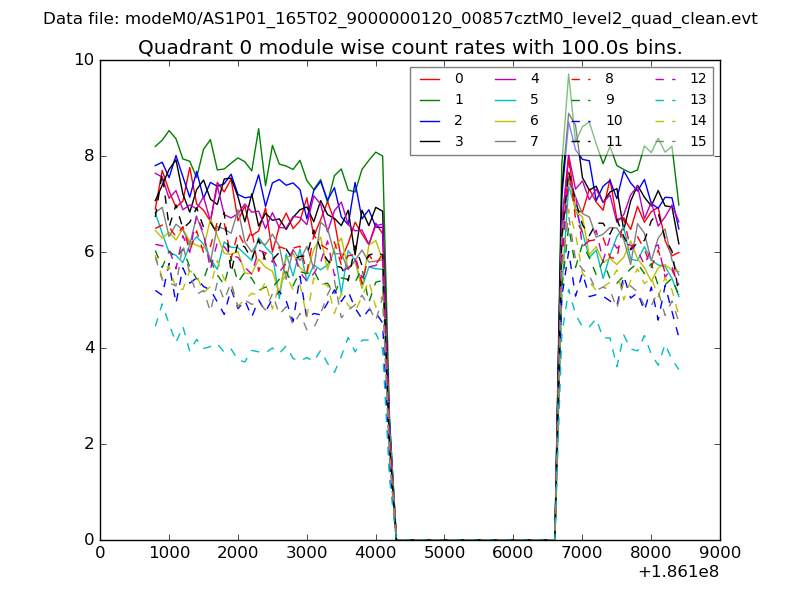 |
 |
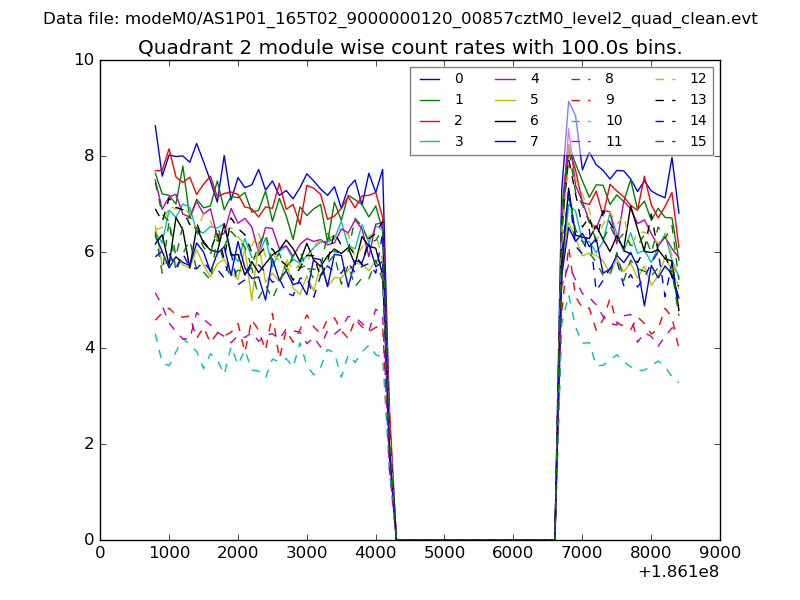
| Module-wise count rates for Quadrant B Data is divided into 100 sec bins |
 |
 |
| Module-wise count rates for Quadrant C Data is divided into 100 sec bins |
 |
 |
| Module-wise count rates for Quadrant D Data is divided into 100 sec bins |
 |
 |
| Parameter | Plot |
|---|---|
| CZT HV Monitor | 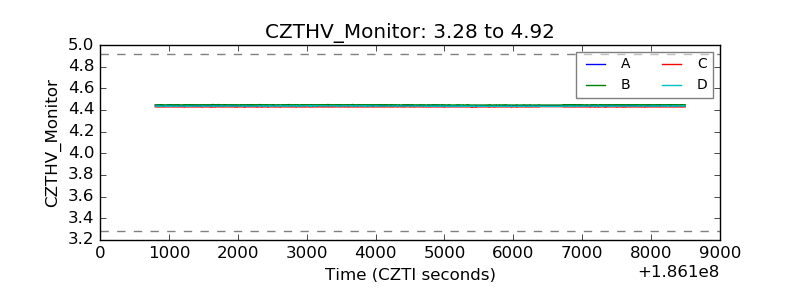 |
| D_VDD | 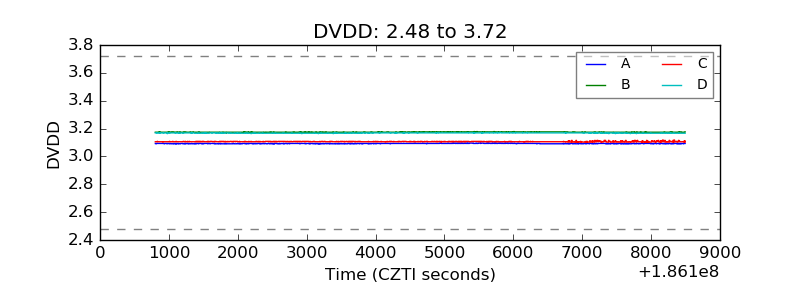 |
| Temperature 1 | 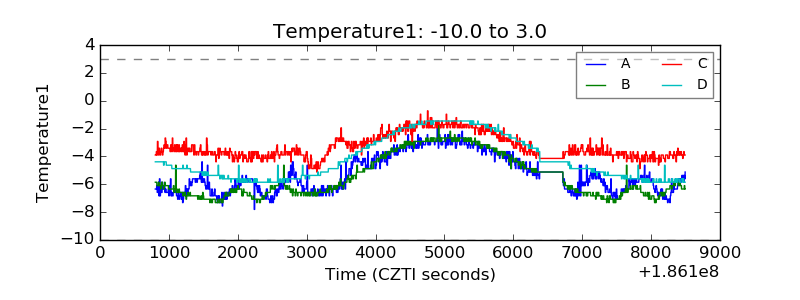 |
| Veto HV Monitor | 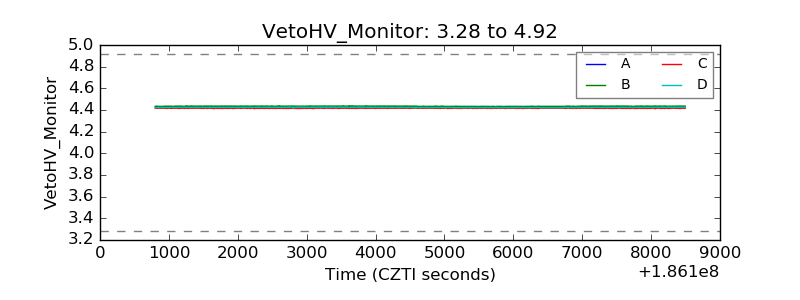 |
| Veto LLD | 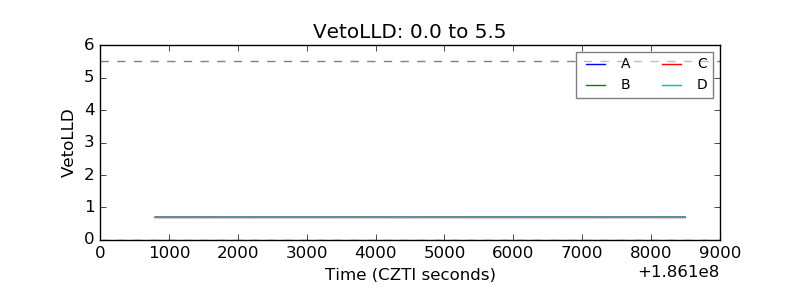 |
| Alpha Counter | 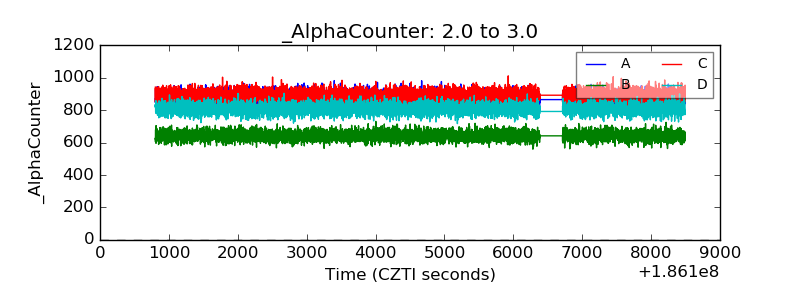 |
| _CPM_Rate | 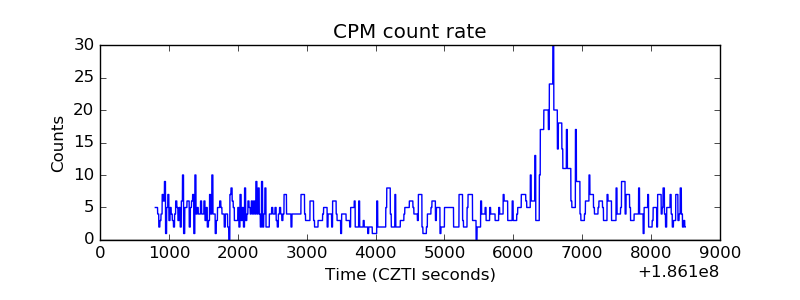 |
| CZT Counter | 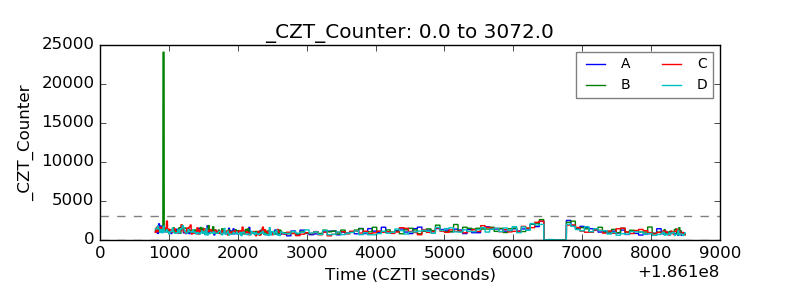 |
| +2.5 Volts monitor |  |
| +5 Volts monitor |  |
| _ROLL_ROT | 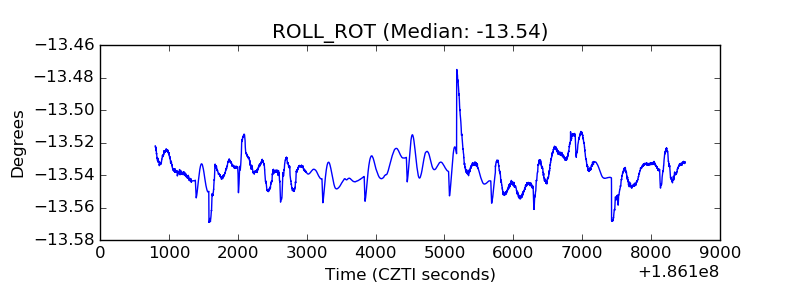 |
| _Roll_DEC | 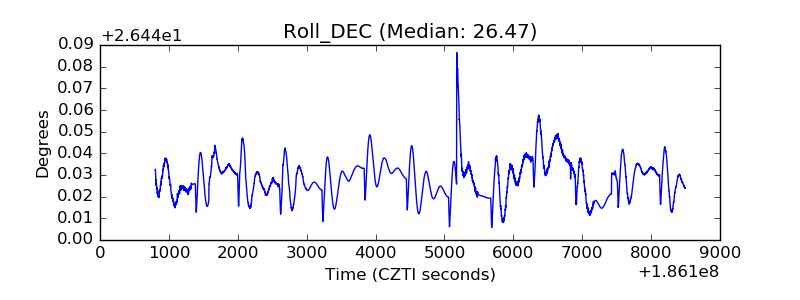 |
| _Roll_RA | 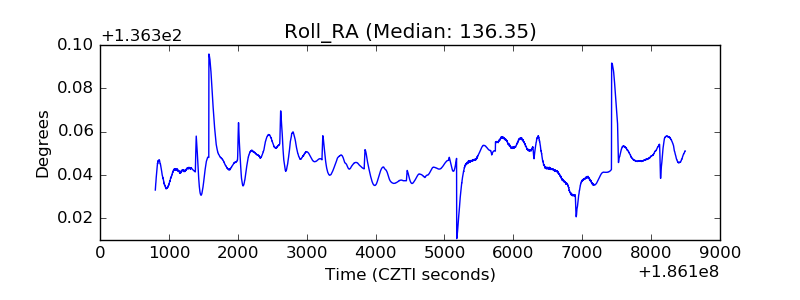 |
| Veto Counter | 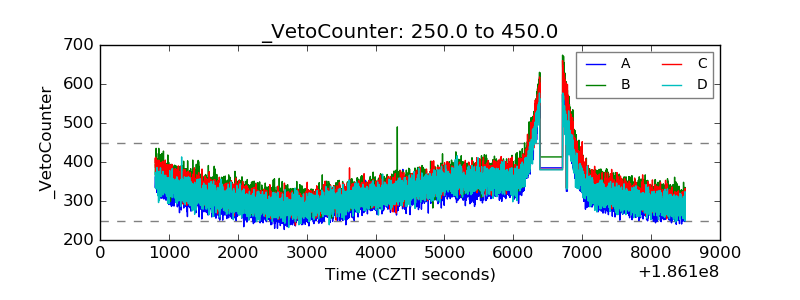 |