| Param | Original file | Final file |
|---|---|---|
| Filename | modeM0/AS1P01_165T02_9000000120_00858cztM0_level2.evt | modeM0/AS1P01_165T02_9000000120_00858cztM0_level2_quad_clean.evt |
| Size (bytes) | 1,338,851,520 | 95,402,880 |
| Size | 1.2 GB | 91.0 MB |
| Events in quadrant A | 9,899,250 | 590,163 |
| Events in quadrant B | 10,770,945 | 580,723 |
| Events in quadrant C | 9,644,927 | 575,636 |
| Events in quadrant D | 9,686,824 | 569,856 |
| Mode SS | |||
|---|---|---|---|
| Quadrant | BADHDUFLAG | Total packets | Discarded packets |
| A | 0 | 168 | 0 |
| B | 0 | 168 | 0 |
| C | 0 | 168 | 0 |
| D | 0 | 168 | 0 |
| Mode M0 | |||
|---|---|---|---|
| Quadrant | BADHDUFLAG | Total packets | Discarded packets |
| A | 0 | 35275 | 0 |
| B | 0 | 37826 | 0 |
| C | 0 | 34486 | 0 |
| D | 0 | 34714 | 0 |
| Mode M9 | |||
|---|---|---|---|
| Quadrant | BADHDUFLAG | Total packets | Discarded packets |
| A | 0 | 3 | 0 |
| B | 0 | 3 | 0 |
| C | 0 | 3 | 0 |
| D | 0 | 3 | 0 |
| Quadrant | Total seconds | Saturated seconds | Saturation percentage |
|---|---|---|---|
| A | 8237 | 12 | 0.145684% |
| B | 8238 | 76 | 0.922554% |
| C | 8238 | 7 | 0.084972% |
| D | 8238 | 171 | 2.075747% |
Noise dominated data is calculated using 1-second bins in cleaned event files. If a bin has >2000 counts, and if more than 50% of those come from <1% of pixels, then it is considered to be noise-dominated and hence unusable.
| Quadrant | # 1 sec bins | Bins with >0 counts | Bins with >2000 counts | High rate bins dominated by noise | Noise dominated (total time) | Noise dominated (detector-on time) | Marked lightcurve |
|---|---|---|---|---|---|---|---|
| A | 8582 | 8239 | 396 | 396 | 4.61% | 4.81% | 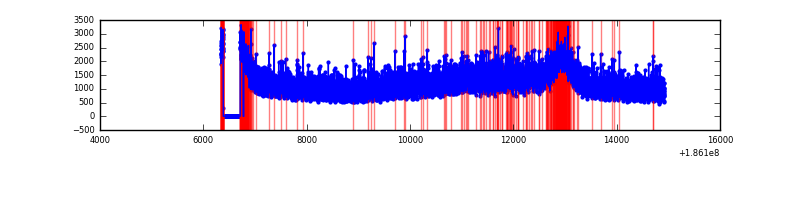 |
| B | 8583 | 8239 | 627 | 627 | 7.31% | 7.61% | 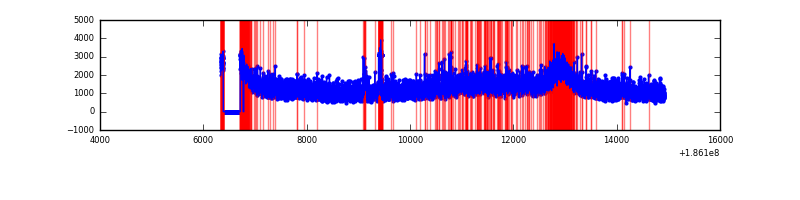 |
| C | 8583 | 8240 | 349 | 349 | 4.07% | 4.24% | 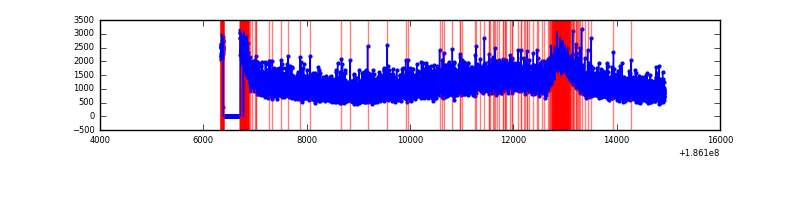 |
| D | 8583 | 8240 | 641 | 641 | 7.47% | 7.78% | 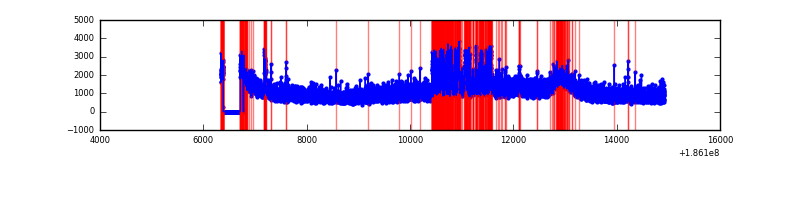 |
Top three noisy pixels from each quadrant. If the there are fewer than three noisy pixels in the level2.evt file, extra rows are filled as -1
| Pixel properties | Quadrant properties | ||||||
|---|---|---|---|---|---|---|---|
| Quadrant | DetID | PixID | Counts | Sigma | Mean | Median | Sigma |
| A | 0 | 214 | 82390 | 128.95 | 2557 | 2587 | 618.9 |
| A | 11 | 79 | 10795 | 13.26 | 2557 | 2587 | 618.9 |
| A | 3 | 111 | 8033 | 8.8 | 2557 | 2587 | 618.9 |
| B | 5 | 191 | 211210 | 326.75 | 2698 | 2716 | 638.1 |
| B | 0 | 220 | 197182 | 304.76 | 2698 | 2716 | 638.1 |
| B | 0 | 23 | 50321 | 74.6 | 2698 | 2716 | 638.1 |
| C | 3 | 111 | 41375 | 56.98 | 2434 | 2524 | 681.8 |
| C | 3 | 79 | 27906 | 37.23 | 2434 | 2524 | 681.8 |
| C | 15 | 241 | 24481 | 32.21 | 2434 | 2524 | 681.8 |
| D | 13 | 73 | 884320 | 1229.09 | 2315 | 2399 | 717.5 |
| D | 13 | 13 | 45667 | 60.3 | 2315 | 2399 | 717.5 |
| D | 1 | 4 | 35599 | 46.27 | 2315 | 2399 | 717.5 |
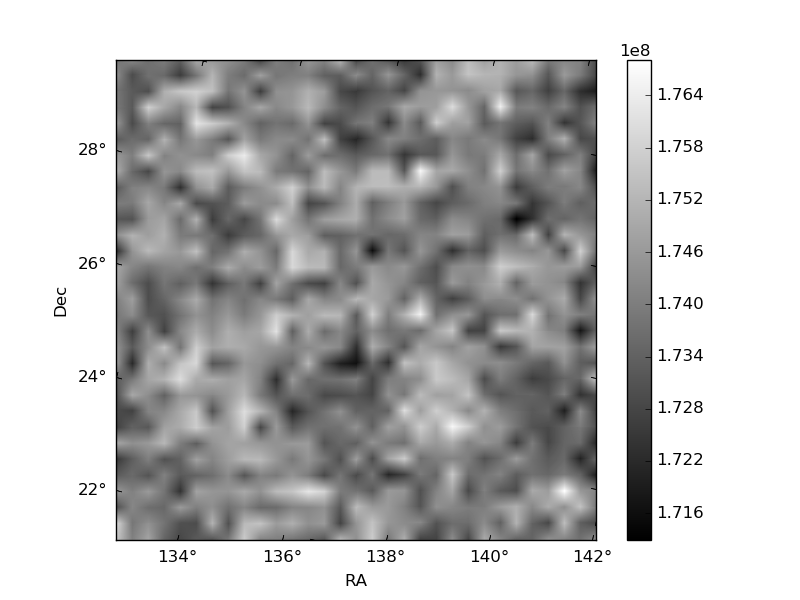
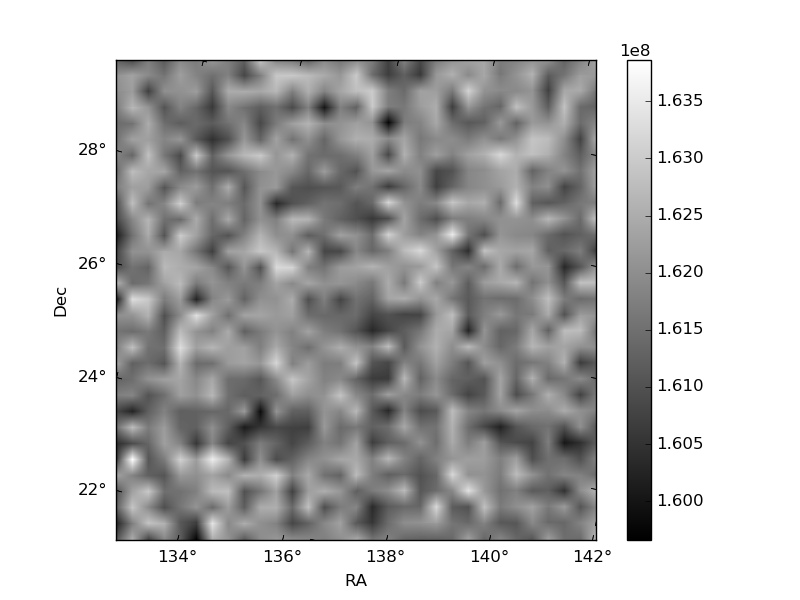
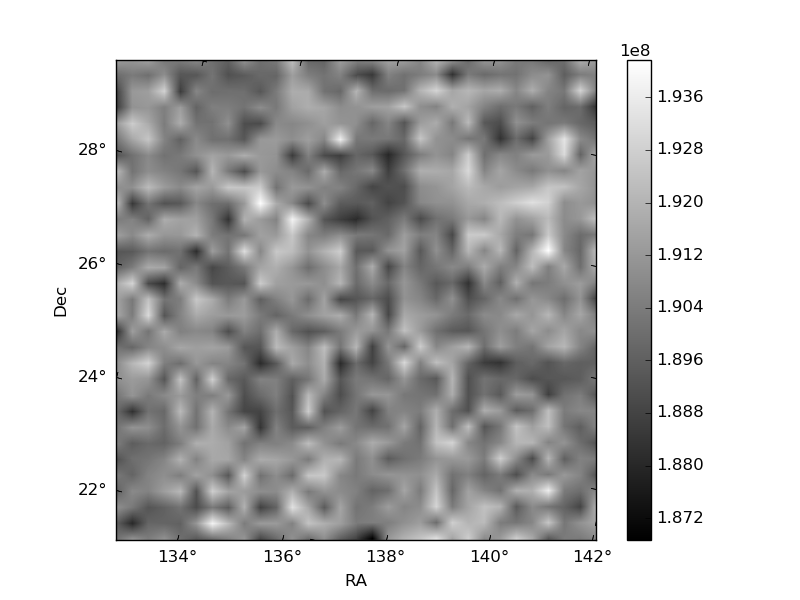
Histogram calculated using DETX and DETY for each event in the final _common_clean file
| Quadrant A | 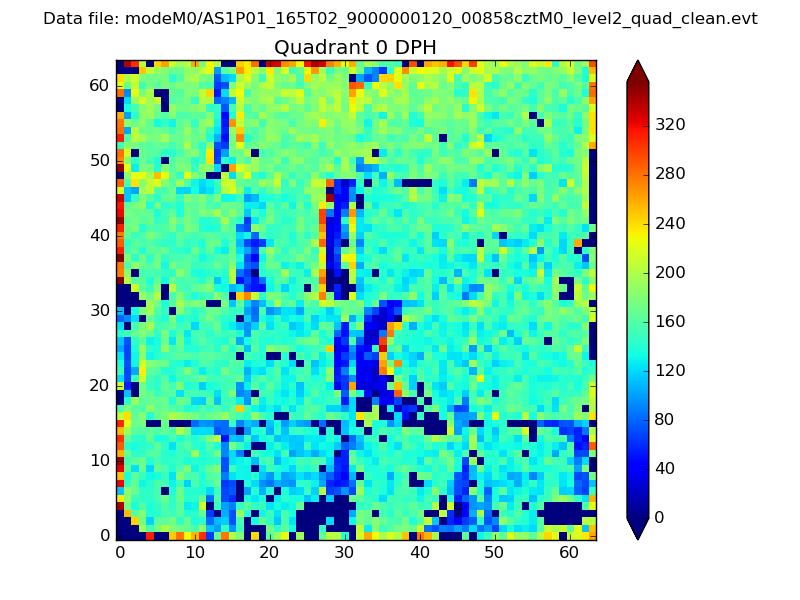 |
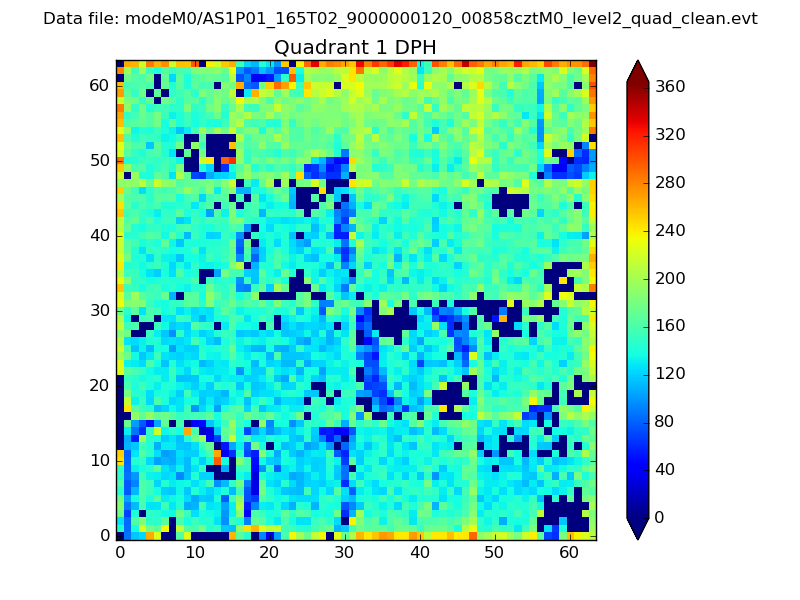 |
Quadrant B |
|---|---|---|---|
| Quadrant D | 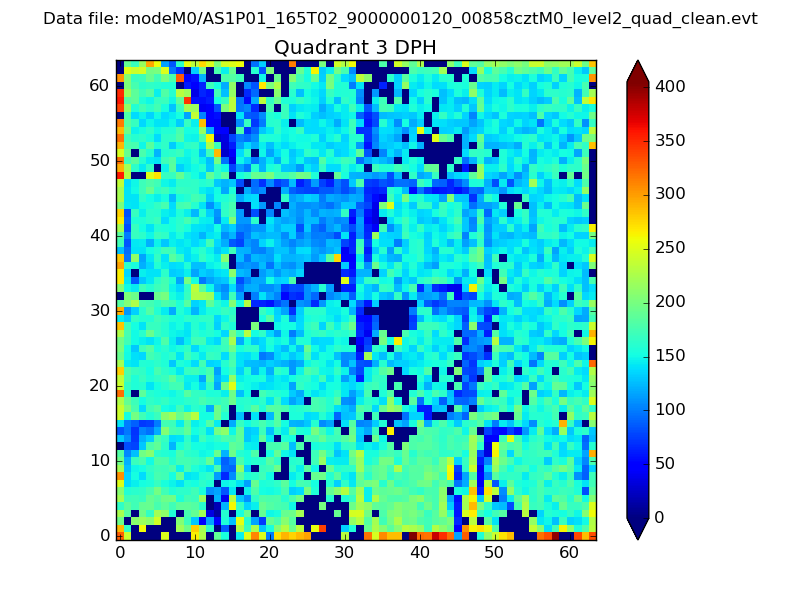 |
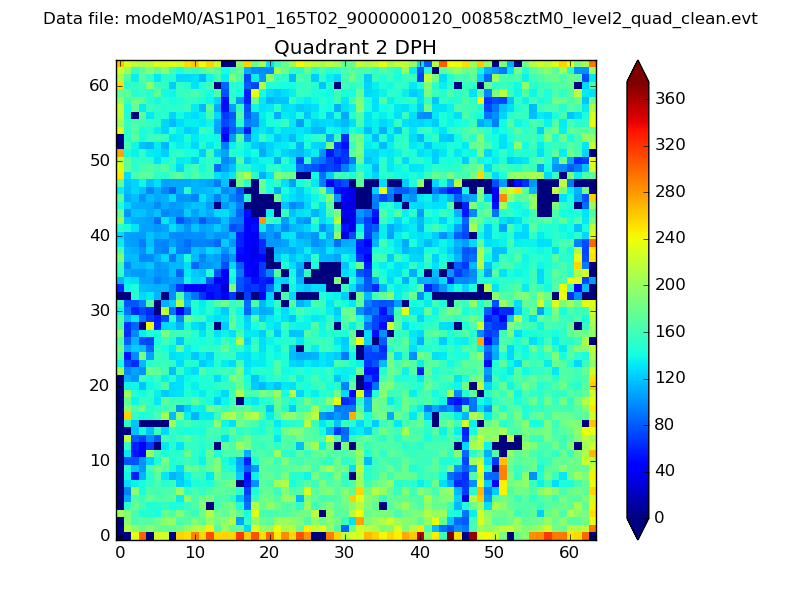 |
Quadrant C |
| Plot type | Count rate plots | Images |
|---|---|---|
| Comparison with Poisson distribution Blue bars denote a histogram of data divided into 1 sec bins. Red curve is a Poisson curve with rate = median count rate of data. |
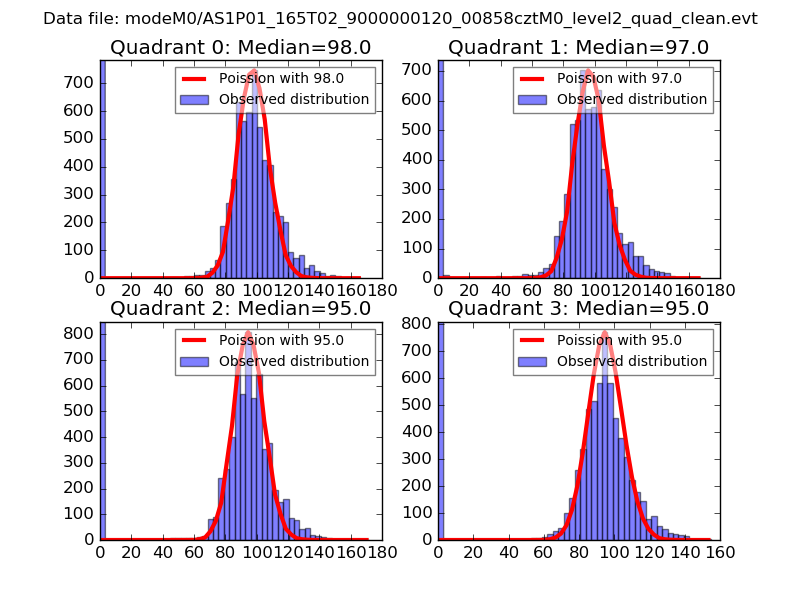 |
 |
| Quadrant-wise count rates Data is divided into 100 sec bins |
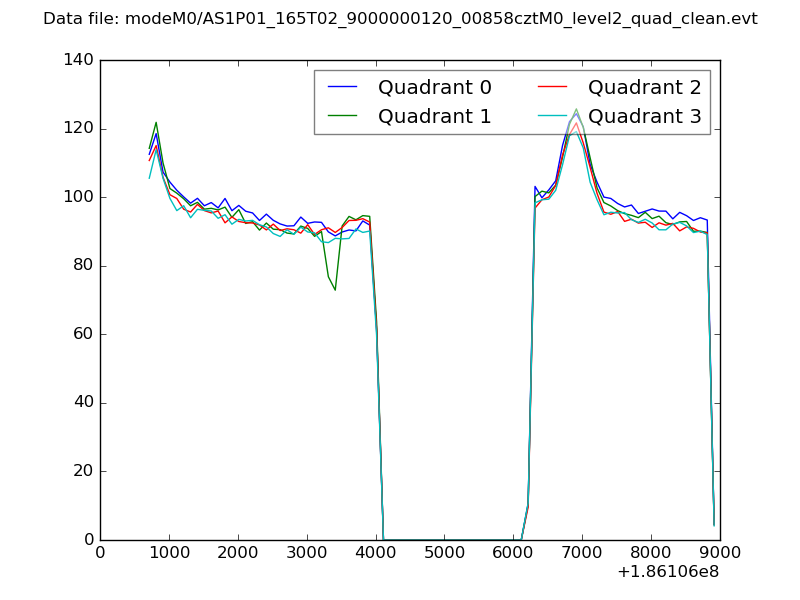 |
|
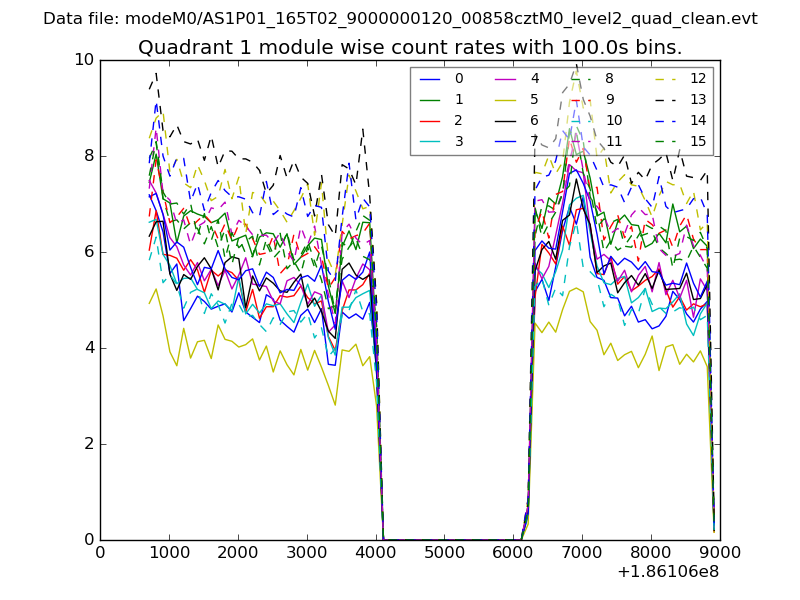
| Module-wise count rates for Quadrant A Data is divided into 100 sec bins |
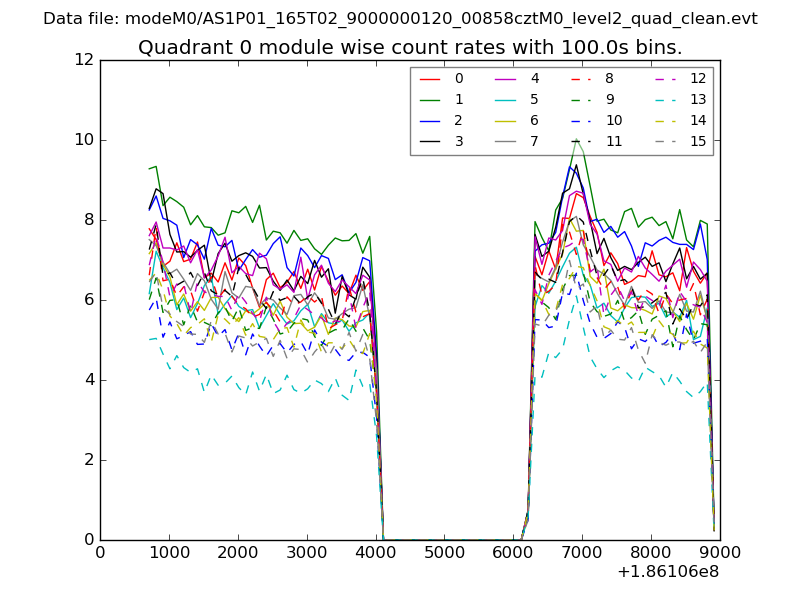 |
 |
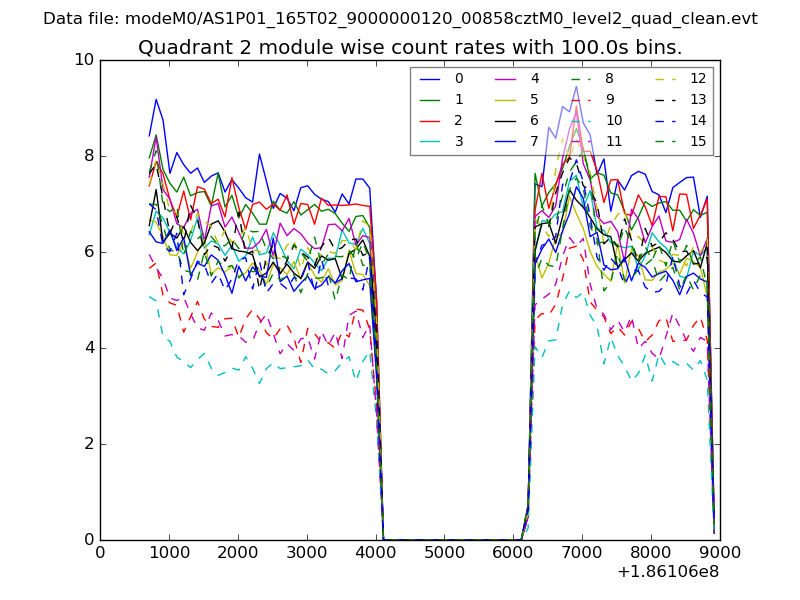
| Module-wise count rates for Quadrant B Data is divided into 100 sec bins |
 |
 |
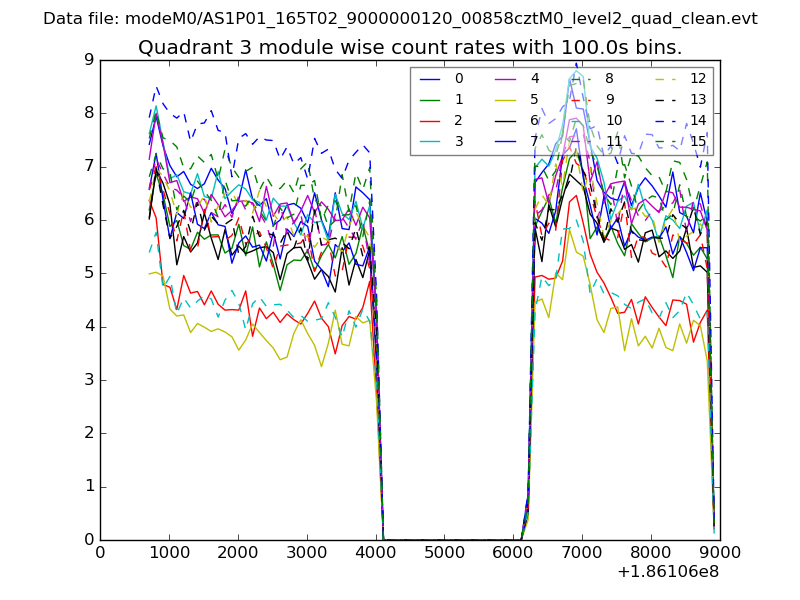
| Module-wise count rates for Quadrant C Data is divided into 100 sec bins |
 |
 |
| Module-wise count rates for Quadrant D Data is divided into 100 sec bins |
 |
 |
| Parameter | Plot |
|---|---|
| CZT HV Monitor | 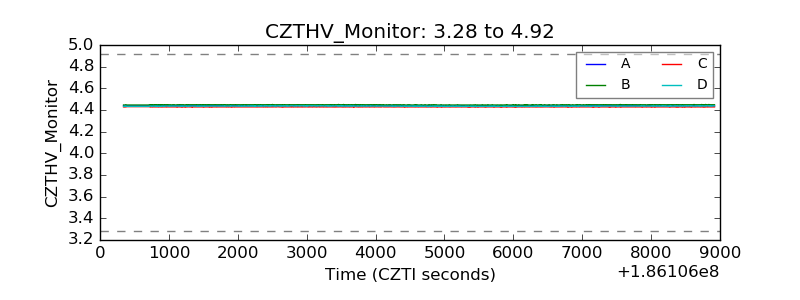 |
| D_VDD |  |
| Temperature 1 | 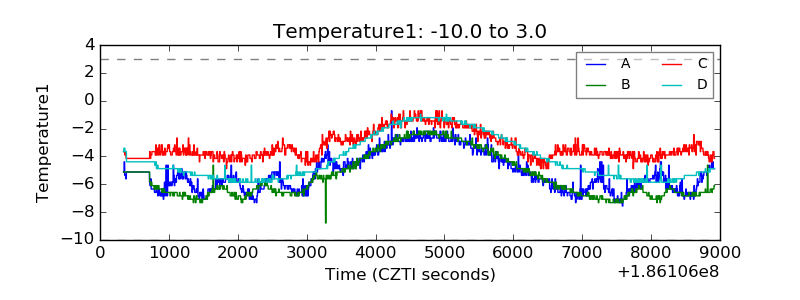 |
| Veto HV Monitor | 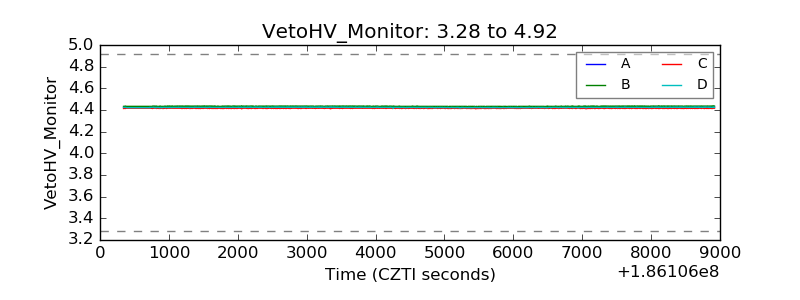 |
| Veto LLD | 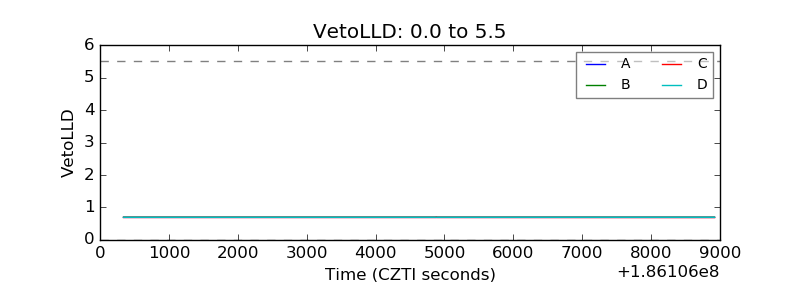 |
| Alpha Counter | 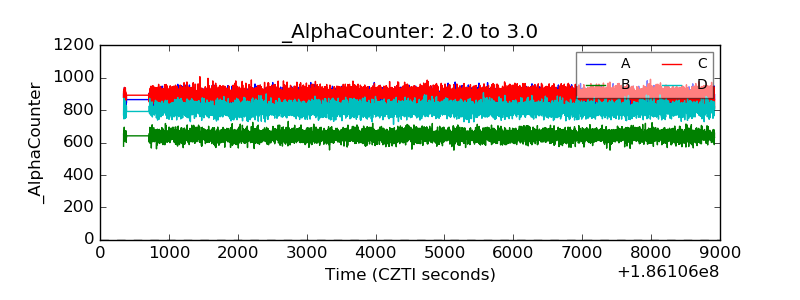 |
| _CPM_Rate | 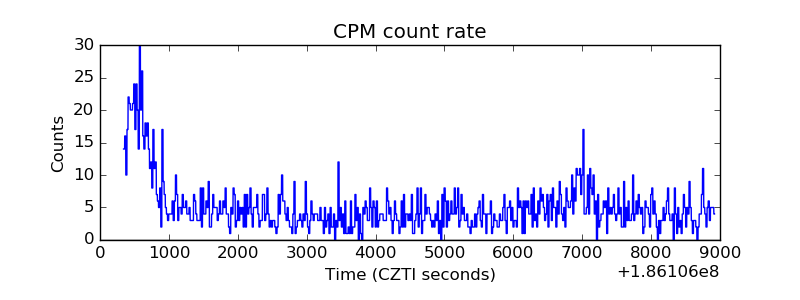 |
| CZT Counter |  |
| +2.5 Volts monitor |  |
| +5 Volts monitor | 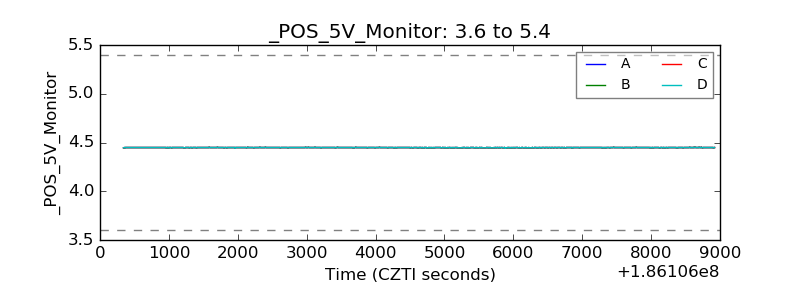 |
| _ROLL_ROT | 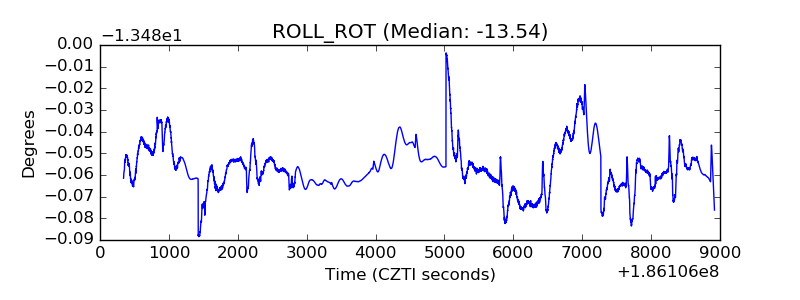 |
| _Roll_DEC | 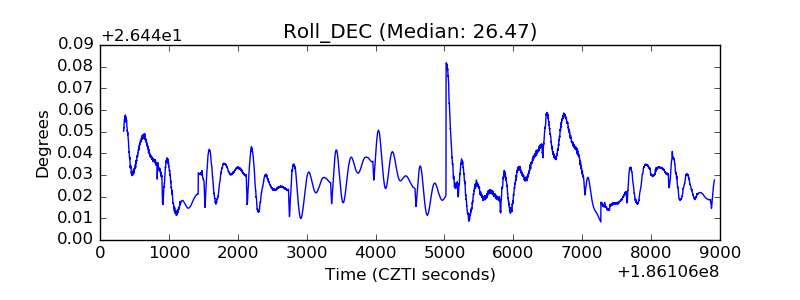 |
| _Roll_RA | 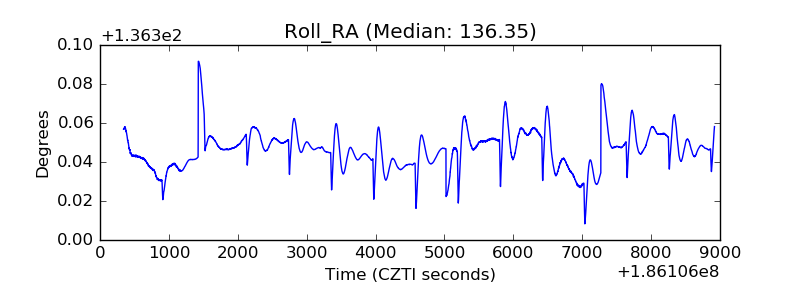 |
| Veto Counter | 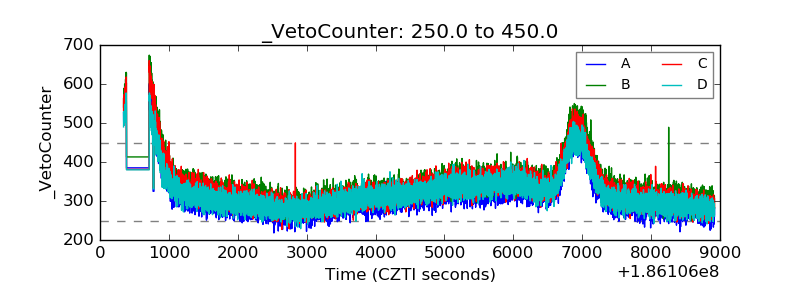 |