| Param | Original file | Final file |
|---|---|---|
| Filename | modeM0/AS1P01_165T02_9000000120_00859cztM0_level2.evt | modeM0/AS1P01_165T02_9000000120_00859cztM0_level2_quad_clean.evt |
| Size (bytes) | 1,101,536,640 | 73,886,400 |
| Size | 1.0 GB | 70.5 MB |
| Events in quadrant A | 8,384,653 | 448,984 |
| Events in quadrant B | 8,848,177 | 447,356 |
| Events in quadrant C | 8,155,170 | 438,913 |
| Events in quadrant D | 7,526,701 | 433,145 |
| Mode SS | |||
|---|---|---|---|
| Quadrant | BADHDUFLAG | Total packets | Discarded packets |
| A | 0 | 134 | 0 |
| B | 0 | 134 | 0 |
| C | 0 | 134 | 0 |
| D | 0 | 134 | 0 |
| Mode M0 | |||
|---|---|---|---|
| Quadrant | BADHDUFLAG | Total packets | Discarded packets |
| A | 0 | 29674 | 0 |
| B | 0 | 31085 | 0 |
| C | 0 | 28969 | 0 |
| D | 0 | 27185 | 0 |
| Quadrant | Total seconds | Saturated seconds | Saturation percentage |
|---|---|---|---|
| A | 6727 | 9 | 0.133789% |
| B | 6727 | 38 | 0.564888% |
| C | 6727 | 7 | 0.104058% |
| D | 6727 | 18 | 0.267578% |
Noise dominated data is calculated using 1-second bins in cleaned event files. If a bin has >2000 counts, and if more than 50% of those come from <1% of pixels, then it is considered to be noise-dominated and hence unusable.
| Quadrant | # 1 sec bins | Bins with >0 counts | Bins with >2000 counts | High rate bins dominated by noise | Noise dominated (total time) | Noise dominated (detector-on time) | Marked lightcurve |
|---|---|---|---|---|---|---|---|
| A | 6727 | 6727 | 370 | 370 | 5.50% | 5.50% | 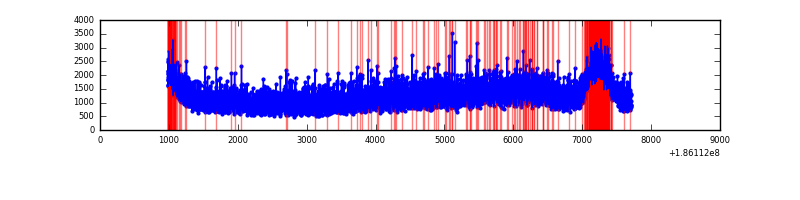 |
| B | 6727 | 6727 | 509 | 509 | 7.57% | 7.57% | 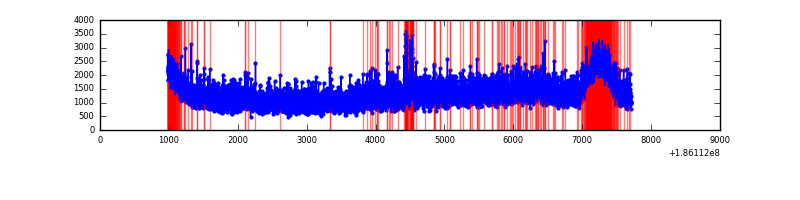 |
| C | 6727 | 6727 | 336 | 336 | 4.99% | 4.99% |  |
| D | 6727 | 6727 | 216 | 216 | 3.21% | 3.21% | 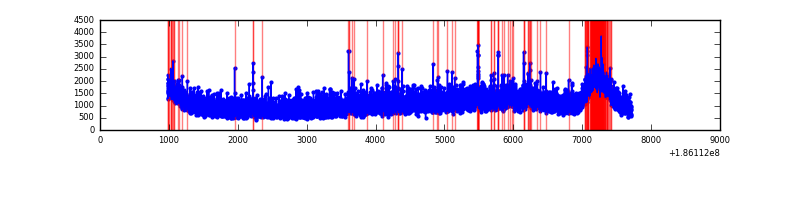 |
Top three noisy pixels from each quadrant. If the there are fewer than three noisy pixels in the level2.evt file, extra rows are filled as -1
| Pixel properties | Quadrant properties | ||||||
|---|---|---|---|---|---|---|---|
| Quadrant | DetID | PixID | Counts | Sigma | Mean | Median | Sigma |
| A | 0 | 214 | 117716 | 220.25 | 2153 | 2171 | 524.6 |
| A | 8 | 192 | 8604 | 12.26 | 2153 | 2171 | 524.6 |
| A | 11 | 79 | 7869 | 10.86 | 2153 | 2171 | 524.6 |
| B | 0 | 220 | 115041 | 210.0 | 2258 | 2270 | 537.0 |
| B | 0 | 184 | 55675 | 99.45 | 2258 | 2270 | 537.0 |
| B | 5 | 249 | 41221 | 72.53 | 2258 | 2270 | 537.0 |
| C | 9 | 54 | 51566 | 85.65 | 2052 | 2128 | 577.2 |
| C | 3 | 111 | 34875 | 56.74 | 2052 | 2128 | 577.2 |
| C | 3 | 79 | 20852 | 32.44 | 2052 | 2128 | 577.2 |
| D | 13 | 169 | 58205 | 91.56 | 1960 | 2029 | 613.5 |
| D | 13 | 170 | 45755 | 71.27 | 1960 | 2029 | 613.5 |
| D | 2 | 16 | 42458 | 65.89 | 1960 | 2029 | 613.5 |
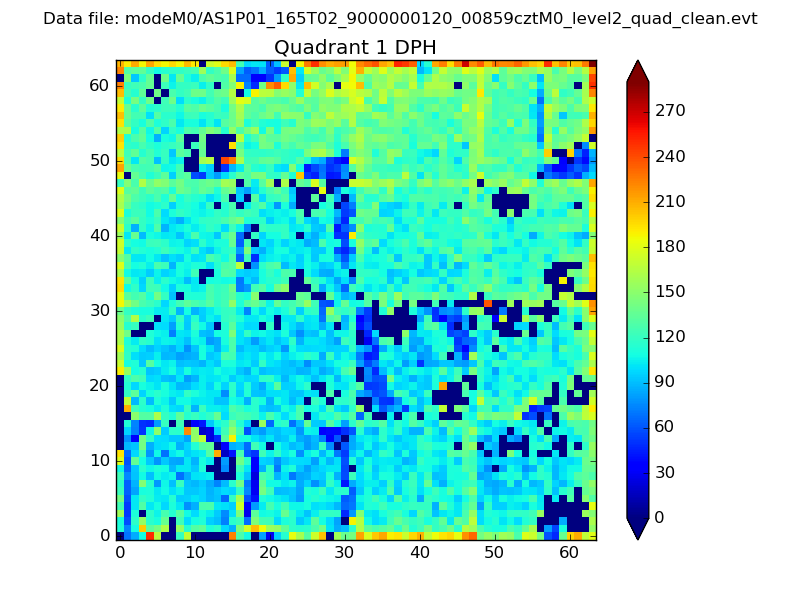
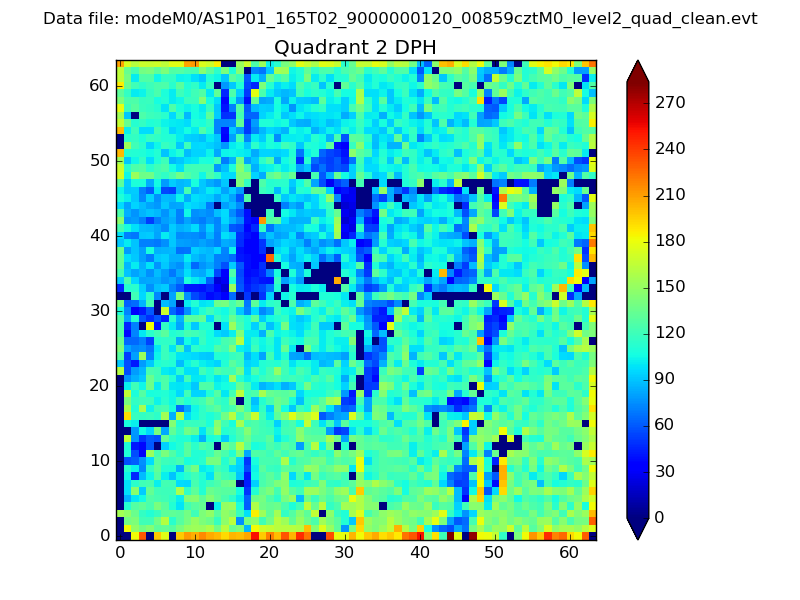
Histogram calculated using DETX and DETY for each event in the final _common_clean file
| Quadrant A | 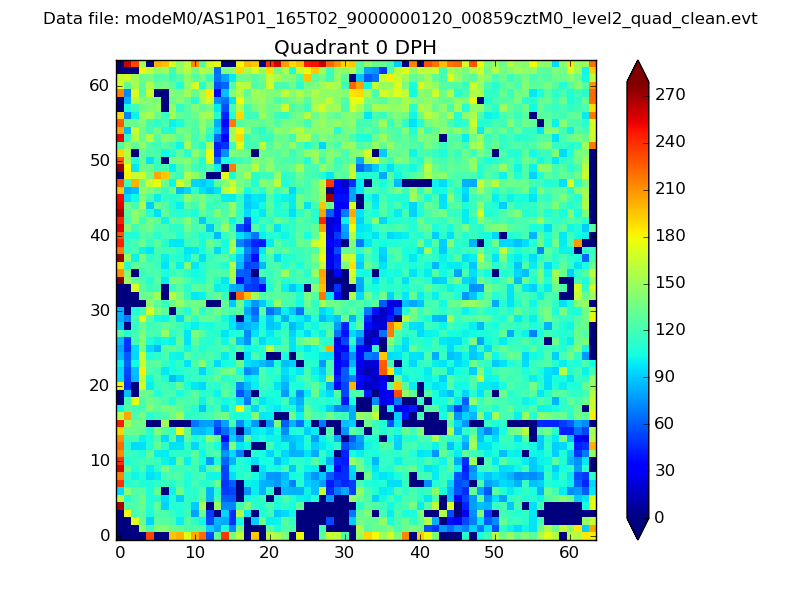 |
 |
Quadrant B |
|---|---|---|---|
| Quadrant D |  |
 |
Quadrant C |
| Plot type | Count rate plots | Images |
|---|---|---|
| Comparison with Poisson distribution Blue bars denote a histogram of data divided into 1 sec bins. Red curve is a Poisson curve with rate = median count rate of data. |
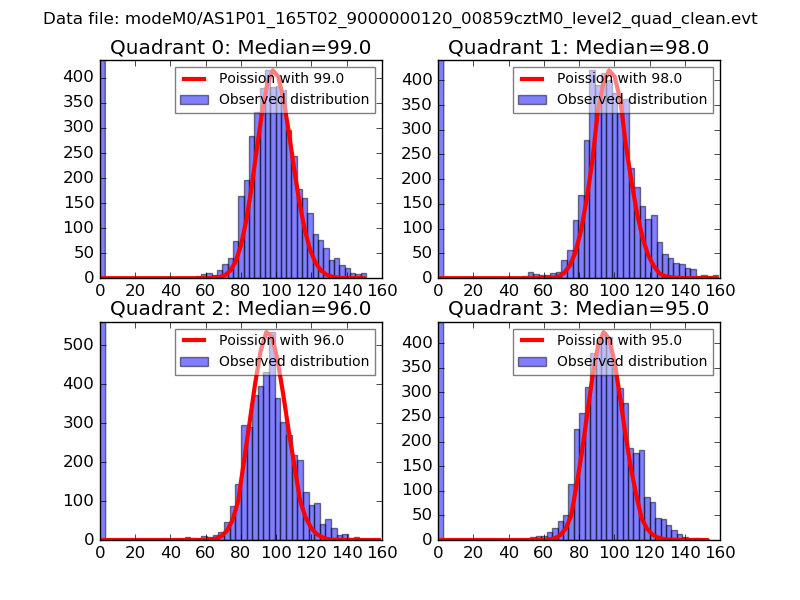 |
 |
| Quadrant-wise count rates Data is divided into 100 sec bins |
 |
|
| Module-wise count rates for Quadrant A Data is divided into 100 sec bins |
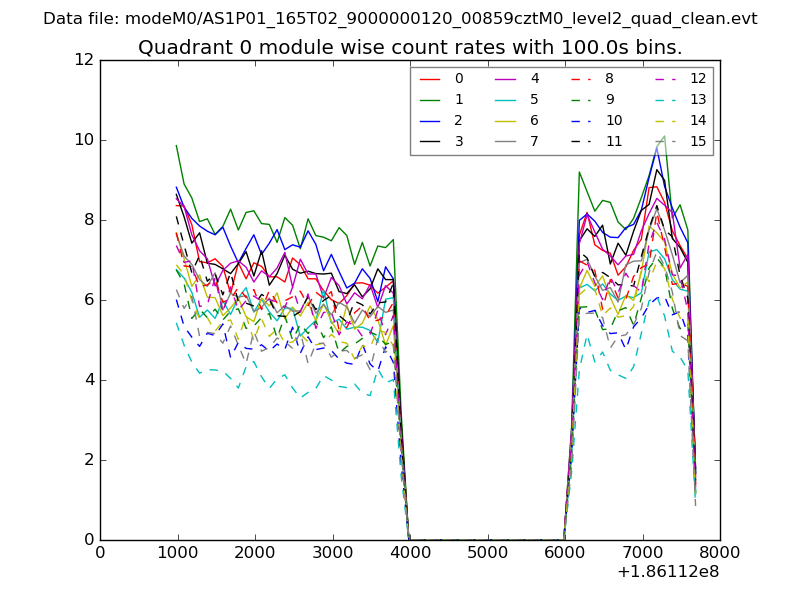 |
 |
| Module-wise count rates for Quadrant B Data is divided into 100 sec bins |
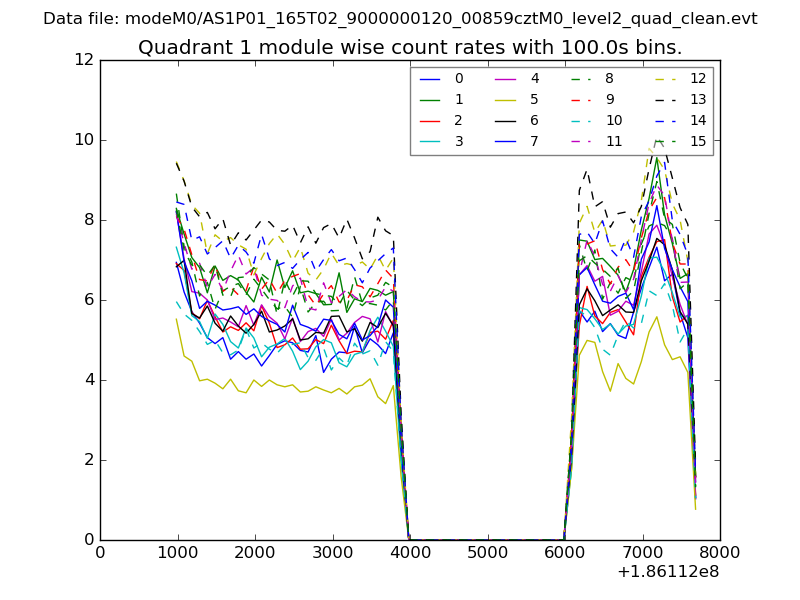 |
 |
| Module-wise count rates for Quadrant C Data is divided into 100 sec bins |
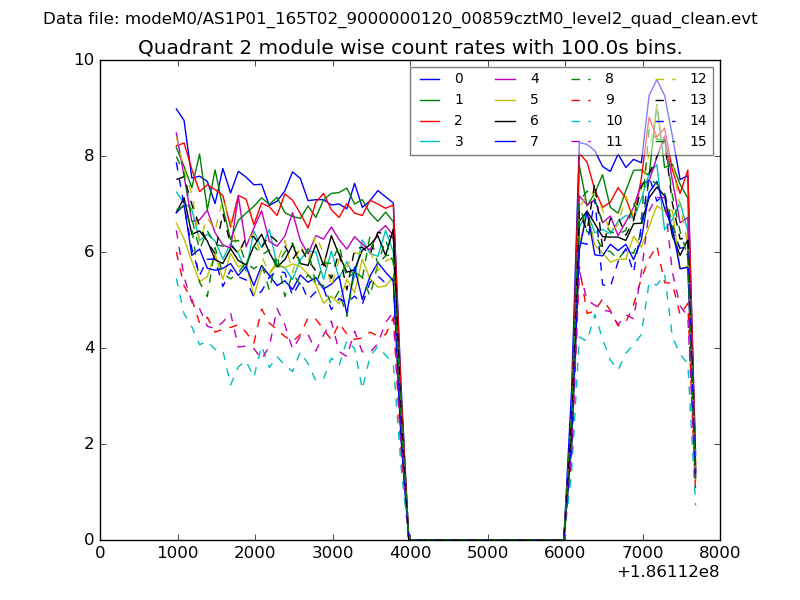 |
 |
| Module-wise count rates for Quadrant D Data is divided into 100 sec bins |
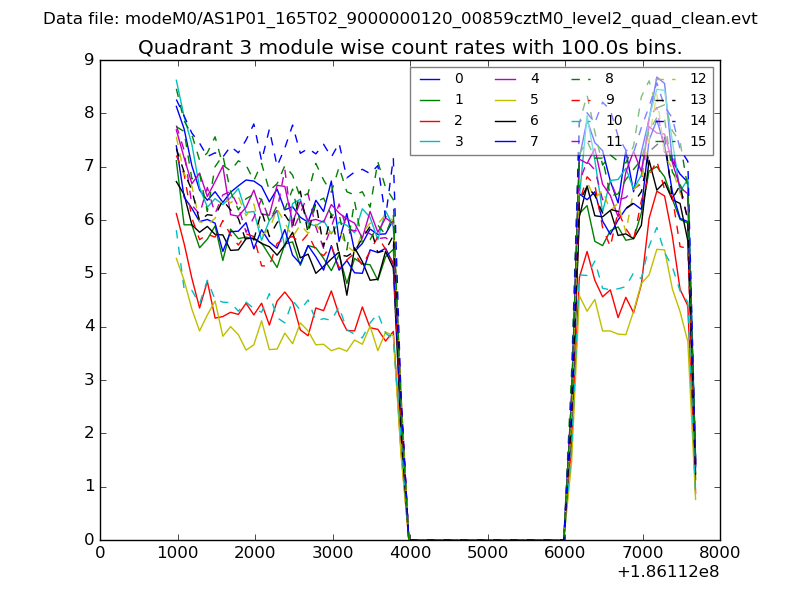 |
 |
| Parameter | Plot |
|---|---|
| CZT HV Monitor | 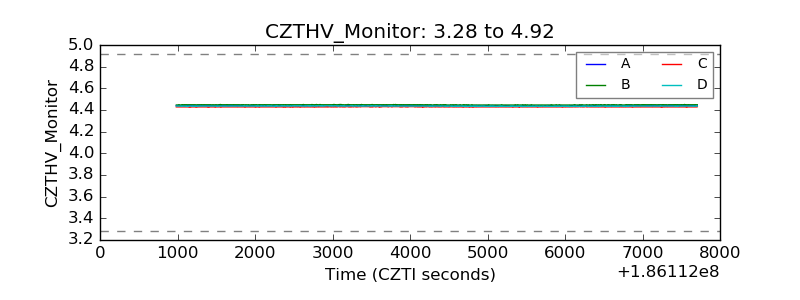 |
| D_VDD | 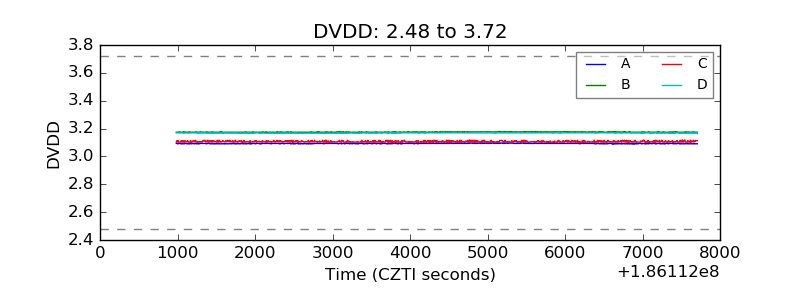 |
| Temperature 1 | 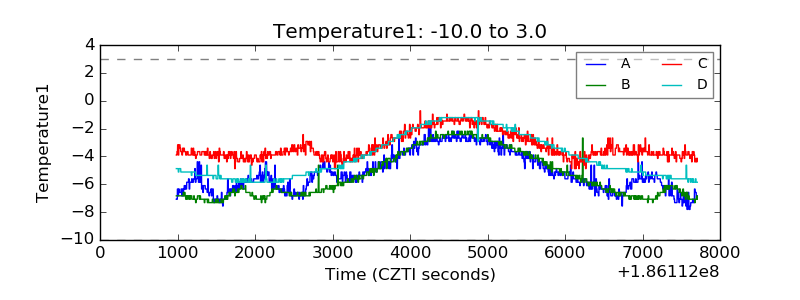 |
| Veto HV Monitor | 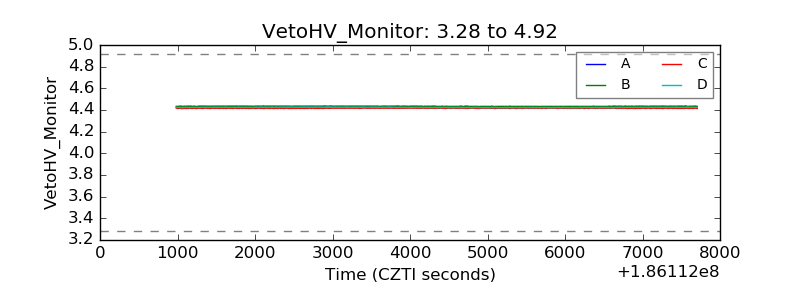 |
| Veto LLD | 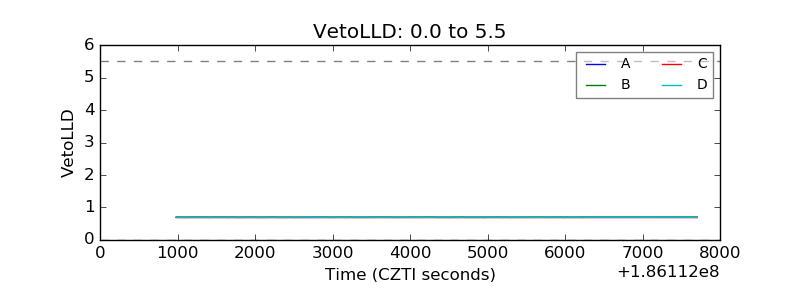 |
| Alpha Counter | 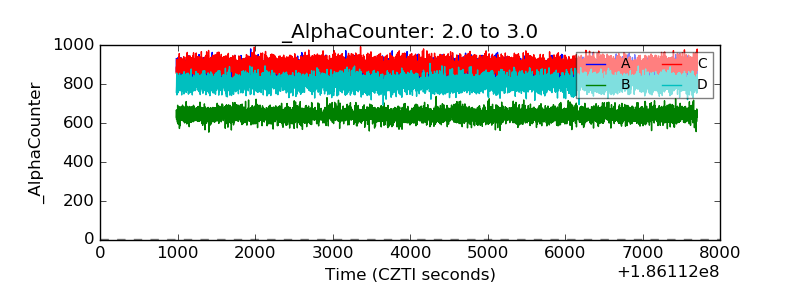 |
| _CPM_Rate | 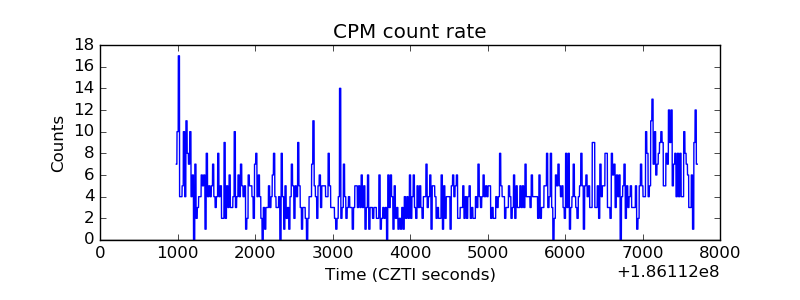 |
| CZT Counter | 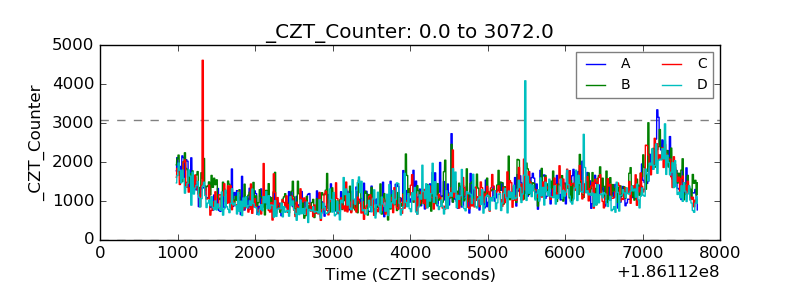 |
| +2.5 Volts monitor |  |
| +5 Volts monitor |  |
| _ROLL_ROT | 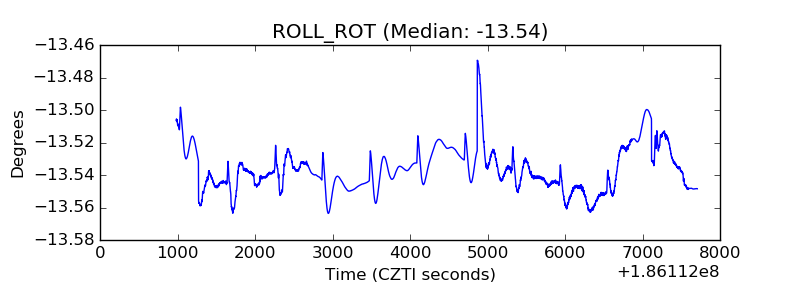 |
| _Roll_DEC | 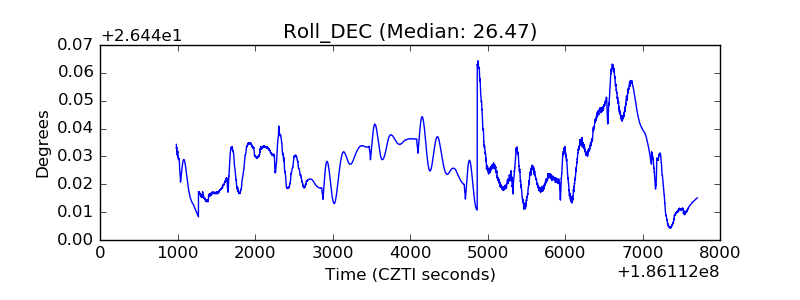 |
| _Roll_RA | 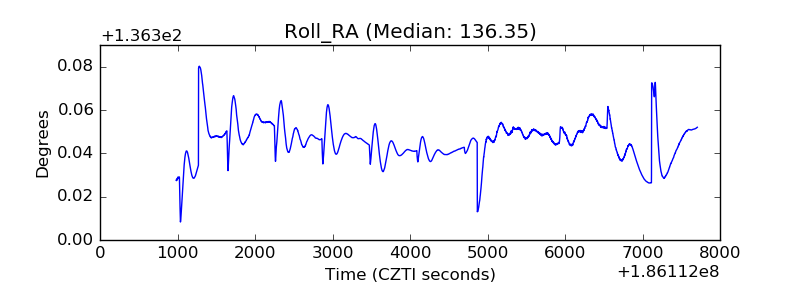 |
| Veto Counter | 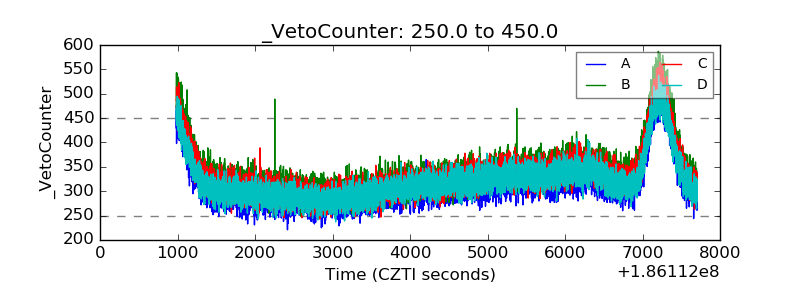 |