| Param | Original file | Final file |
|---|---|---|
| Filename | modeM0/AS1P01_156T01_9000000122cztM0_level2.fits | modeM0/AS1P01_156T01_9000000122cztM0_level2_quad_clean.evt |
| Size (bytes) | 163,376,640 | 149,546,880 |
| Size | 155.8 MB | 142.6 MB |
| Events in quadrant A | 937,146 | 828,153 |
| Events in quadrant B | 932,760 | 829,801 |
| Events in quadrant C | 927,732 | 798,064 |
| Events in quadrant D | 801,986 | 723,979 |
| Mode SS | |||
|---|---|---|---|
| Quadrant | BADHDUFLAG | Total packets | Discarded packets |
| A | 0 | 398 | 0 |
| B | 0 | 398 | 0 |
| C | 0 | 398 | 0 |
| D | 0 | 398 | 0 |
| Mode M9 | |||
|---|---|---|---|
| Quadrant | BADHDUFLAG | Total packets | Discarded packets |
| A | 0 | 15 | 0 |
| B | 0 | 15 | 0 |
| C | 0 | 15 | 0 |
| D | 0 | 15 | 0 |
| Mode M0 | |||
|---|---|---|---|
| Quadrant | BADHDUFLAG | Total packets | Discarded packets |
| A | 0 | 85712 | 0 |
| B | 0 | 89967 | 0 |
| C | 0 | 82980 | 0 |
| D | 0 | 81750 | 0 |
| Quadrant | Total seconds | Saturated seconds | Saturation percentage |
|---|---|---|---|
| A | 19567 | 217 | 1.109010% |
| B | 19567 | 324 | 1.655849% |
| C | 19567 | 142 | 0.725712% |
| D | 19567 | 282 | 1.441202% |
Noise dominated data is calculated using 1-second bins in cleaned event files. If a bin has >2000 counts, and if more than 50% of those come from <1% of pixels, then it is considered to be noise-dominated and hence unusable.
| Quadrant | # 1 sec bins | Bins with >0 counts | Bins with >2000 counts | High rate bins dominated by noise | Noise dominated (total time) | Noise dominated (detector-on time) | Marked lightcurve |
|---|---|---|---|---|---|---|---|
| A | 21157 | 19565 | 0 | 0 | 0.00% | 0.00% |  |
| B | 21157 | 19563 | 0 | 0 | 0.00% | 0.00% |  |
| C | 21157 | 19564 | 0 | 0 | 0.00% | 0.00% | 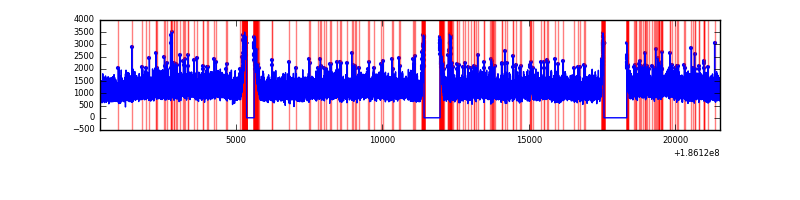 |
| D | 21157 | 19546 | 0 | 0 | 0.00% | 0.00% |  |
Top three noisy pixels from each quadrant. If the there are fewer than three noisy pixels in the level2.evt file, extra rows are filled as -1
| Pixel properties | Quadrant properties | ||||||
|---|---|---|---|---|---|---|---|
| Quadrant | DetID | PixID | Counts | Sigma | Mean | Median | Sigma |
| A | 0 | 29 | 912 | 11.5 | 242 | 226 | 59.6 |
| A | 7 | 110 | 893 | 11.18 | 242 | 226 | 59.6 |
| A | 0 | 30 | 703 | 8.0 | 242 | 226 | 59.6 |
| B | 2 | 9 | 747 | 10.49 | 245 | 232 | 49.1 |
| B | 14 | 254 | 603 | 7.56 | 245 | 232 | 49.1 |
| B | 5 | 128 | 601 | 7.52 | 245 | 232 | 49.1 |
| C | 12 | 241 | 650 | 6.69 | 245 | 225 | 63.5 |
| C | 2 | 191 | 608 | 6.03 | 245 | 225 | 63.5 |
| C | 9 | 242 | 595 | 5.83 | 245 | 225 | 63.5 |
| D | 3 | 30 | 616 | 7.18 | 228 | 208 | 56.8 |
| D | 1 | 19 | 582 | 6.59 | 228 | 208 | 56.8 |
| D | 3 | 14 | 571 | 6.39 | 228 | 208 | 56.8 |
Histogram calculated using DETX and DETY for each event in the final _common_clean file
| Quadrant A |  |
 |
Quadrant B |
|---|---|---|---|
| Quadrant D |  |
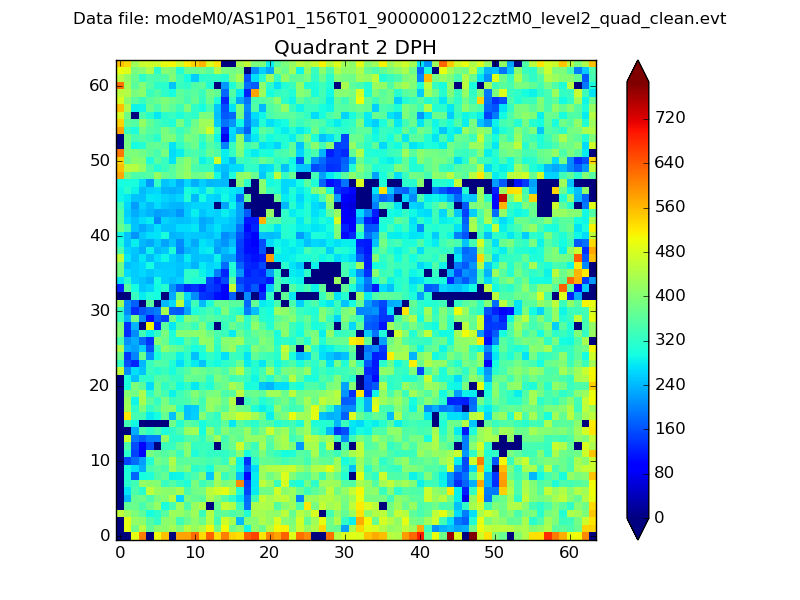 |
Quadrant C |
| Plot type | Count rate plots | Images |
|---|---|---|
| Comparison with Poisson distribution Blue bars denote a histogram of data divided into 1 sec bins. Red curve is a Poisson curve with rate = median count rate of data. |
 |
 |
| Quadrant-wise count rates Data is divided into 100 sec bins |
 |
|
| Module-wise count rates for Quadrant A Data is divided into 100 sec bins |
 |
 |
| Module-wise count rates for Quadrant B Data is divided into 100 sec bins |
 |
 |
| Module-wise count rates for Quadrant C Data is divided into 100 sec bins |
 |
 |
| Module-wise count rates for Quadrant D Data is divided into 100 sec bins |
 |
 |
| Parameter | Plot |
|---|---|
| CZT HV Monitor |  |
| D_VDD | 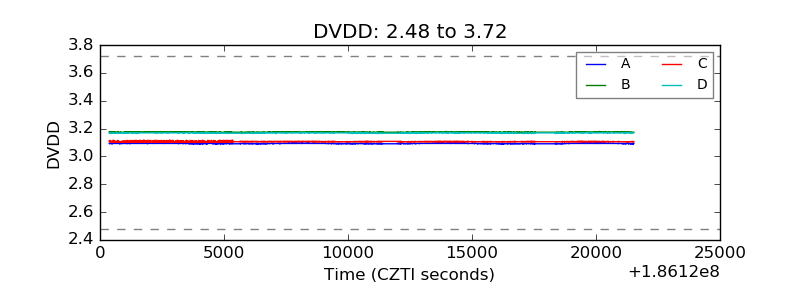 |
| Temperature 1 |  |
| Veto HV Monitor |  |
| Veto LLD | 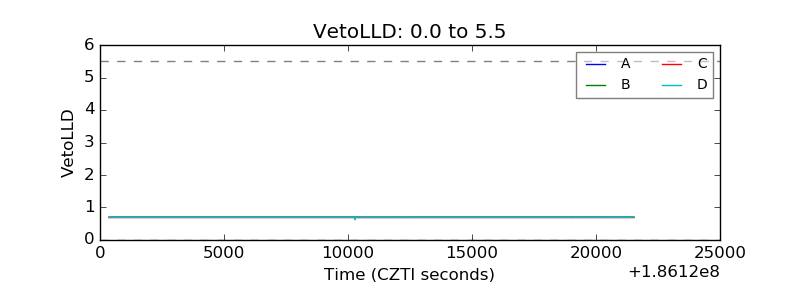 |
| Alpha Counter |  |
| _CPM_Rate |  |
| CZT Counter |  |
| +2.5 Volts monitor |  |
| +5 Volts monitor |  |
| _ROLL_ROT |  |
| _Roll_DEC |  |
| _Roll_RA |  |
| Veto Counter |  |