| Param | Original file | Final file |
|---|---|---|
| Filename | modeM0/AS1P01_156T01_9000000122_00861cztM0_level2.evt | modeM0/AS1P01_156T01_9000000122_00861cztM0_level2_quad_clean.evt |
| Size (bytes) | 1,130,713,920 | 70,188,480 |
| Size | 1.1 GB | 66.9 MB |
| Events in quadrant A | 8,469,268 | 415,177 |
| Events in quadrant B | 9,033,175 | 418,649 |
| Events in quadrant C | 8,141,569 | 412,384 |
| Events in quadrant D | 8,140,524 | 395,702 |
| Mode SS | |||
|---|---|---|---|
| Quadrant | BADHDUFLAG | Total packets | Discarded packets |
| A | 0 | 140 | 0 |
| B | 0 | 140 | 0 |
| C | 0 | 140 | 0 |
| D | 0 | 140 | 0 |
| Mode M9 | |||
|---|---|---|---|
| Quadrant | BADHDUFLAG | Total packets | Discarded packets |
| A | 0 | 6 | 0 |
| B | 0 | 6 | 0 |
| C | 0 | 6 | 0 |
| D | 0 | 6 | 0 |
| Mode M0 | |||
|---|---|---|---|
| Quadrant | BADHDUFLAG | Total packets | Discarded packets |
| A | 0 | 30102 | 0 |
| B | 0 | 31774 | 0 |
| C | 0 | 29118 | 0 |
| D | 0 | 29077 | 0 |
| Quadrant | Total seconds | Saturated seconds | Saturation percentage |
|---|---|---|---|
| A | 6937 | 33 | 0.475710% |
| B | 6936 | 68 | 0.980392% |
| C | 6937 | 37 | 0.533372% |
| D | 6937 | 93 | 1.340637% |
Noise dominated data is calculated using 1-second bins in cleaned event files. If a bin has >2000 counts, and if more than 50% of those come from <1% of pixels, then it is considered to be noise-dominated and hence unusable.
| Quadrant | # 1 sec bins | Bins with >0 counts | Bins with >2000 counts | High rate bins dominated by noise | Noise dominated (total time) | Noise dominated (detector-on time) | Marked lightcurve |
|---|---|---|---|---|---|---|---|
| A | 7487 | 6938 | 204 | 204 | 2.72% | 2.94% | 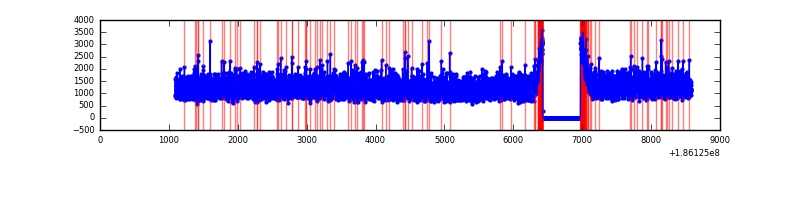 |
| B | 7486 | 6936 | 350 | 350 | 4.68% | 5.05% | 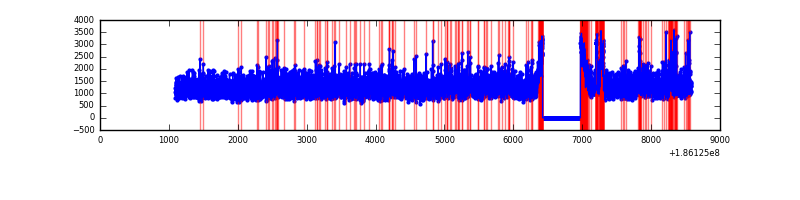 |
| C | 7487 | 6937 | 176 | 176 | 2.35% | 2.54% | 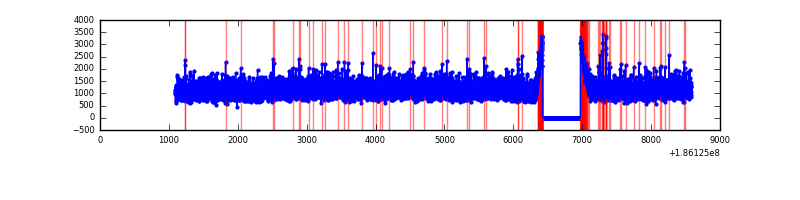 |
| D | 7487 | 6938 | 239 | 239 | 3.19% | 3.44% | 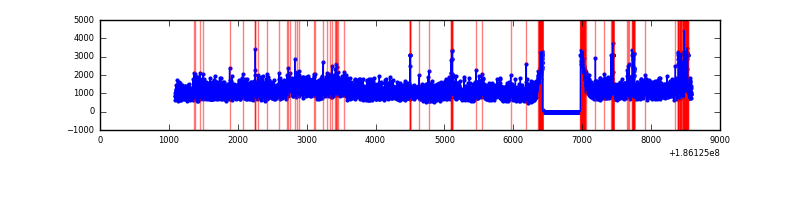 |
Top three noisy pixels from each quadrant. If the there are fewer than three noisy pixels in the level2.evt file, extra rows are filled as -1
| Pixel properties | Quadrant properties | ||||||
|---|---|---|---|---|---|---|---|
| Quadrant | DetID | PixID | Counts | Sigma | Mean | Median | Sigma |
| A | 12 | 189 | 11870 | 18.14 | 2203 | 2222 | 531.8 |
| A | 0 | 214 | 7778 | 10.45 | 2203 | 2222 | 531.8 |
| A | 11 | 79 | 7174 | 9.31 | 2203 | 2222 | 531.8 |
| B | 0 | 184 | 166301 | 305.0 | 2267 | 2279 | 537.8 |
| B | 15 | 22 | 76944 | 138.84 | 2267 | 2279 | 537.8 |
| B | 0 | 23 | 53118 | 94.54 | 2267 | 2279 | 537.8 |
| C | 3 | 111 | 28633 | 46.04 | 2052 | 2131 | 575.6 |
| C | 8 | 208 | 25484 | 40.57 | 2052 | 2131 | 575.6 |
| C | 9 | 54 | 24727 | 39.26 | 2052 | 2131 | 575.6 |
| D | 11 | 131 | 304004 | 510.77 | 2049 | 2095 | 591.1 |
| D | 10 | 85 | 39811 | 63.81 | 2049 | 2095 | 591.1 |
| D | 2 | 16 | 37976 | 60.7 | 2049 | 2095 | 591.1 |
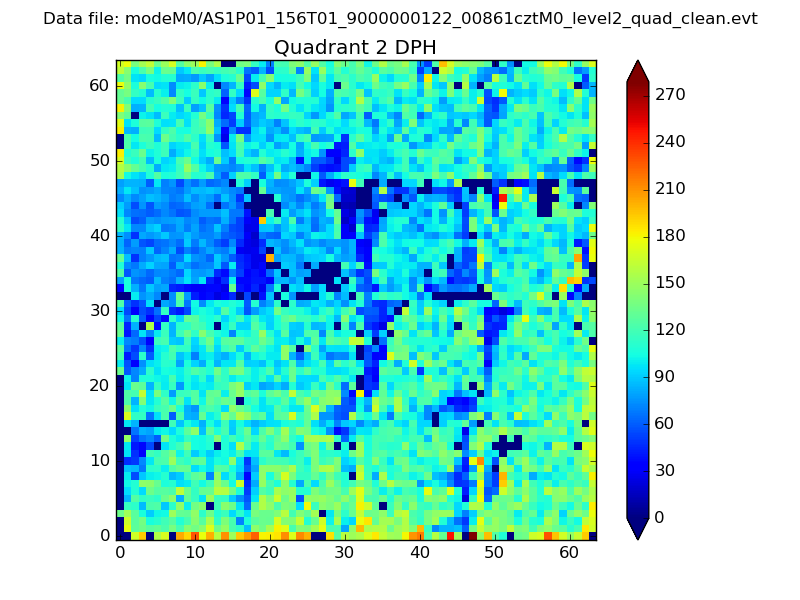
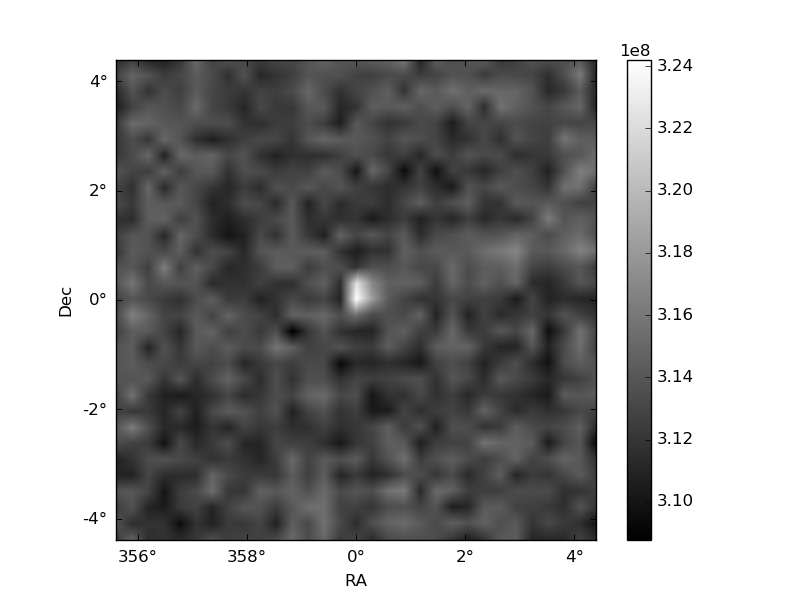
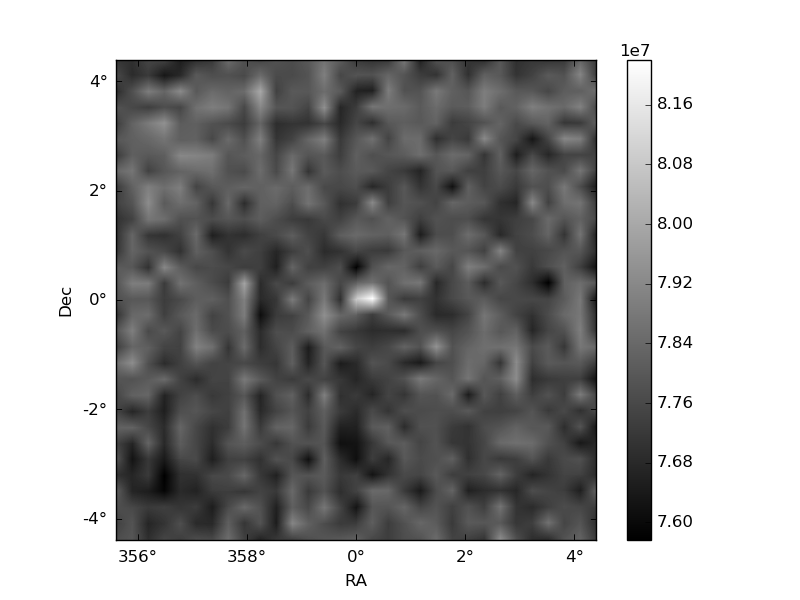
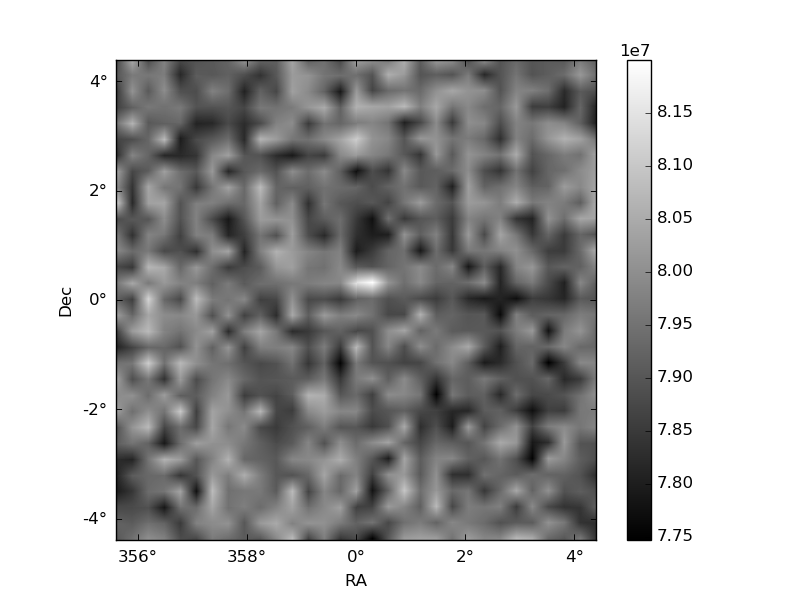
Histogram calculated using DETX and DETY for each event in the final _common_clean file
| Quadrant A | 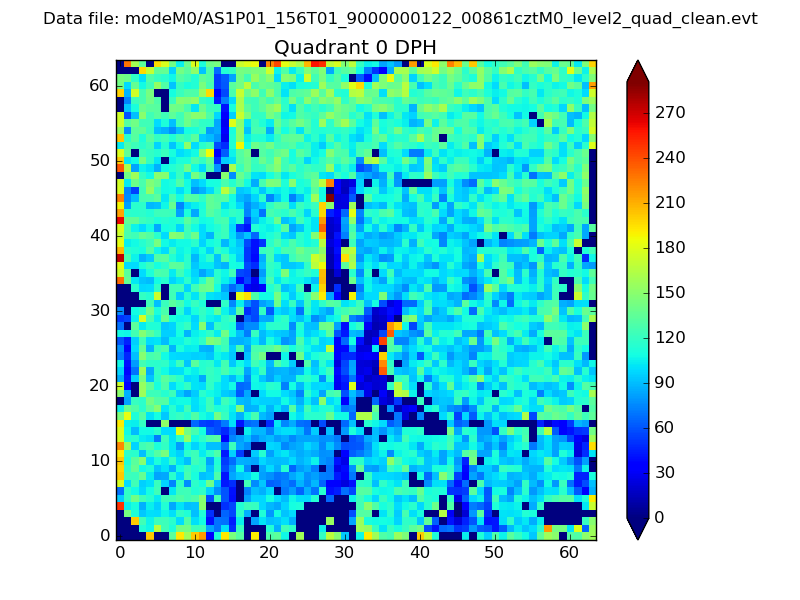 |
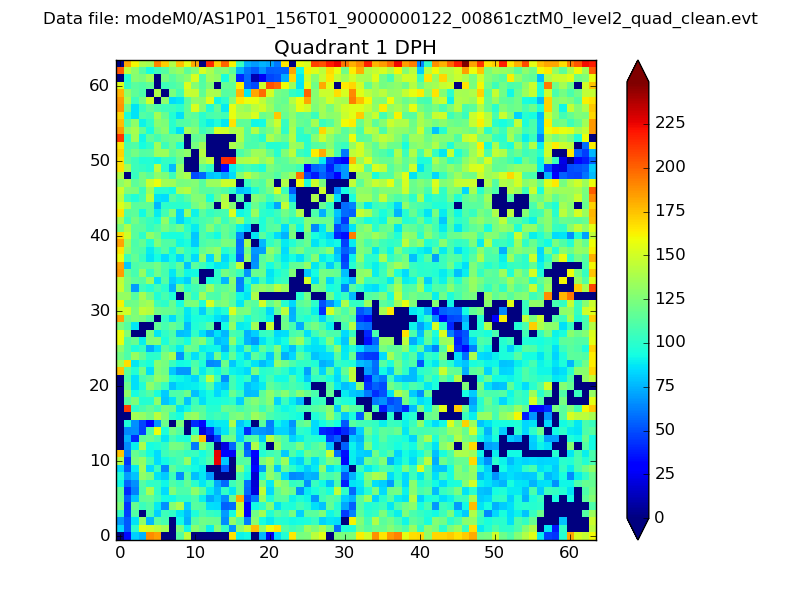 |
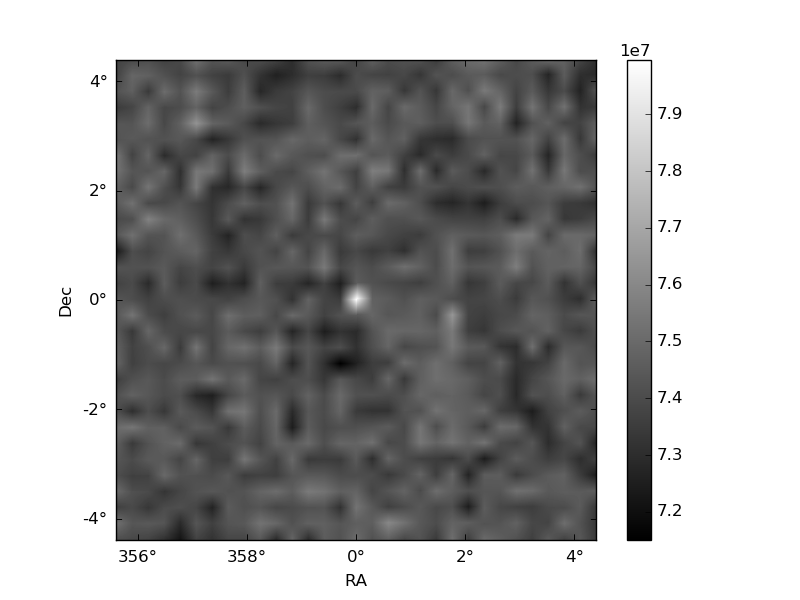
Quadrant B |
|---|---|---|---|
| Quadrant D | 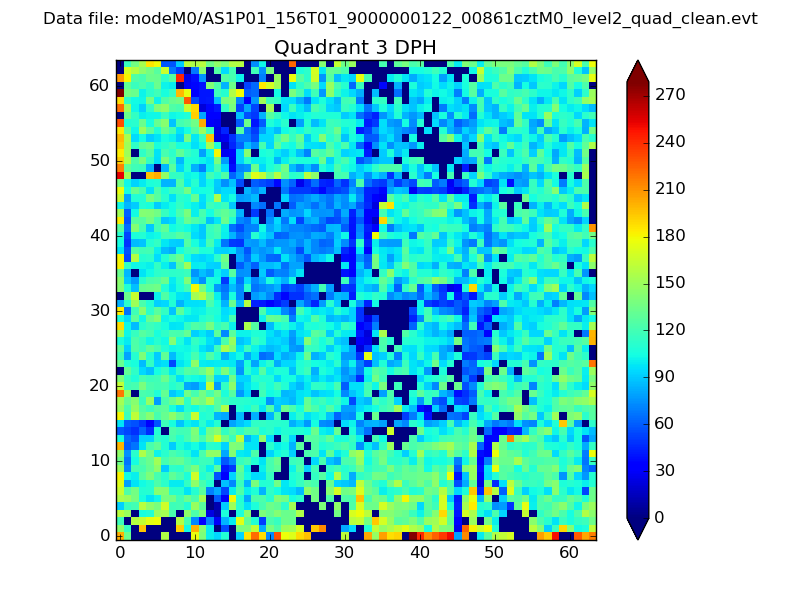 |
 |
Quadrant C |
| Plot type | Count rate plots | Images |
|---|---|---|
| Comparison with Poisson distribution Blue bars denote a histogram of data divided into 1 sec bins. Red curve is a Poisson curve with rate = median count rate of data. |
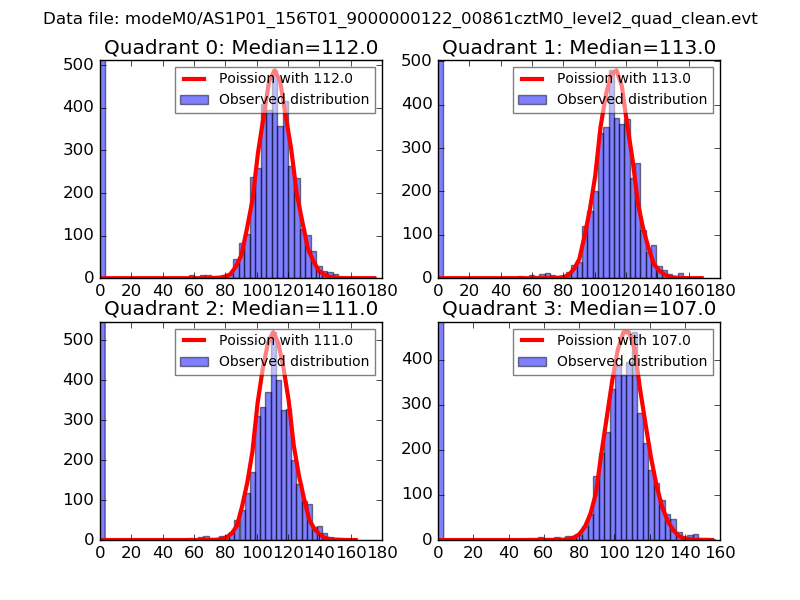 |
 |
| Quadrant-wise count rates Data is divided into 100 sec bins |
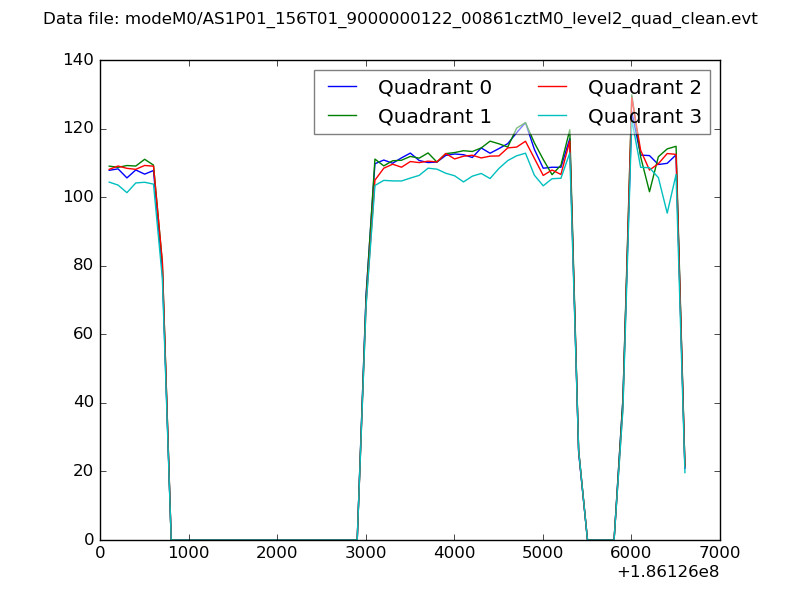 |
|
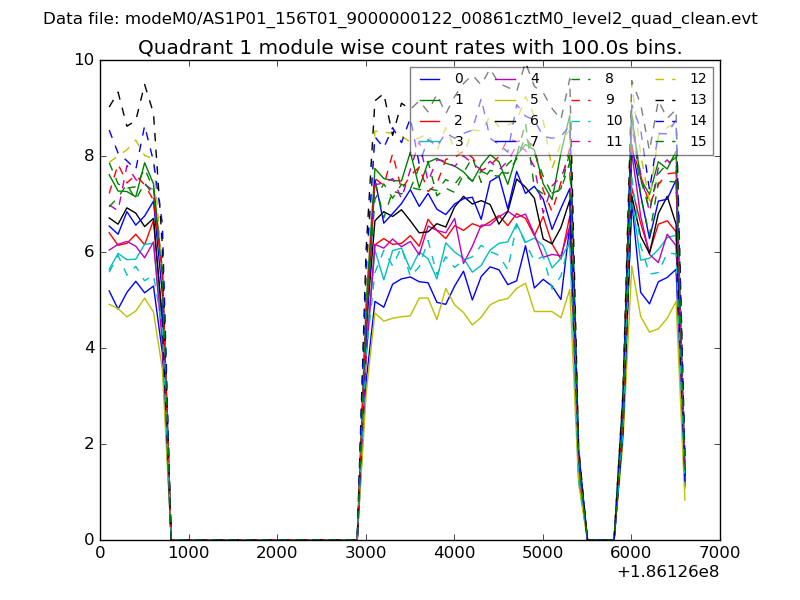
| Module-wise count rates for Quadrant A Data is divided into 100 sec bins |
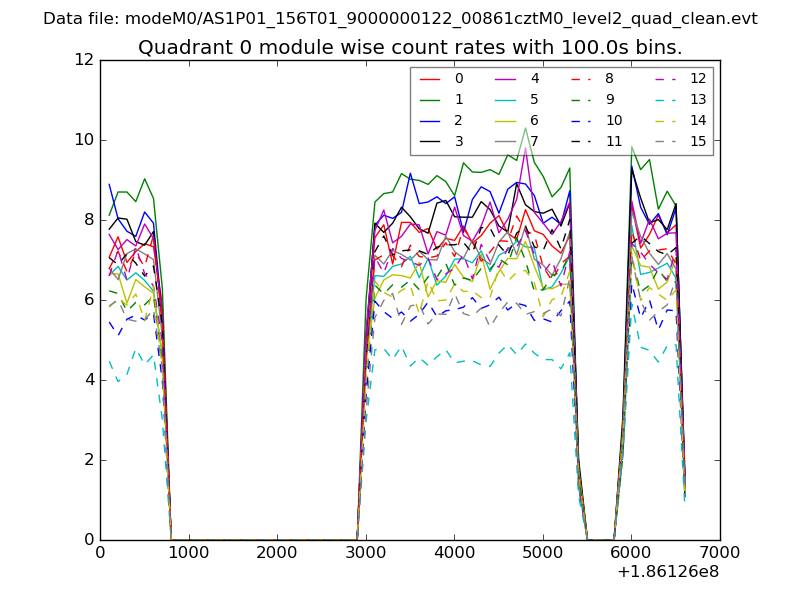 |
 |
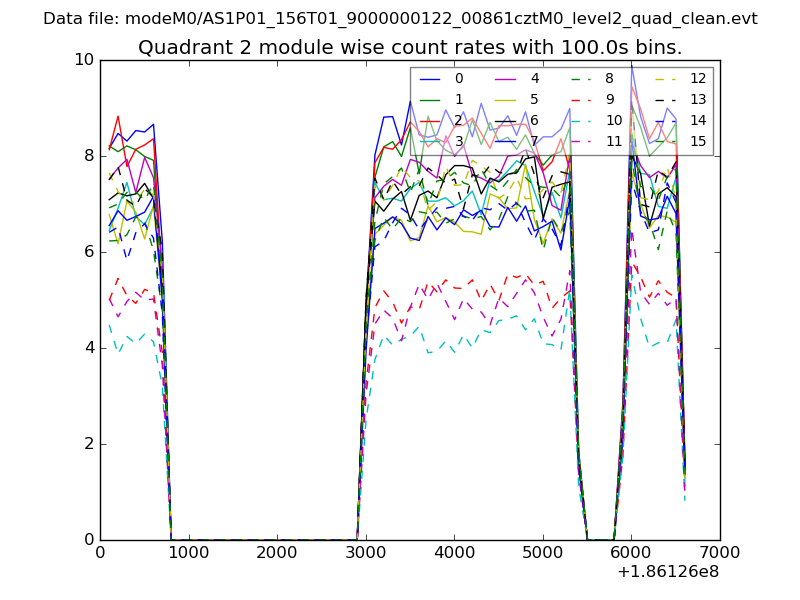
| Module-wise count rates for Quadrant B Data is divided into 100 sec bins |
 |
 |
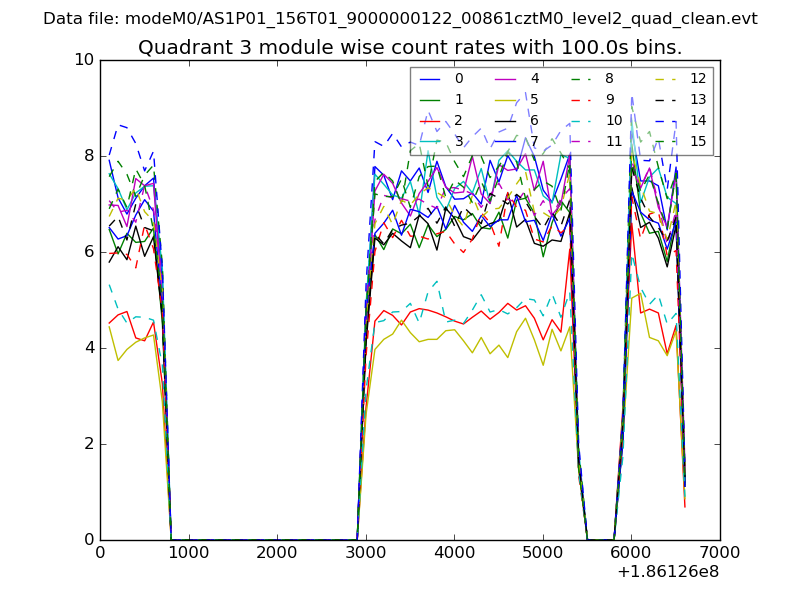
| Module-wise count rates for Quadrant C Data is divided into 100 sec bins |
 |
 |
| Module-wise count rates for Quadrant D Data is divided into 100 sec bins |
 |
 |
| Parameter | Plot |
|---|---|
| CZT HV Monitor | 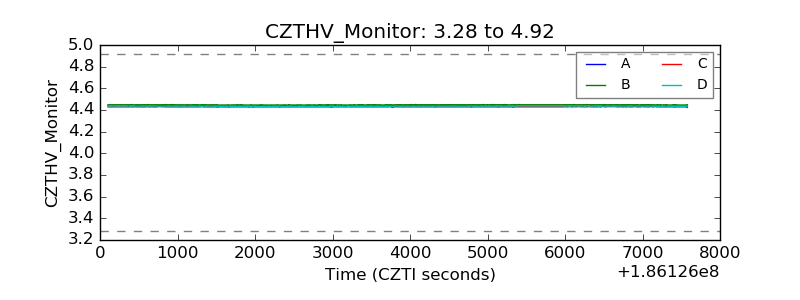 |
| D_VDD | 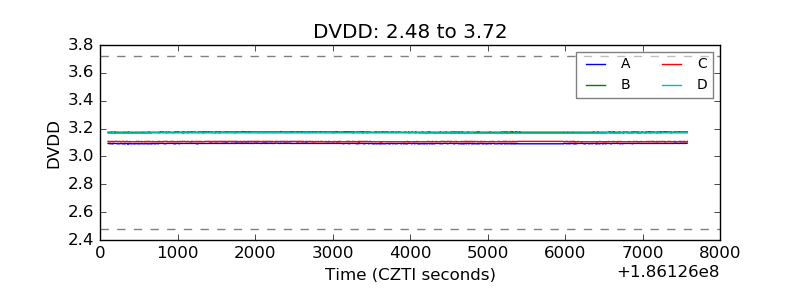 |
| Temperature 1 | 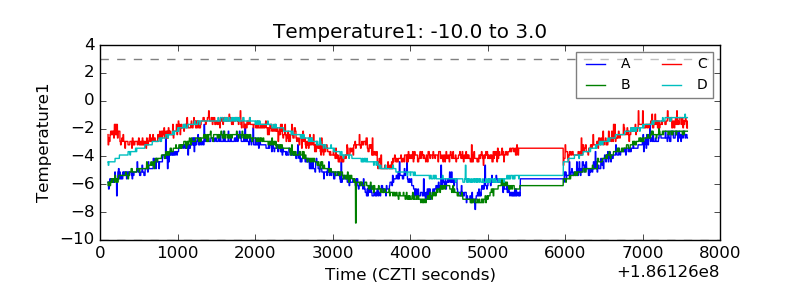 |
| Veto HV Monitor | 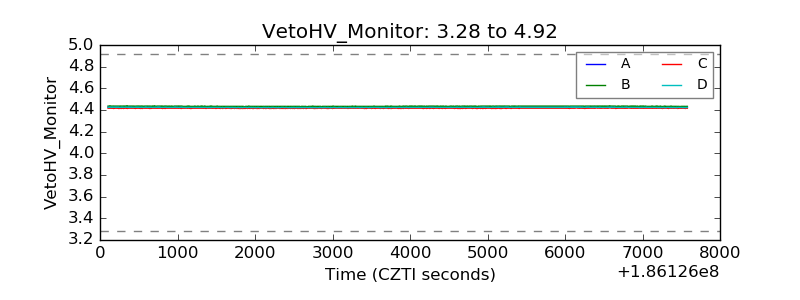 |
| Veto LLD | 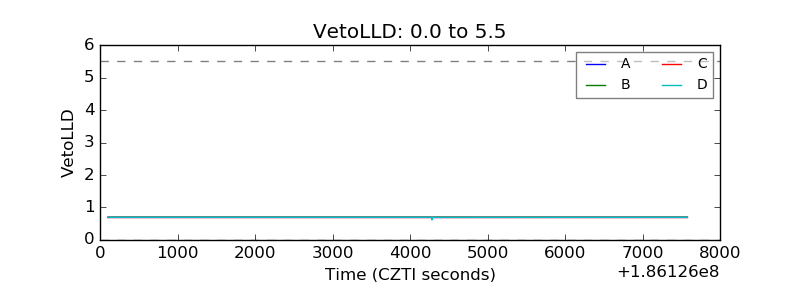 |
| Alpha Counter | 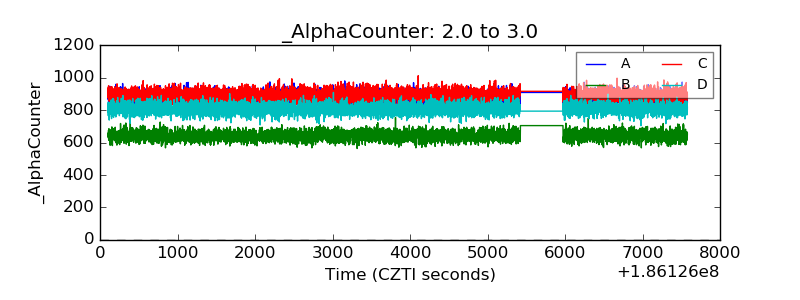 |
| _CPM_Rate | 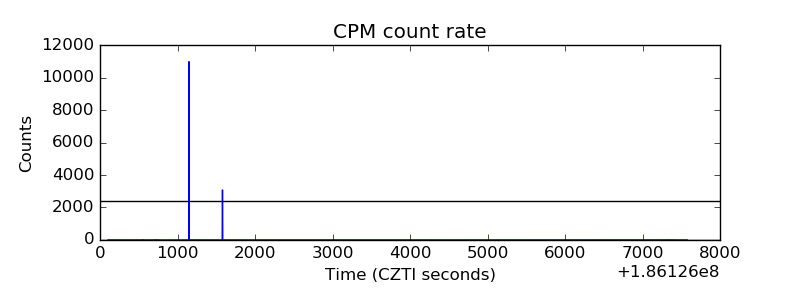 |
| CZT Counter | 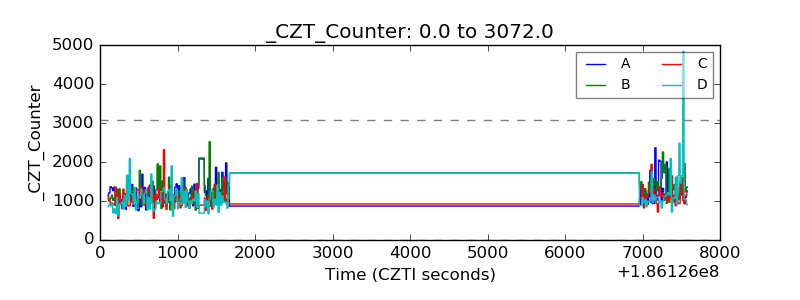 |
| +2.5 Volts monitor |  |
| +5 Volts monitor | 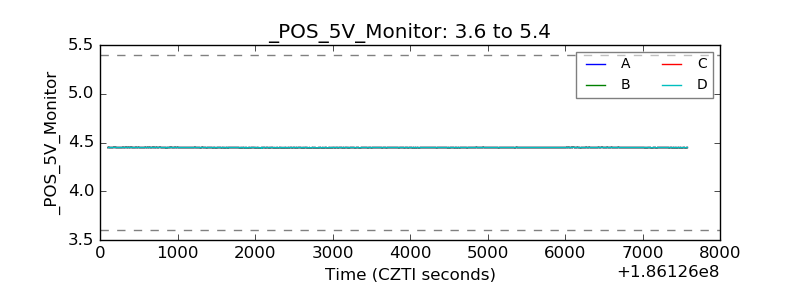 |
| _ROLL_ROT | 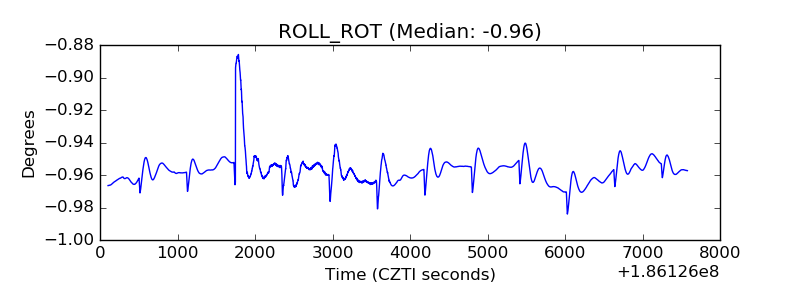 |
| _Roll_DEC | 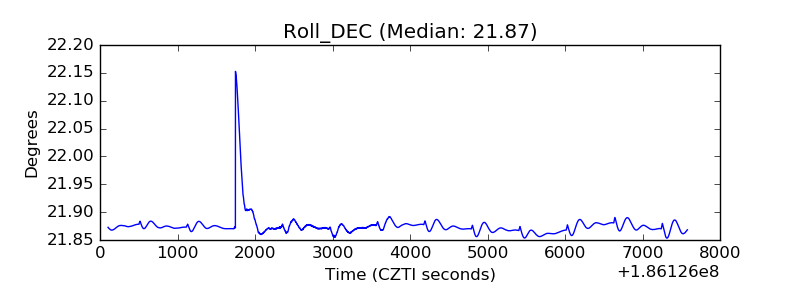 |
| _Roll_RA | 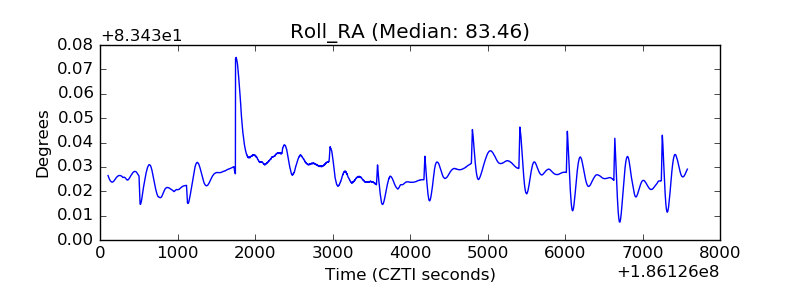 |
| Veto Counter | 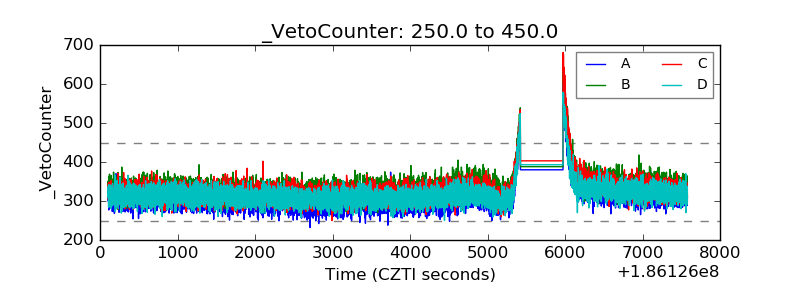 |