| Param | Original file | Final file |
|---|---|---|
| Filename | modeM0/AS1P01_156T01_9000000122_00863cztM0_level2.evt | modeM0/AS1P01_156T01_9000000122_00863cztM0_level2_quad_clean.evt |
| Size (bytes) | 537,419,520 | 20,427,840 |
| Size | 512.5 MB | 19.5 MB |
| Events in quadrant A | 3,925,187 | 99,522 |
| Events in quadrant B | 4,180,558 | 100,098 |
| Events in quadrant C | 3,830,303 | 98,028 |
| Events in quadrant D | 4,127,363 | 93,910 |
| Mode SS | |||
|---|---|---|---|
| Quadrant | BADHDUFLAG | Total packets | Discarded packets |
| A | 0 | 64 | 0 |
| B | 0 | 64 | 0 |
| C | 0 | 64 | 0 |
| D | 0 | 64 | 0 |
| Mode M0 | |||
|---|---|---|---|
| Quadrant | BADHDUFLAG | Total packets | Discarded packets |
| A | 0 | 13904 | 0 |
| B | 0 | 14674 | 0 |
| C | 0 | 13637 | 0 |
| D | 0 | 14508 | 0 |
| Quadrant | Total seconds | Saturated seconds | Saturation percentage |
|---|---|---|---|
| A | 3178 | 1 | 0.031466% |
| B | 3178 | 52 | 1.636249% |
| C | 3179 | 0 | 0.000000% |
| D | 3179 | 85 | 2.673797% |
Noise dominated data is calculated using 1-second bins in cleaned event files. If a bin has >2000 counts, and if more than 50% of those come from <1% of pixels, then it is considered to be noise-dominated and hence unusable.
| Quadrant | # 1 sec bins | Bins with >0 counts | Bins with >2000 counts | High rate bins dominated by noise | Noise dominated (total time) | Noise dominated (detector-on time) | Marked lightcurve |
|---|---|---|---|---|---|---|---|
| A | 3178 | 3178 | 65 | 65 | 2.05% | 2.05% | 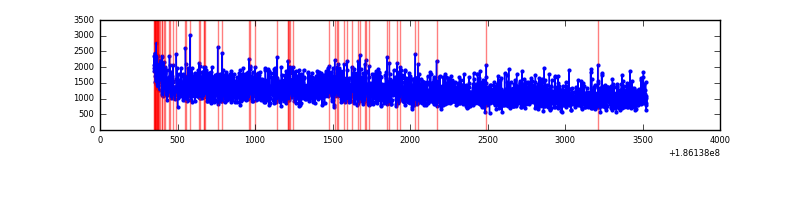 |
| B | 3178 | 3178 | 150 | 150 | 4.72% | 4.72% | 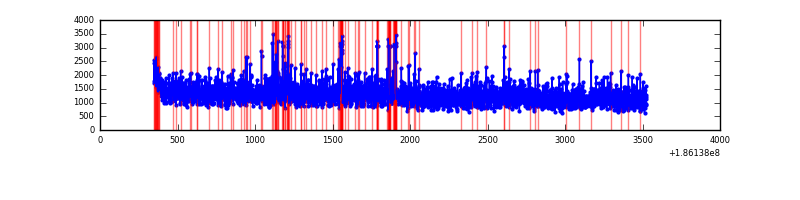 |
| C | 3179 | 3179 | 62 | 62 | 1.95% | 1.95% | 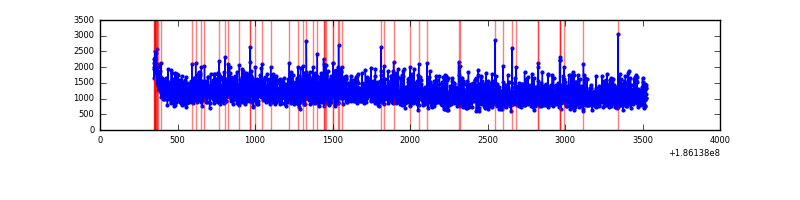 |
| D | 3179 | 3179 | 231 | 231 | 7.27% | 7.27% | 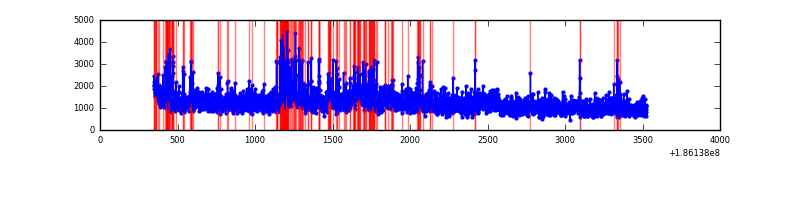 |
Top three noisy pixels from each quadrant. If the there are fewer than three noisy pixels in the level2.evt file, extra rows are filled as -1
| Pixel properties | Quadrant properties | ||||||
|---|---|---|---|---|---|---|---|
| Quadrant | DetID | PixID | Counts | Sigma | Mean | Median | Sigma |
| A | 0 | 253 | 4578 | 14.2 | 1021 | 1028 | 249.9 |
| A | 11 | 79 | 4228 | 12.8 | 1021 | 1028 | 249.9 |
| A | 3 | 111 | 3093 | 8.26 | 1021 | 1028 | 249.9 |
| B | 0 | 184 | 110166 | 442.04 | 1035 | 1041 | 246.9 |
| B | 0 | 220 | 39641 | 156.36 | 1035 | 1041 | 246.9 |
| B | 5 | 249 | 38982 | 153.69 | 1035 | 1041 | 246.9 |
| C | 8 | 208 | 17338 | 59.87 | 965 | 995 | 273.0 |
| C | 3 | 111 | 12697 | 42.87 | 965 | 995 | 273.0 |
| C | 10 | 19 | 10162 | 33.58 | 965 | 995 | 273.0 |
| D | 2 | 16 | 161952 | 527.25 | 990 | 1001 | 305.3 |
| D | 12 | 22 | 157474 | 512.58 | 990 | 1001 | 305.3 |
| D | 7 | 207 | 13796 | 41.91 | 990 | 1001 | 305.3 |
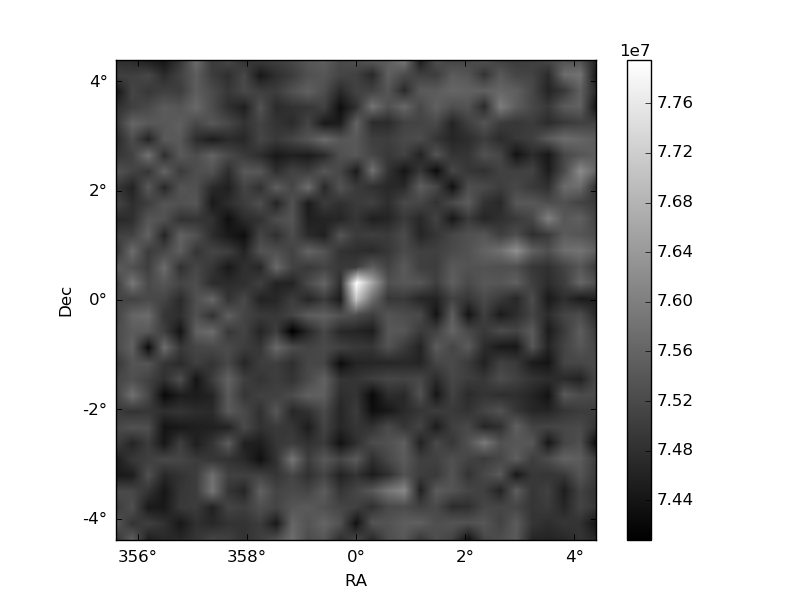
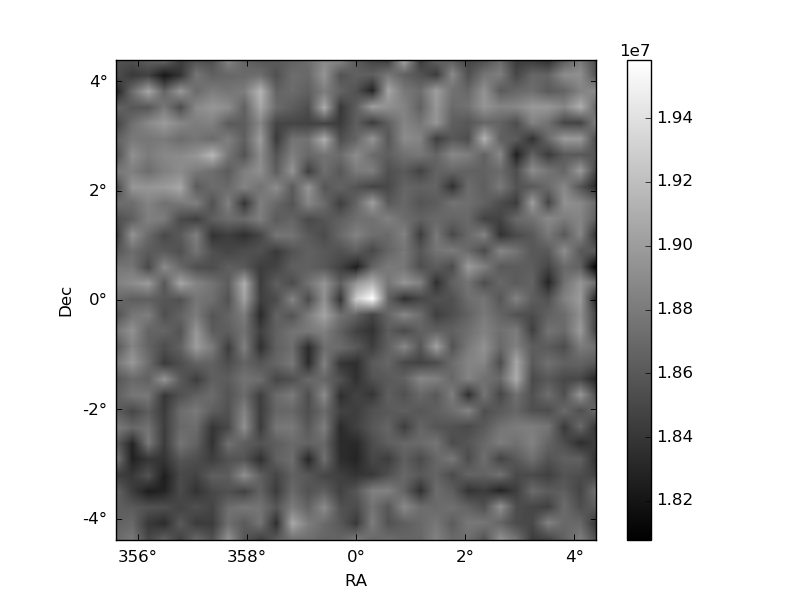
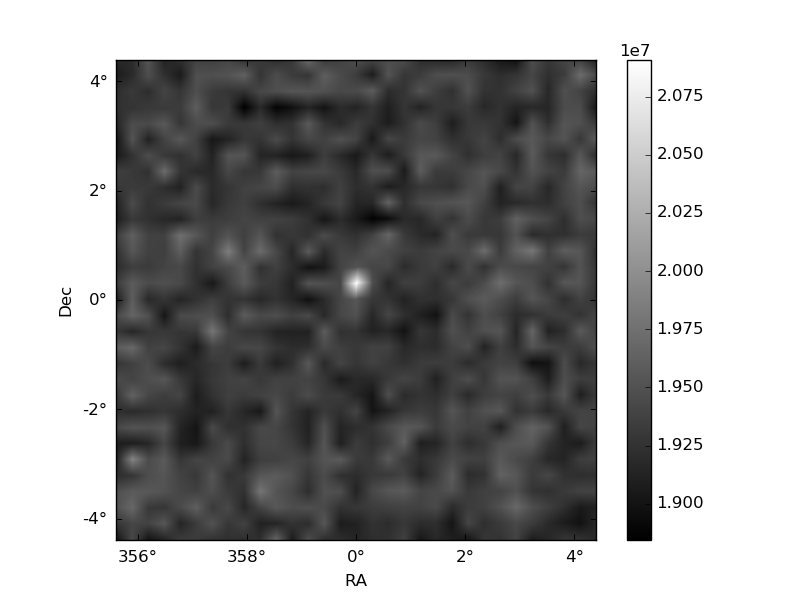
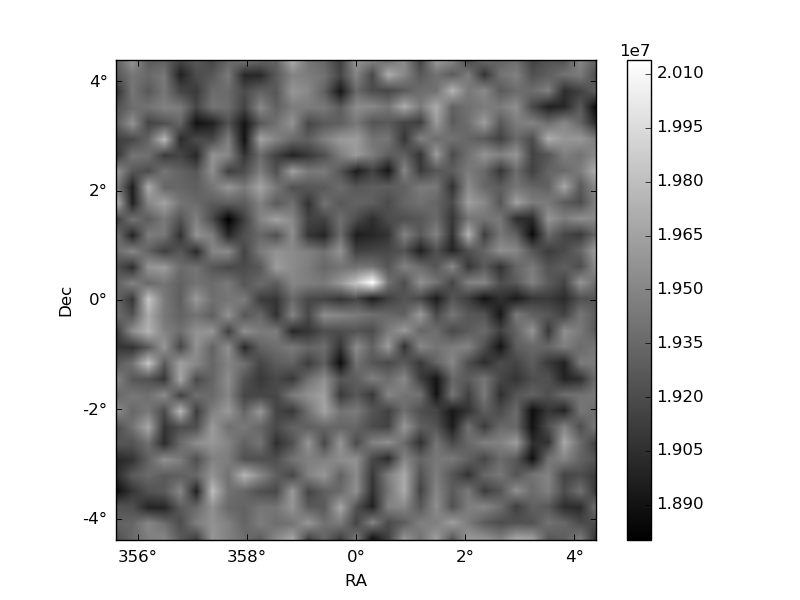
Histogram calculated using DETX and DETY for each event in the final _common_clean file
| Quadrant A | 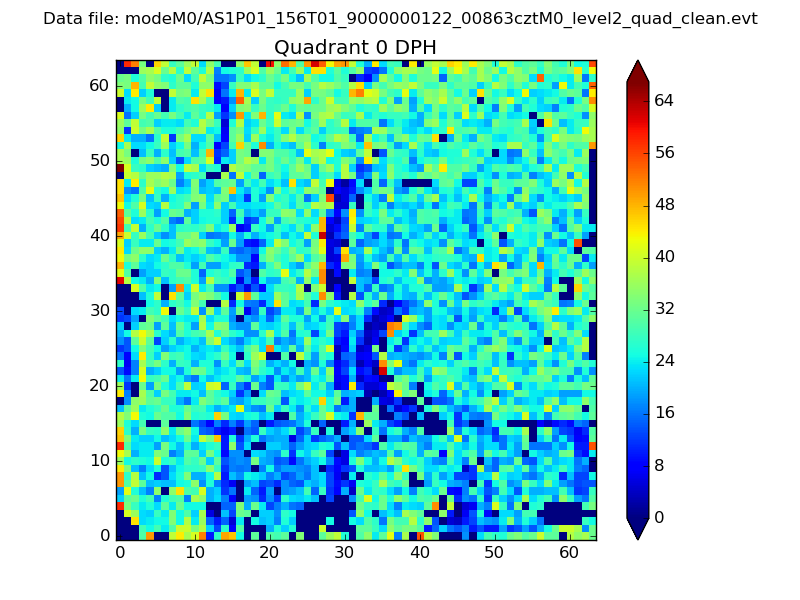 |
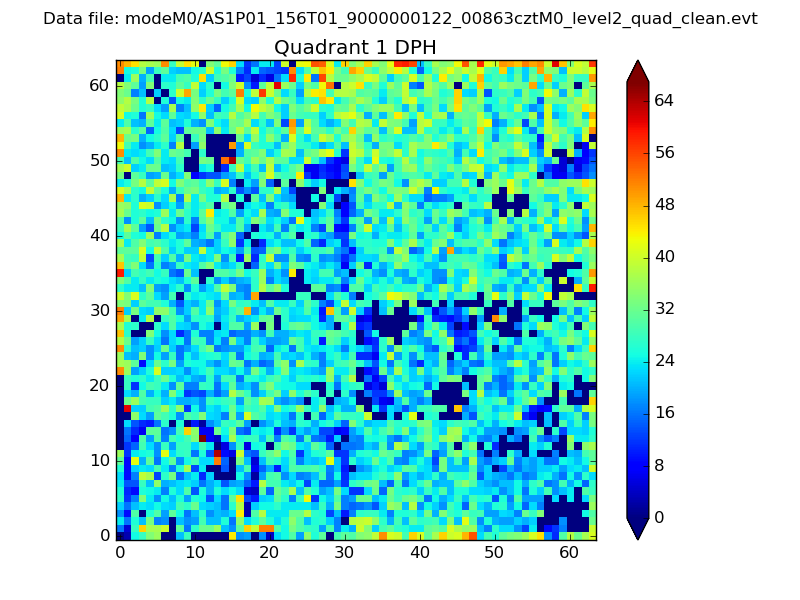 |
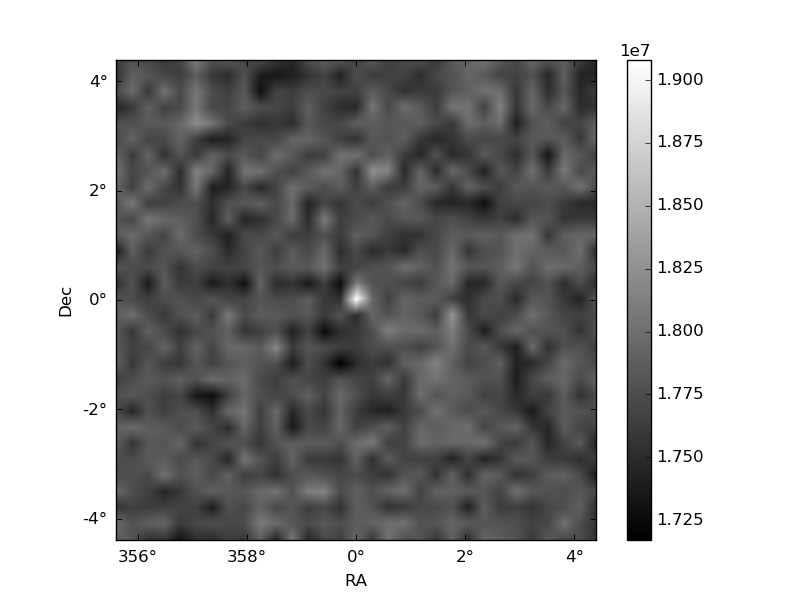
Quadrant B |
|---|---|---|---|
| Quadrant D | 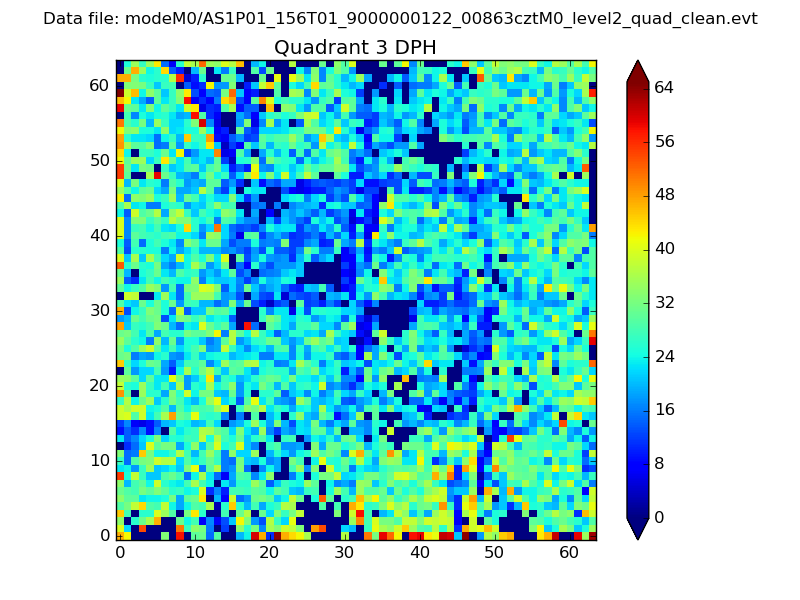 |
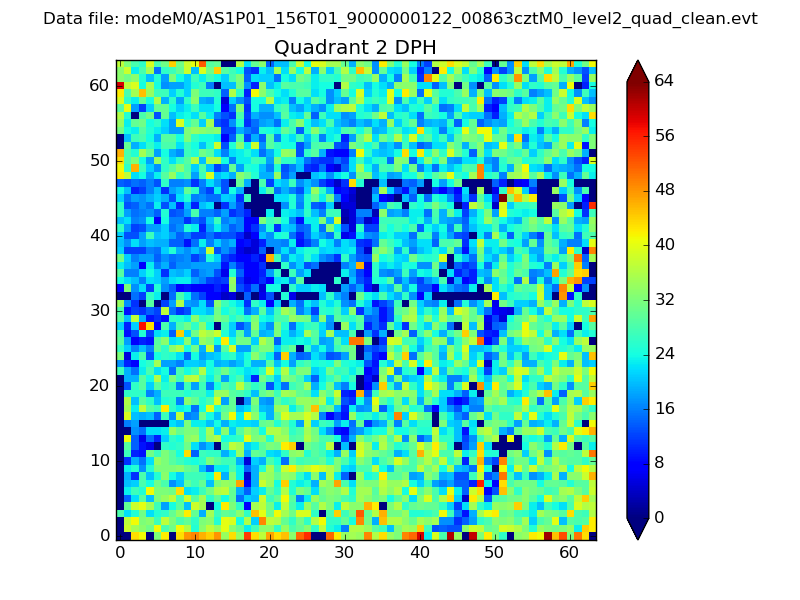 |
Quadrant C |
| Plot type | Count rate plots | Images |
|---|---|---|
| Comparison with Poisson distribution Blue bars denote a histogram of data divided into 1 sec bins. Red curve is a Poisson curve with rate = median count rate of data. |
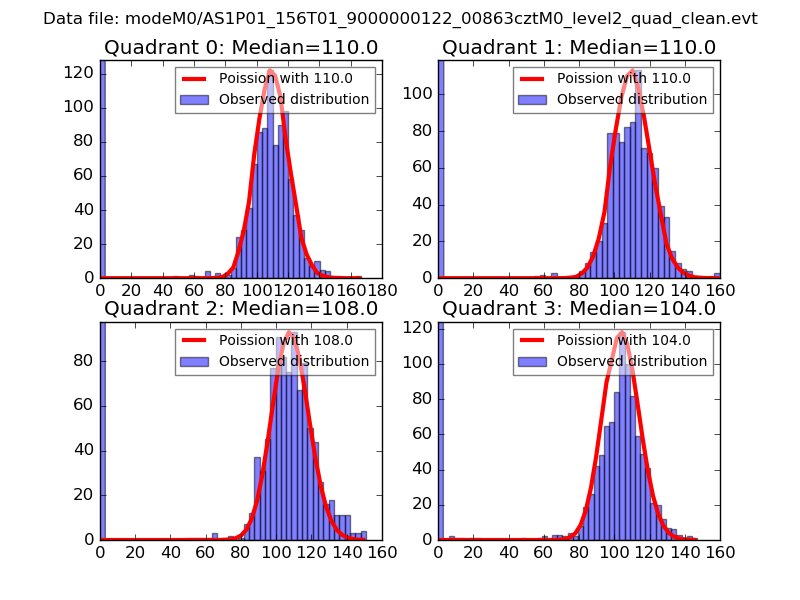 |
 |
| Quadrant-wise count rates Data is divided into 100 sec bins |
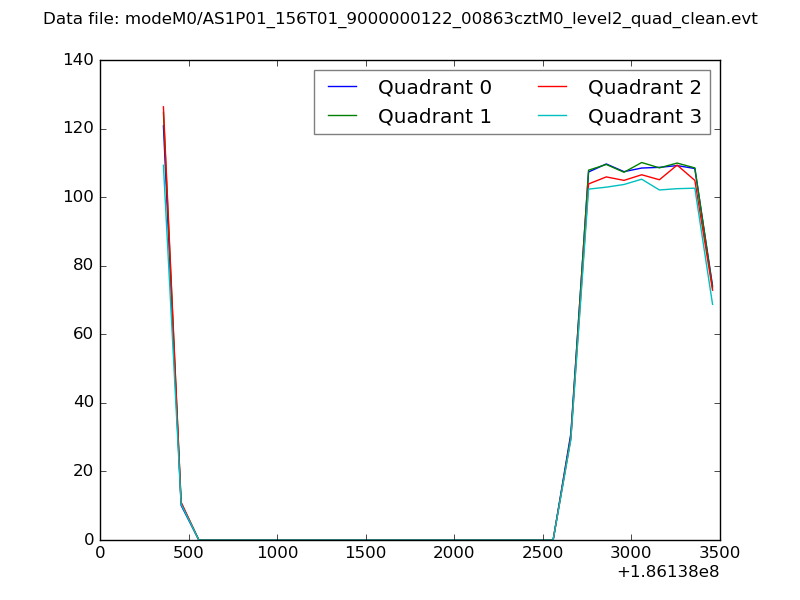 |
|
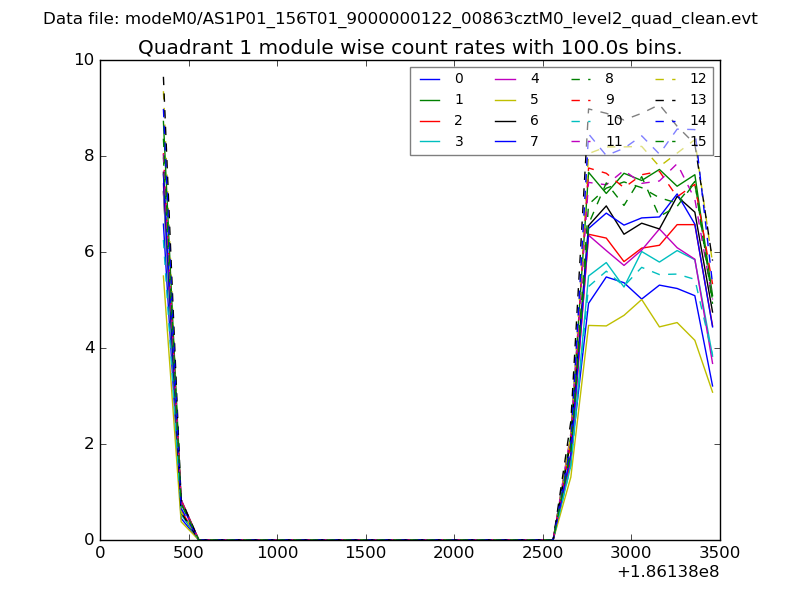
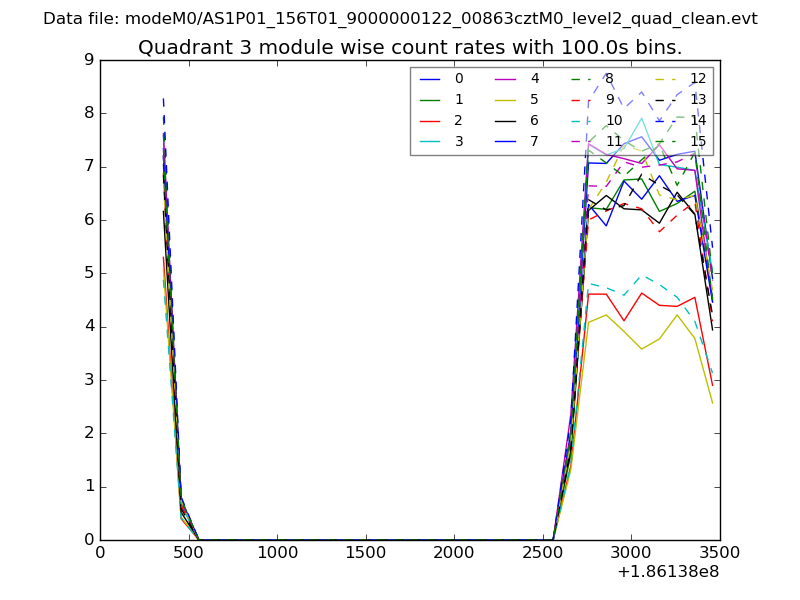
| Module-wise count rates for Quadrant A Data is divided into 100 sec bins |
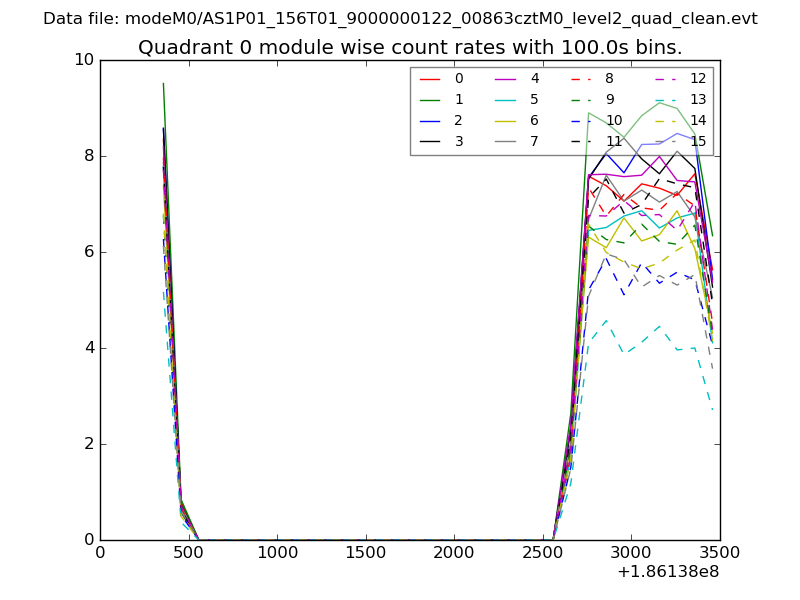 |
 |
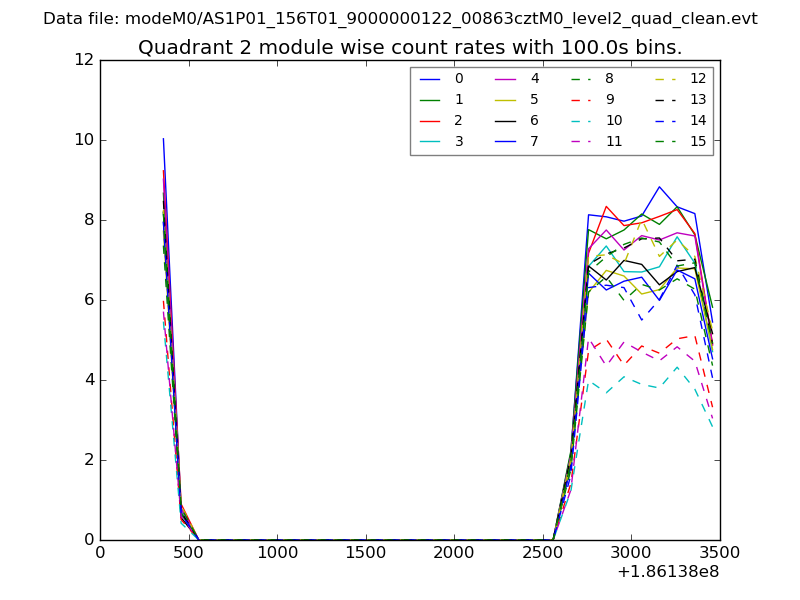
| Module-wise count rates for Quadrant B Data is divided into 100 sec bins |
 |
 |
| Module-wise count rates for Quadrant C Data is divided into 100 sec bins |
 |
 |
| Module-wise count rates for Quadrant D Data is divided into 100 sec bins |
 |
 |
| Parameter | Plot |
|---|---|
| CZT HV Monitor | 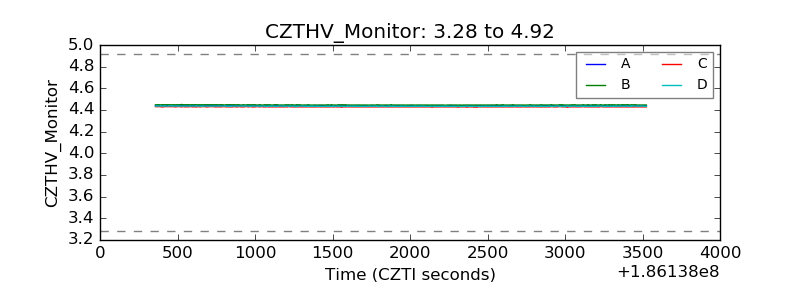 |
| D_VDD | 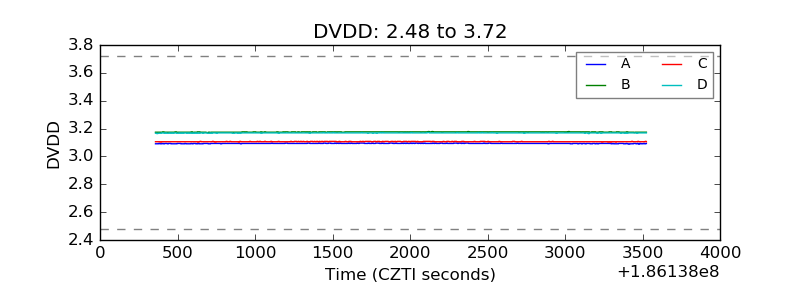 |
| Temperature 1 | 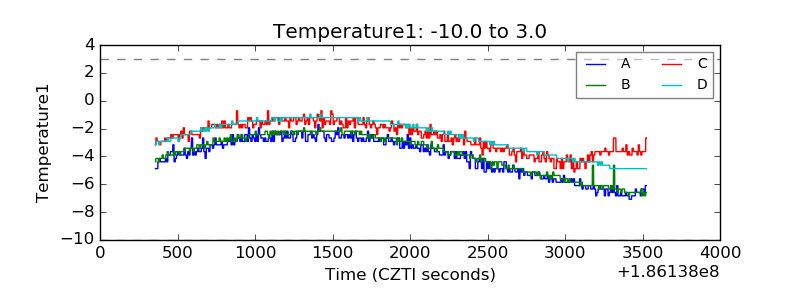 |
| Veto HV Monitor | 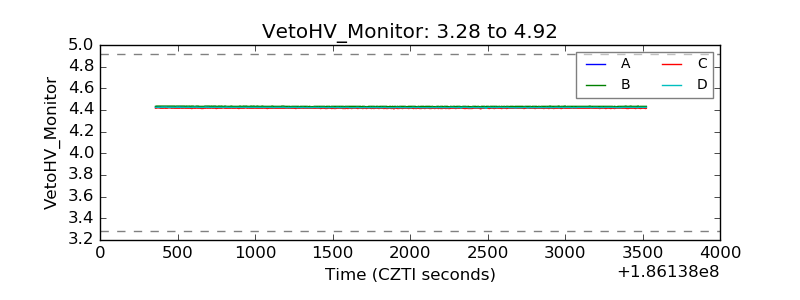 |
| Veto LLD | 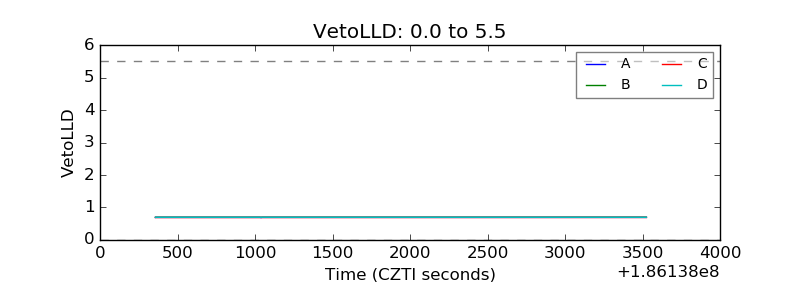 |
| Alpha Counter | 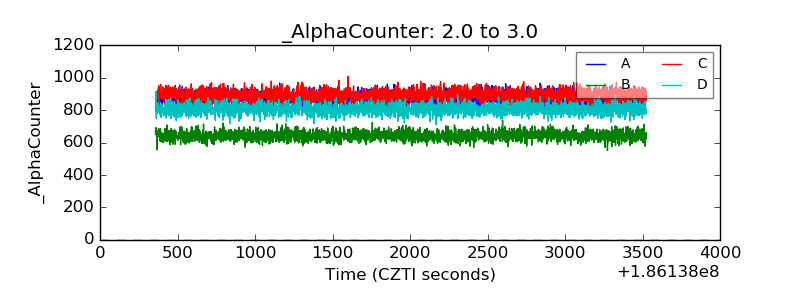 |
| _CPM_Rate | 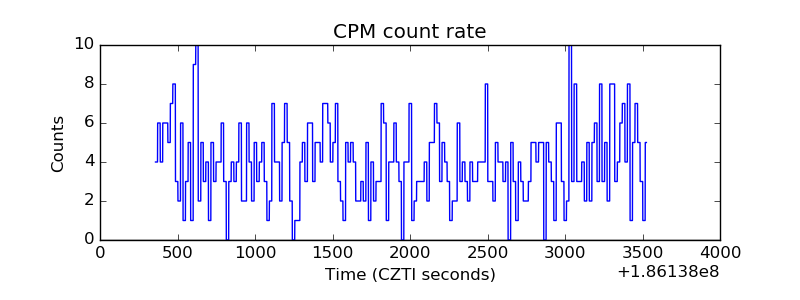 |
| CZT Counter | 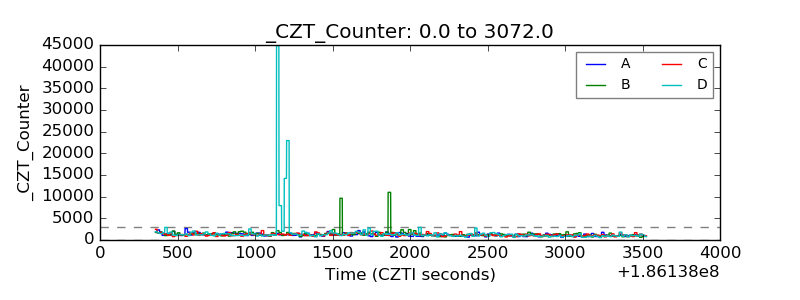 |
| +2.5 Volts monitor |  |
| +5 Volts monitor |  |
| _ROLL_ROT | 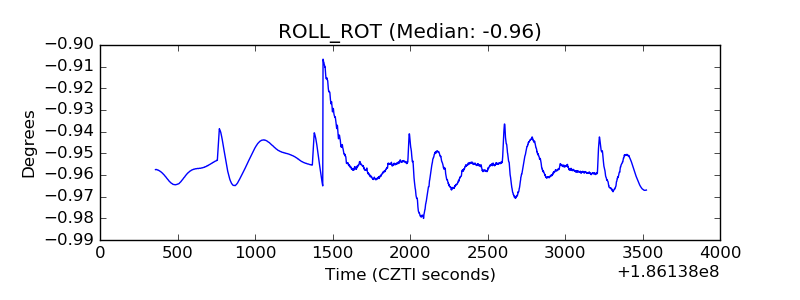 |
| _Roll_DEC | 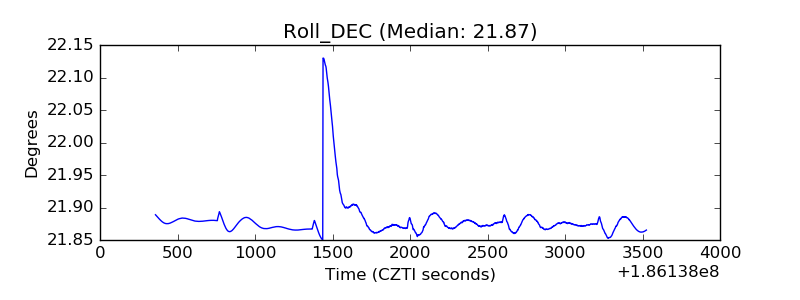 |
| _Roll_RA | 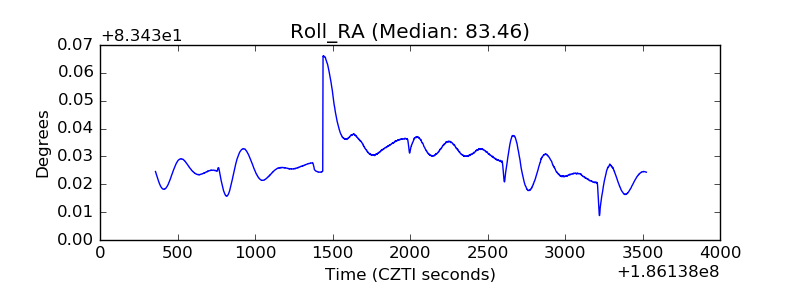 |
| Veto Counter | 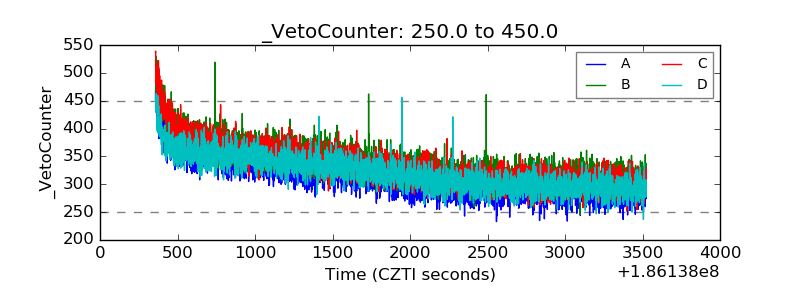 |