| Param | Original file | Final file |
|---|---|---|
| Filename | modeM0/AS1P01_161T02_9000000124cztM0_level2.fits | modeM0/AS1P01_161T02_9000000124cztM0_level2_quad_clean.evt |
| Size (bytes) | 197,104,320 | 207,587,520 |
| Size | 188.0 MB | 198.0 MB |
| Events in quadrant A | 1,159,700 | 1,245,966 |
| Events in quadrant B | 1,141,402 | 1,234,094 |
| Events in quadrant C | 1,139,394 | 1,176,418 |
| Events in quadrant D | 974,236 | 1,075,028 |
| Mode SS | |||
|---|---|---|---|
| Quadrant | BADHDUFLAG | Total packets | Discarded packets |
| A | 0 | 462 | 0 |
| B | 0 | 462 | 0 |
| C | 0 | 462 | 0 |
| D | 0 | 462 | 0 |
| Mode M0 | |||
|---|---|---|---|
| Quadrant | BADHDUFLAG | Total packets | Discarded packets |
| A | 0 | 95043 | 0 |
| B | 0 | 99670 | 0 |
| C | 0 | 93987 | 0 |
| D | 0 | 97164 | 0 |
| Mode M9 | |||
|---|---|---|---|
| Quadrant | BADHDUFLAG | Total packets | Discarded packets |
| A | 0 | 58 | 0 |
| B | 0 | 58 | 0 |
| C | 0 | 58 | 0 |
| D | 0 | 58 | 0 |
| Quadrant | Total seconds | Saturated seconds | Saturation percentage |
|---|---|---|---|
| A | 22587 | 94 | 0.416169% |
| B | 22587 | 83 | 0.367468% |
| C | 22587 | 68 | 0.301058% |
| D | 22587 | 484 | 2.142826% |
Noise dominated data is calculated using 1-second bins in cleaned event files. If a bin has >2000 counts, and if more than 50% of those come from <1% of pixels, then it is considered to be noise-dominated and hence unusable.
| Quadrant | # 1 sec bins | Bins with >0 counts | Bins with >2000 counts | High rate bins dominated by noise | Noise dominated (total time) | Noise dominated (detector-on time) | Marked lightcurve |
|---|---|---|---|---|---|---|---|
| A | 28407 | 22584 | 0 | 0 | 0.00% | 0.00% |  |
| B | 28407 | 22584 | 0 | 0 | 0.00% | 0.00% |  |
| C | 28407 | 22583 | 0 | 0 | 0.00% | 0.00% |  |
| D | 28406 | 22558 | 0 | 0 | 0.00% | 0.00% |  |
Top three noisy pixels from each quadrant. If the there are fewer than three noisy pixels in the level2.evt file, extra rows are filled as -1
| Pixel properties | Quadrant properties | ||||||
|---|---|---|---|---|---|---|---|
| Quadrant | DetID | PixID | Counts | Sigma | Mean | Median | Sigma |
| A | 0 | 29 | 1075 | 11.38 | 300 | 282 | 69.7 |
| A | 7 | 110 | 993 | 10.21 | 300 | 282 | 69.7 |
| A | 14 | 188 | 865 | 8.37 | 300 | 282 | 69.7 |
| B | 2 | 9 | 864 | 10.48 | 301 | 288 | 54.9 |
| B | 10 | 225 | 748 | 8.37 | 301 | 288 | 54.9 |
| B | 14 | 254 | 709 | 7.66 | 301 | 288 | 54.9 |
| C | 12 | 241 | 793 | 6.85 | 301 | 280 | 74.9 |
| C | 2 | 191 | 765 | 6.48 | 301 | 280 | 74.9 |
| C | 9 | 242 | 729 | 6.0 | 301 | 280 | 74.9 |
| D | 6 | 44 | 707 | 6.81 | 278 | 256 | 66.2 |
| D | 6 | 114 | 704 | 6.76 | 278 | 256 | 66.2 |
| D | 6 | 231 | 704 | 6.76 | 278 | 256 | 66.2 |
Histogram calculated using DETX and DETY for each event in the final _common_clean file
| Quadrant A | 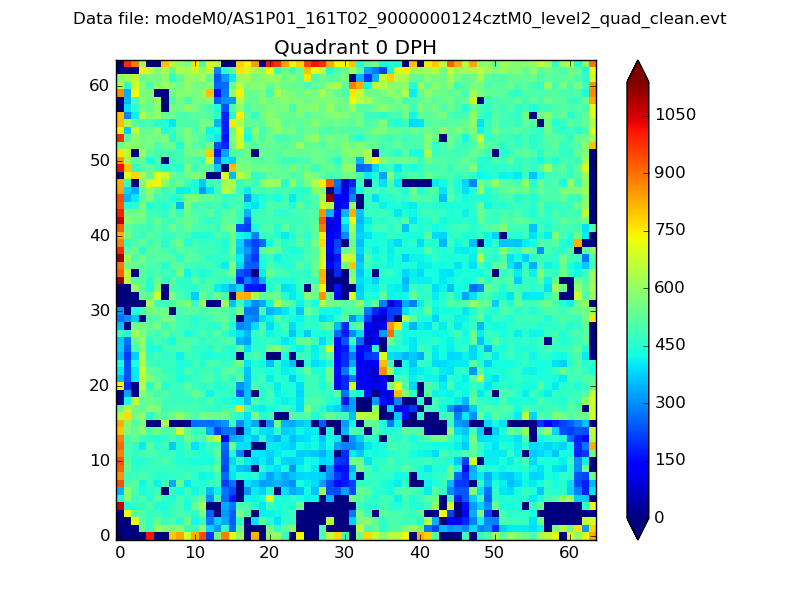 |
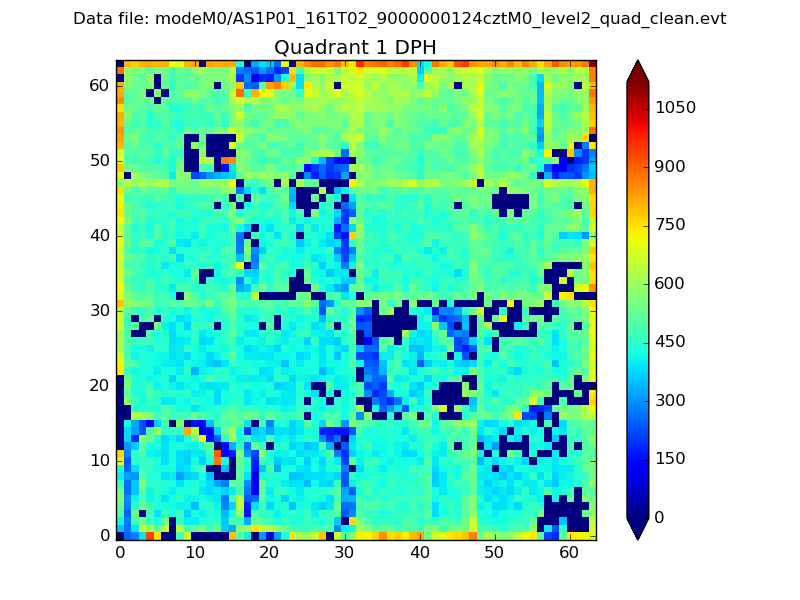 |
Quadrant B |
|---|---|---|---|
| Quadrant D |  |
 |
Quadrant C |
| Plot type | Count rate plots | Images |
|---|---|---|
| Comparison with Poisson distribution Blue bars denote a histogram of data divided into 1 sec bins. Red curve is a Poisson curve with rate = median count rate of data. |
 |
 |
| Quadrant-wise count rates Data is divided into 100 sec bins |
 |
|
| Module-wise count rates for Quadrant A Data is divided into 100 sec bins |
 |
 |
| Module-wise count rates for Quadrant B Data is divided into 100 sec bins |
 |
 |
| Module-wise count rates for Quadrant C Data is divided into 100 sec bins |
 |
 |
| Module-wise count rates for Quadrant D Data is divided into 100 sec bins |
 |
 |
| Parameter | Plot |
|---|---|
| CZT HV Monitor |  |
| D_VDD |  |
| Temperature 1 |  |
| Veto HV Monitor |  |
| Veto LLD |  |
| Alpha Counter |  |
| _CPM_Rate |  |
| CZT Counter |  |
| +2.5 Volts monitor |  |
| +5 Volts monitor |  |
| _ROLL_ROT |  |
| _Roll_DEC |  |
| _Roll_RA |  |
| Veto Counter |  |