| Param | Original file | Final file |
|---|---|---|
| Filename | modeM0/AS1P01_161T02_9000000124_00865cztM0_level2.evt | modeM0/AS1P01_161T02_9000000124_00865cztM0_level2_quad_clean.evt |
| Size (bytes) | 1,072,641,600 | 89,593,920 |
| Size | 1023.0 MB | 85.4 MB |
| Events in quadrant A | 7,707,229 | 580,908 |
| Events in quadrant B | 8,098,051 | 579,886 |
| Events in quadrant C | 7,421,783 | 563,215 |
| Events in quadrant D | 8,830,344 | 538,809 |
| Mode SS | |||
|---|---|---|---|
| Quadrant | BADHDUFLAG | Total packets | Discarded packets |
| A | 0 | 132 | 0 |
| B | 0 | 132 | 0 |
| C | 0 | 132 | 0 |
| D | 0 | 132 | 0 |
| Mode M0 | |||
|---|---|---|---|
| Quadrant | BADHDUFLAG | Total packets | Discarded packets |
| A | 0 | 27520 | 0 |
| B | 0 | 28611 | 0 |
| C | 0 | 26632 | 0 |
| D | 0 | 30827 | 0 |
| Mode M9 | |||
|---|---|---|---|
| Quadrant | BADHDUFLAG | Total packets | Discarded packets |
| A | 0 | 11 | 0 |
| B | 0 | 11 | 0 |
| C | 0 | 11 | 0 |
| D | 0 | 11 | 0 |
| Quadrant | Total seconds | Saturated seconds | Saturation percentage |
|---|---|---|---|
| A | 6453 | 26 | 0.402913% |
| B | 6453 | 21 | 0.325430% |
| C | 6452 | 17 | 0.263484% |
| D | 6452 | 181 | 2.805332% |
Noise dominated data is calculated using 1-second bins in cleaned event files. If a bin has >2000 counts, and if more than 50% of those come from <1% of pixels, then it is considered to be noise-dominated and hence unusable.
| Quadrant | # 1 sec bins | Bins with >0 counts | Bins with >2000 counts | High rate bins dominated by noise | Noise dominated (total time) | Noise dominated (detector-on time) | Marked lightcurve |
|---|---|---|---|---|---|---|---|
| A | 7543 | 6453 | 162 | 162 | 2.15% | 2.51% | 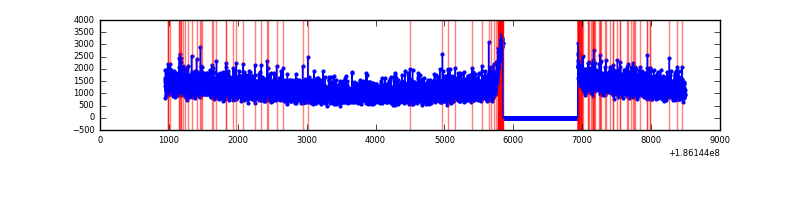 |
| B | 7543 | 6453 | 197 | 197 | 2.61% | 3.05% | 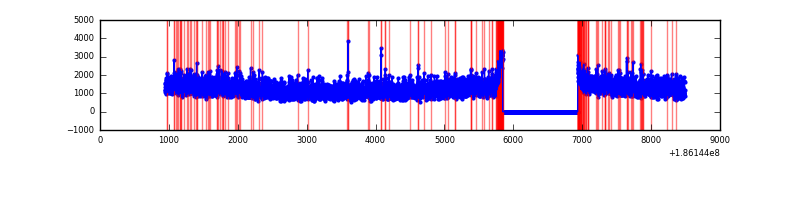 |
| C | 7542 | 6452 | 114 | 114 | 1.51% | 1.77% | 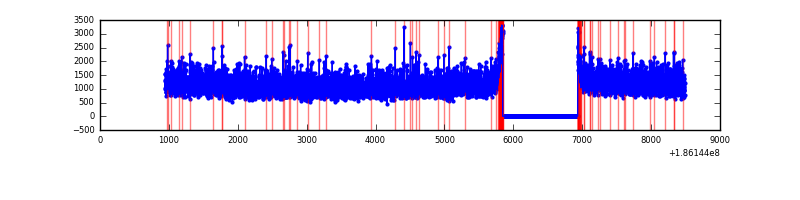 |
| D | 7542 | 6452 | 670 | 670 | 8.88% | 10.38% | 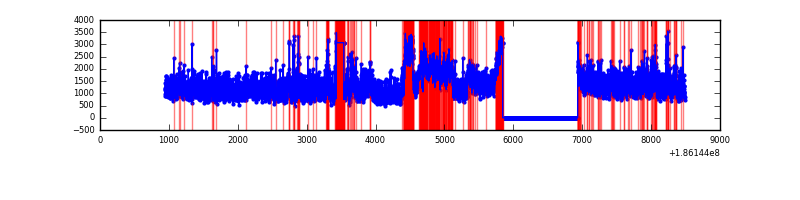 |
Top three noisy pixels from each quadrant. If the there are fewer than three noisy pixels in the level2.evt file, extra rows are filled as -1
| Pixel properties | Quadrant properties | ||||||
|---|---|---|---|---|---|---|---|
| Quadrant | DetID | PixID | Counts | Sigma | Mean | Median | Sigma |
| A | 11 | 79 | 6939 | 10.24 | 2005 | 2017 | 480.5 |
| A | 10 | 133 | 6528 | 9.39 | 2005 | 2017 | 480.5 |
| A | 3 | 111 | 6083 | 8.46 | 2005 | 2017 | 480.5 |
| B | 0 | 220 | 155589 | 313.0 | 2060 | 2069 | 490.5 |
| B | 15 | 22 | 55384 | 108.7 | 2060 | 2069 | 490.5 |
| B | 0 | 23 | 12707 | 21.69 | 2060 | 2069 | 490.5 |
| C | 3 | 111 | 26428 | 46.84 | 1877 | 1942 | 522.8 |
| C | 3 | 79 | 18608 | 31.88 | 1877 | 1942 | 522.8 |
| C | 15 | 241 | 14304 | 23.65 | 1877 | 1942 | 522.8 |
| D | 12 | 22 | 1261074 | 2259.93 | 1831 | 1898 | 557.2 |
| D | 2 | 16 | 333187 | 594.59 | 1831 | 1898 | 557.2 |
| D | 13 | 169 | 216076 | 384.4 | 1831 | 1898 | 557.2 |
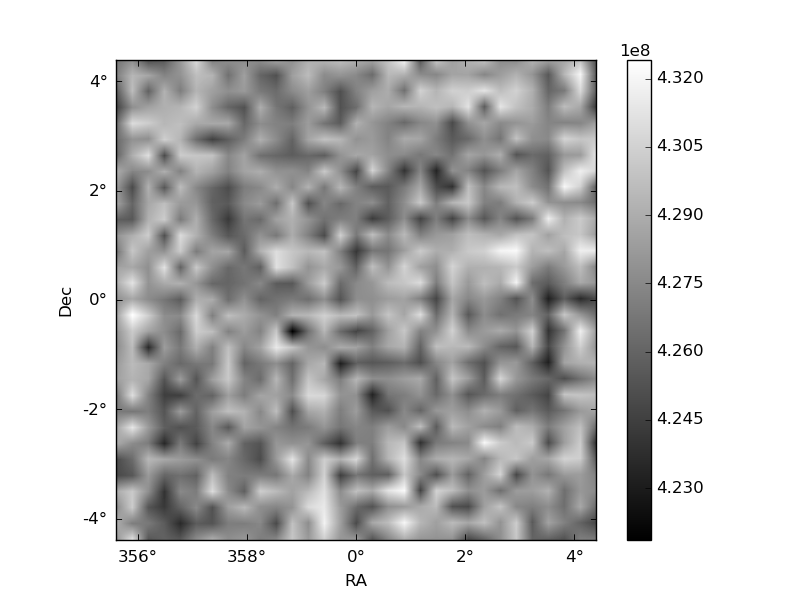
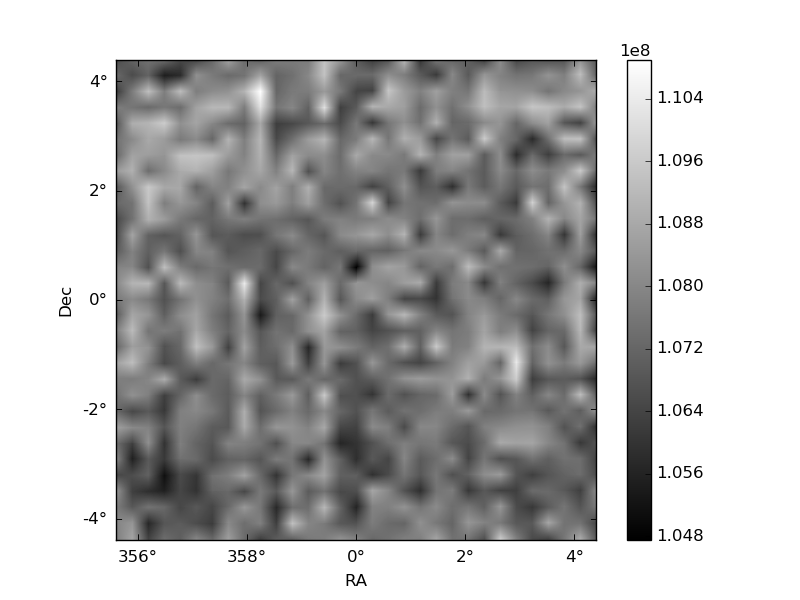
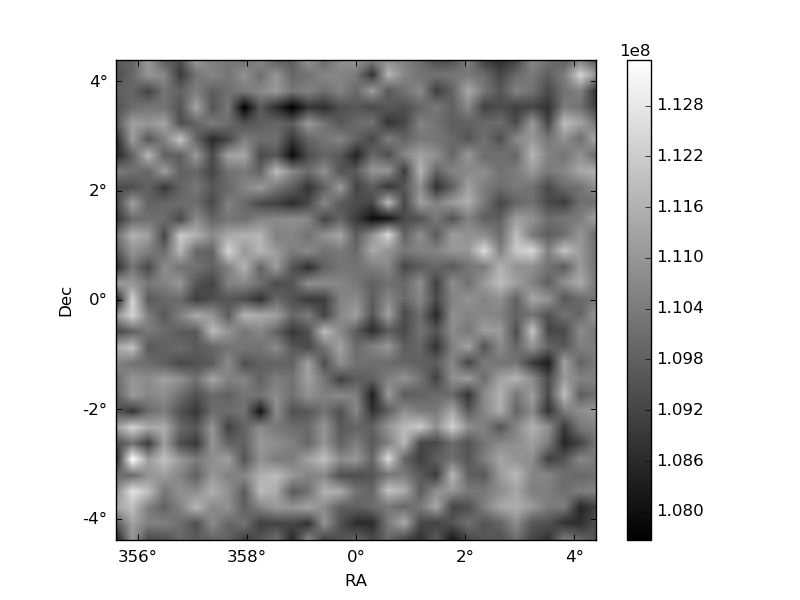
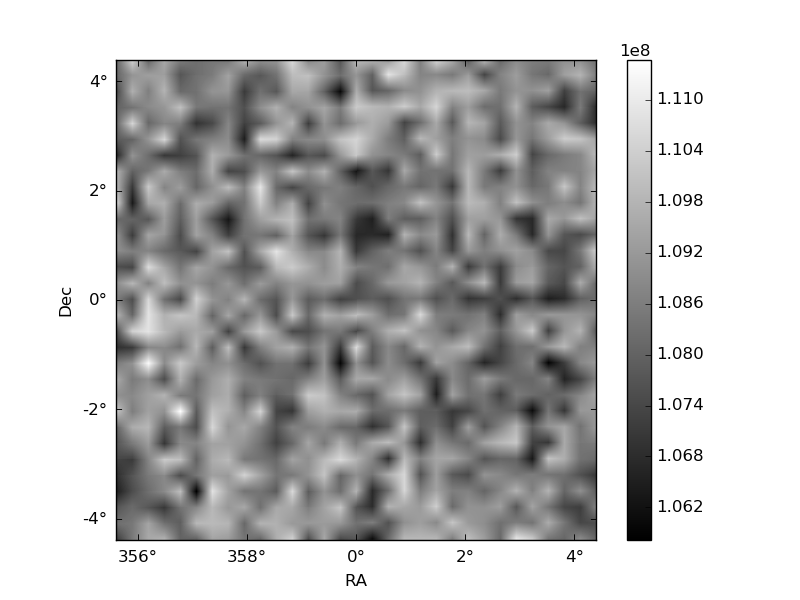
Histogram calculated using DETX and DETY for each event in the final _common_clean file
| Quadrant A | 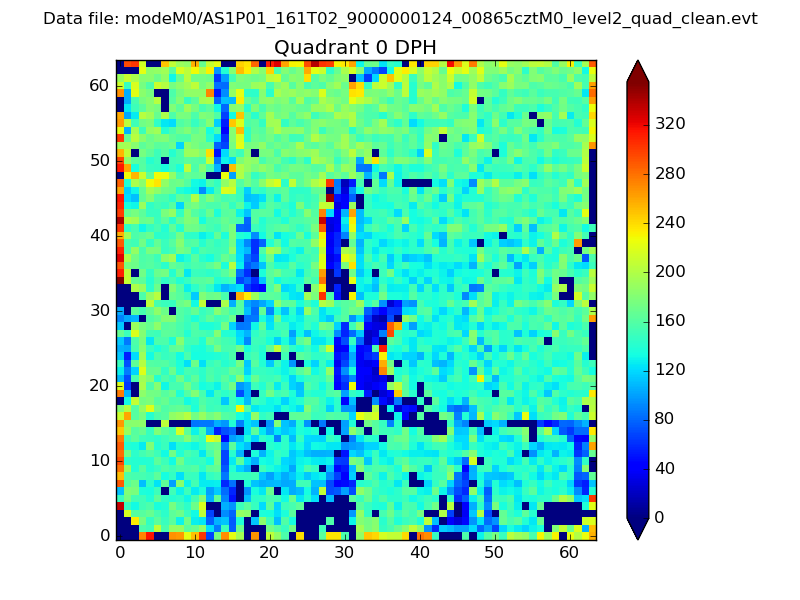 |
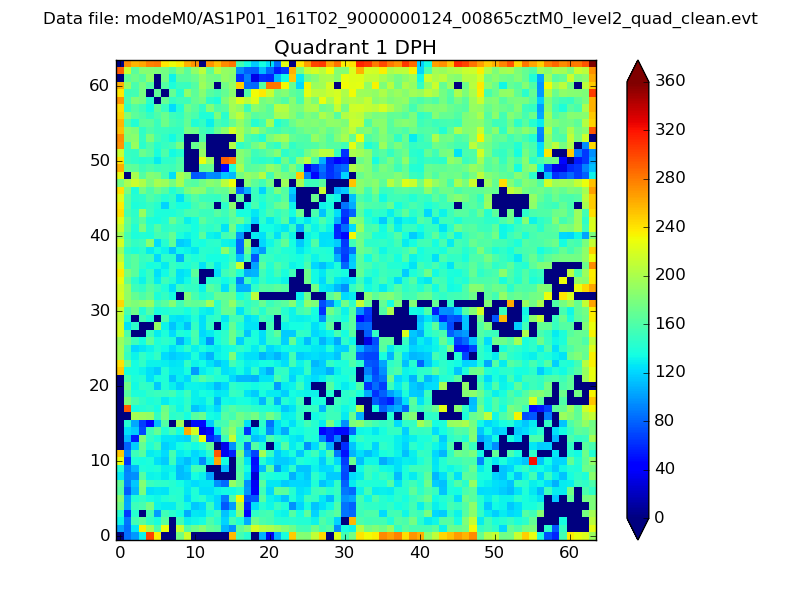 |
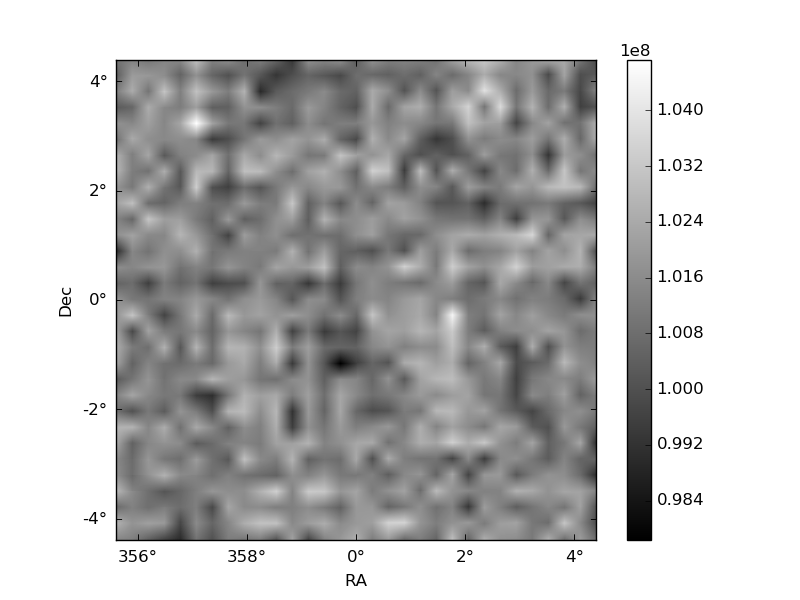
Quadrant B |
|---|---|---|---|
| Quadrant D | 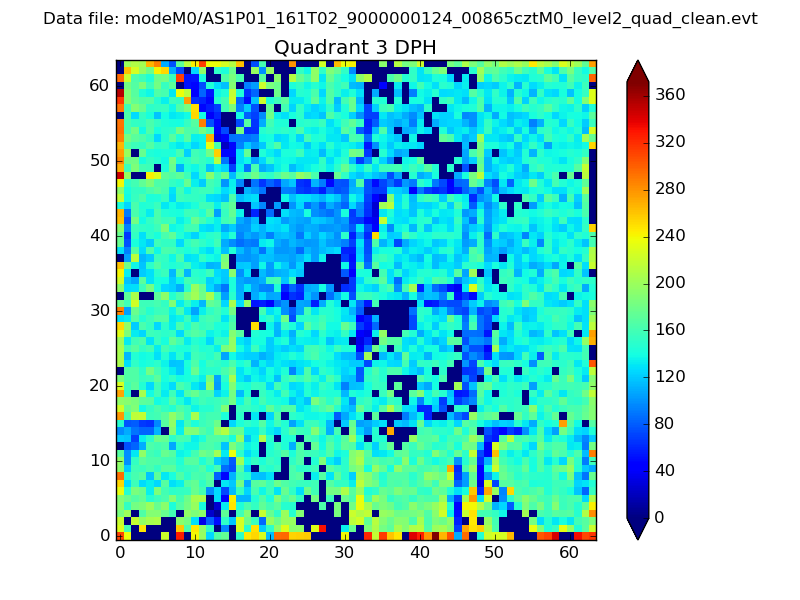 |
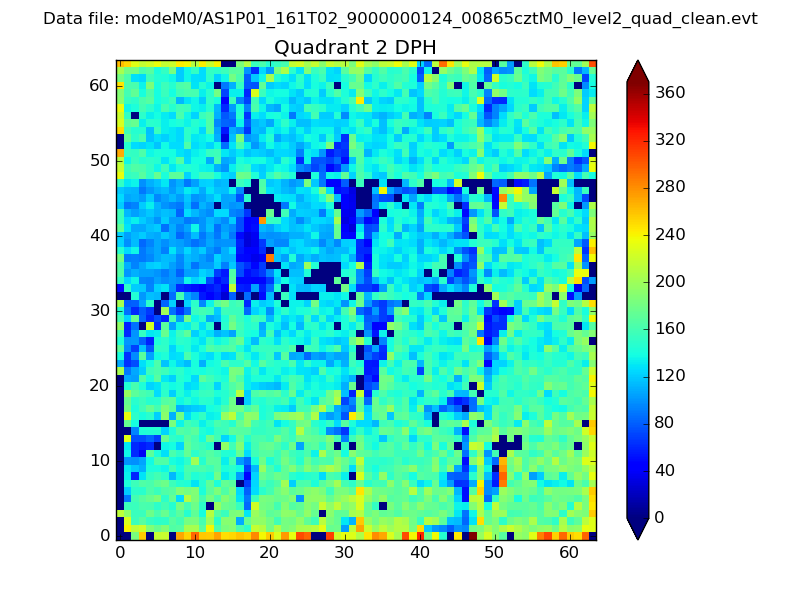 |
Quadrant C |
| Plot type | Count rate plots | Images |
|---|---|---|
| Comparison with Poisson distribution Blue bars denote a histogram of data divided into 1 sec bins. Red curve is a Poisson curve with rate = median count rate of data. |
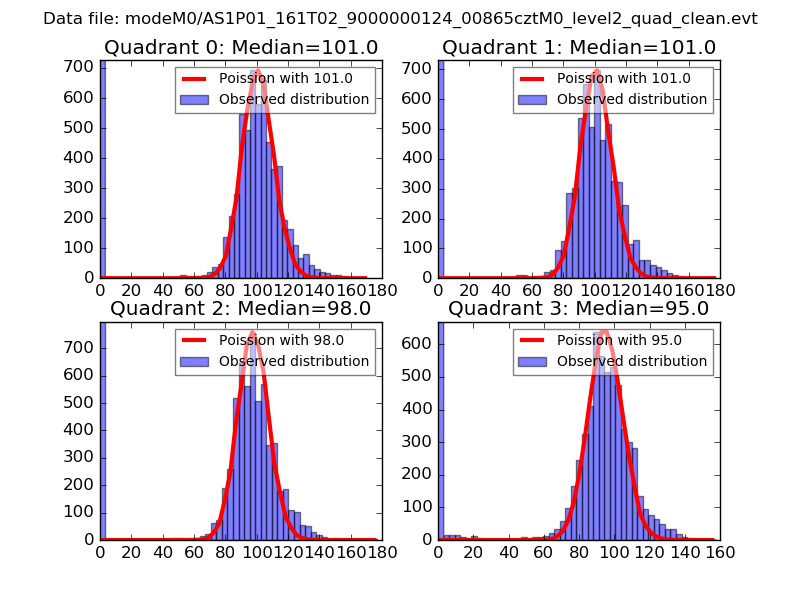 |
 |
| Quadrant-wise count rates Data is divided into 100 sec bins |
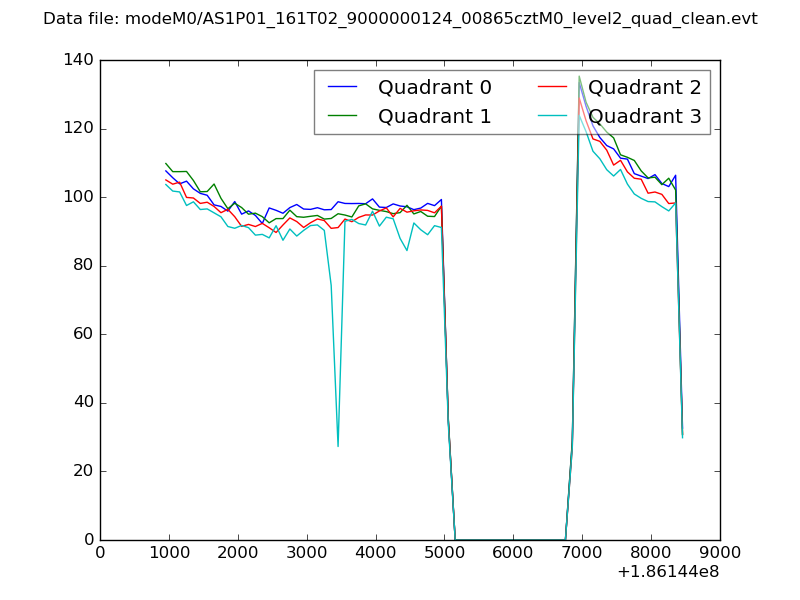 |
|
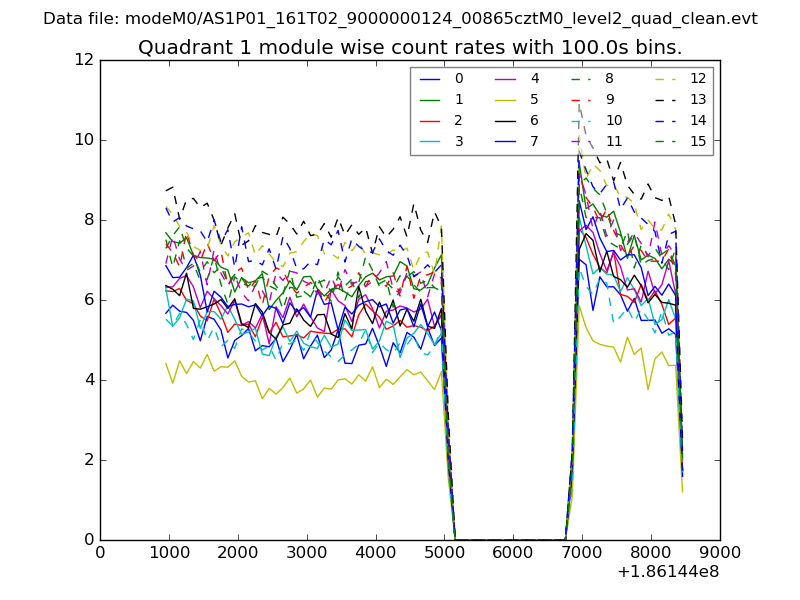
| Module-wise count rates for Quadrant A Data is divided into 100 sec bins |
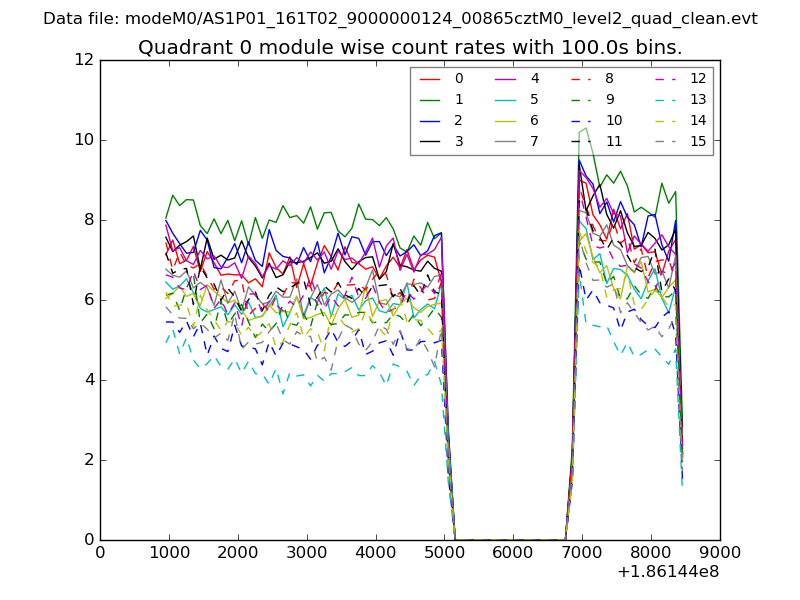 |
 |
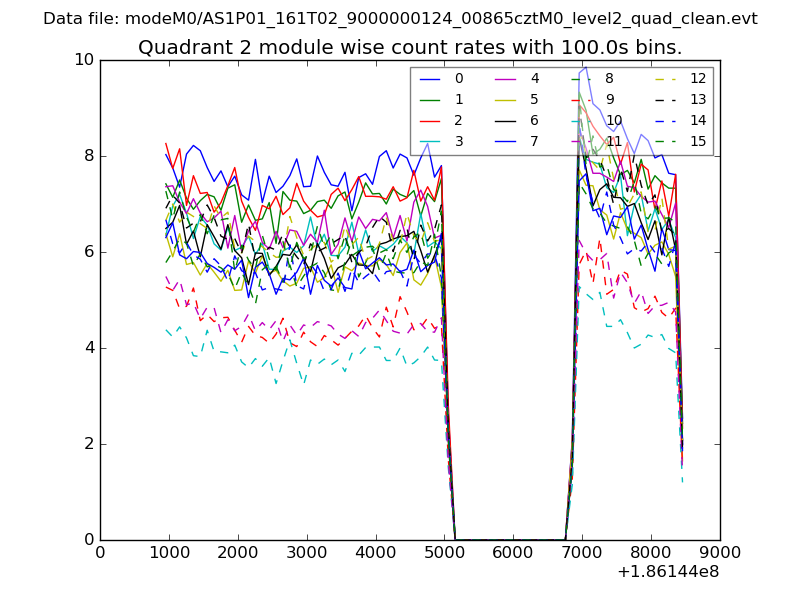
| Module-wise count rates for Quadrant B Data is divided into 100 sec bins |
 |
 |
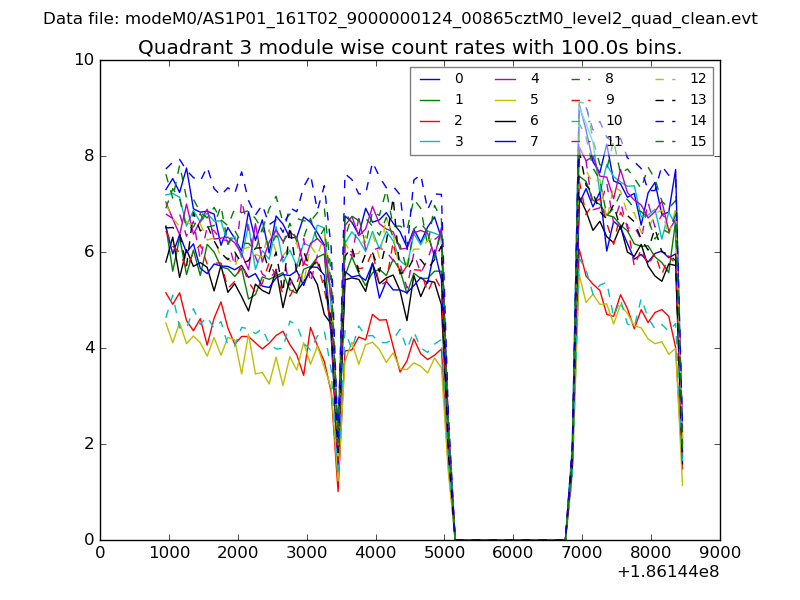
| Module-wise count rates for Quadrant C Data is divided into 100 sec bins |
 |
 |
| Module-wise count rates for Quadrant D Data is divided into 100 sec bins |
 |
 |
| Parameter | Plot |
|---|---|
| CZT HV Monitor |  |
| D_VDD | 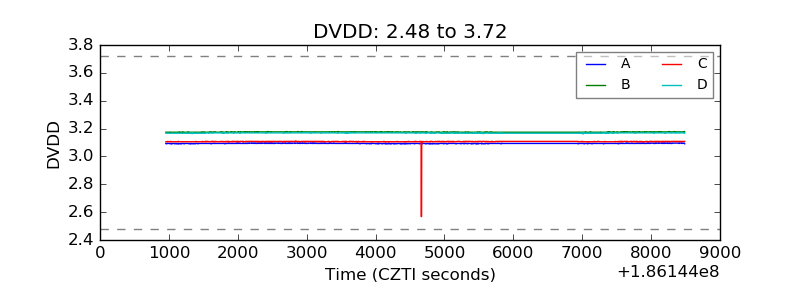 |
| Temperature 1 | 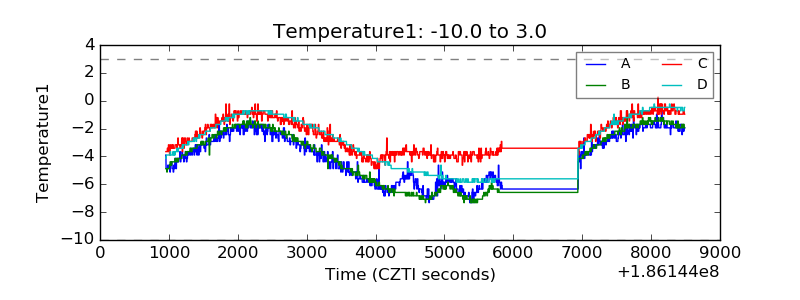 |
| Veto HV Monitor | 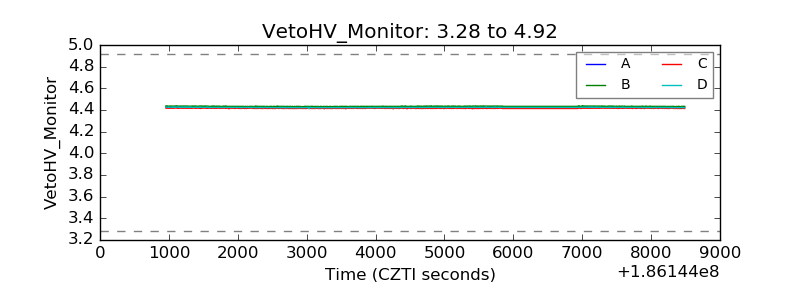 |
| Veto LLD | 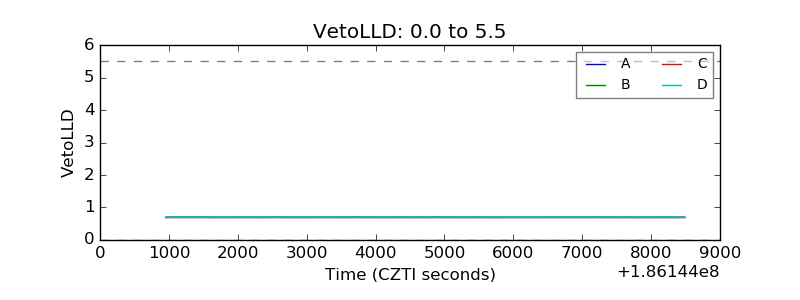 |
| Alpha Counter | 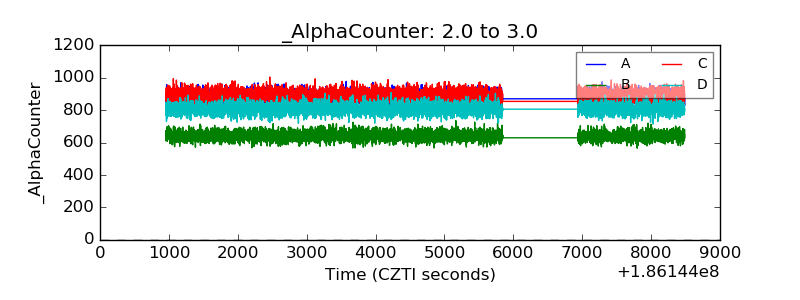 |
| _CPM_Rate | 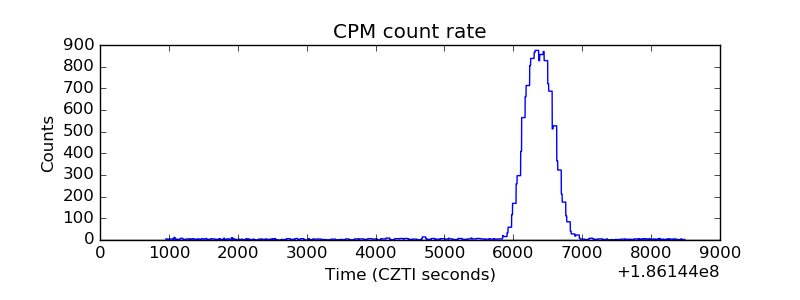 |
| CZT Counter | 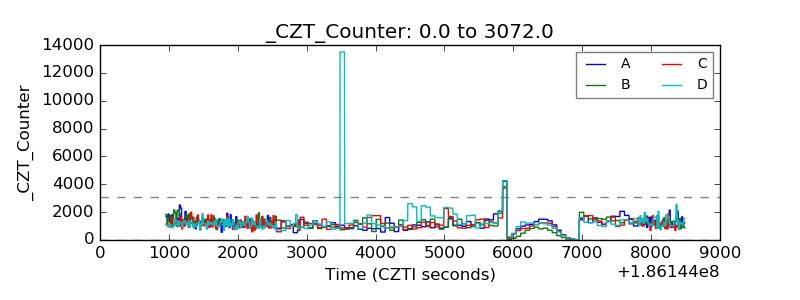 |
| +2.5 Volts monitor |  |
| +5 Volts monitor |  |
| _ROLL_ROT | 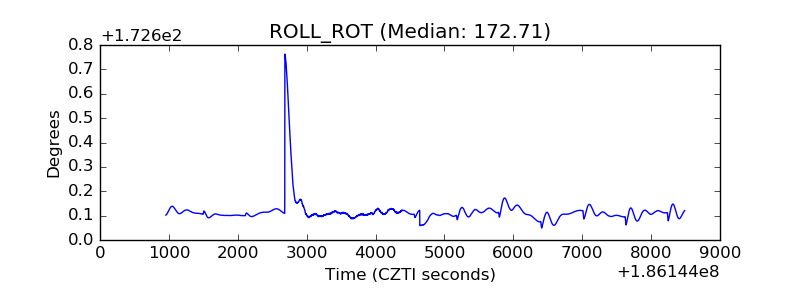 |
| _Roll_DEC | 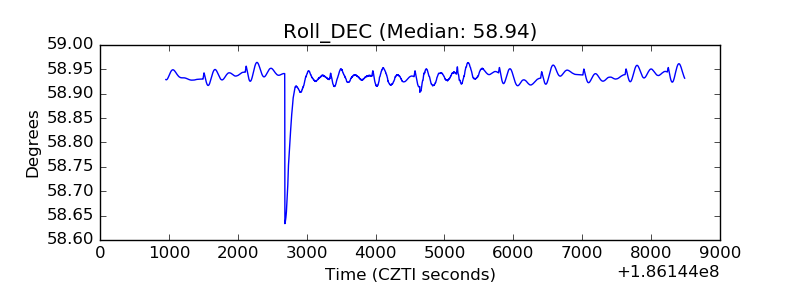 |
| _Roll_RA | 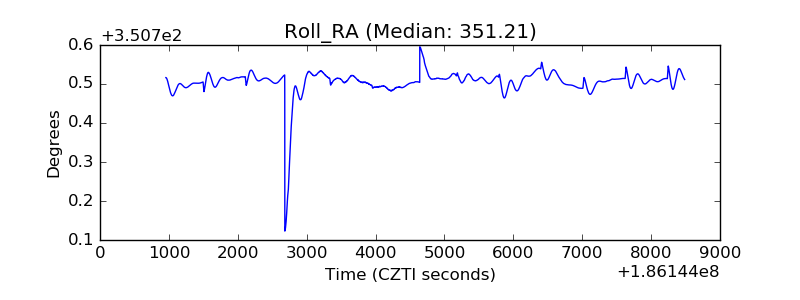 |
| Veto Counter | 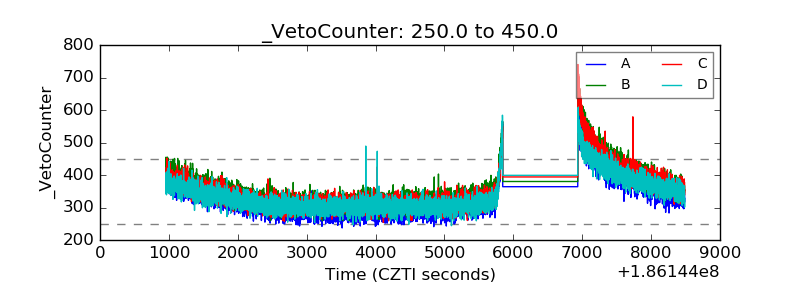 |