| Param | Original file | Final file |
|---|---|---|
| Filename | modeM0/AS1P01_161T02_9000000124_00867cztM0_level2.evt | modeM0/AS1P01_161T02_9000000124_00867cztM0_level2_quad_clean.evt |
| Size (bytes) | 972,817,920 | 84,087,360 |
| Size | 927.8 MB | 80.2 MB |
| Events in quadrant A | 7,292,456 | 538,270 |
| Events in quadrant B | 7,599,507 | 537,015 |
| Events in quadrant C | 7,234,027 | 525,969 |
| Events in quadrant D | 6,927,438 | 515,491 |
| Mode SS | |||
|---|---|---|---|
| Quadrant | BADHDUFLAG | Total packets | Discarded packets |
| A | 0 | 126 | 0 |
| B | 0 | 126 | 0 |
| C | 0 | 126 | 0 |
| D | 0 | 126 | 0 |
| Mode M0 | |||
|---|---|---|---|
| Quadrant | BADHDUFLAG | Total packets | Discarded packets |
| A | 0 | 26010 | 0 |
| B | 0 | 26911 | 0 |
| C | 0 | 25866 | 0 |
| D | 0 | 24941 | 0 |
| Mode M9 | |||
|---|---|---|---|
| Quadrant | BADHDUFLAG | Total packets | Discarded packets |
| A | 0 | 12 | 0 |
| B | 0 | 12 | 0 |
| C | 0 | 12 | 0 |
| D | 0 | 12 | 0 |
| Quadrant | Total seconds | Saturated seconds | Saturation percentage |
|---|---|---|---|
| A | 6151 | 18 | 0.292635% |
| B | 6151 | 14 | 0.227605% |
| C | 6152 | 19 | 0.308843% |
| D | 6152 | 30 | 0.487646% |
Noise dominated data is calculated using 1-second bins in cleaned event files. If a bin has >2000 counts, and if more than 50% of those come from <1% of pixels, then it is considered to be noise-dominated and hence unusable.
| Quadrant | # 1 sec bins | Bins with >0 counts | Bins with >2000 counts | High rate bins dominated by noise | Noise dominated (total time) | Noise dominated (detector-on time) | Marked lightcurve |
|---|---|---|---|---|---|---|---|
| A | 7421 | 6151 | 198 | 198 | 2.67% | 3.22% | 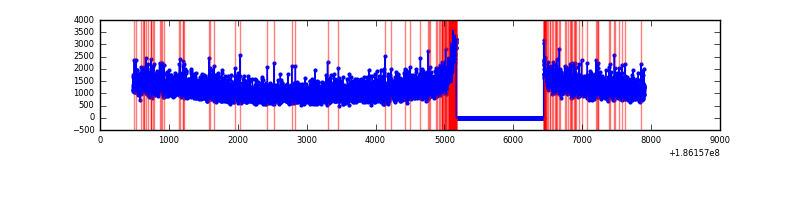 |
| B | 7421 | 6151 | 204 | 204 | 2.75% | 3.32% | 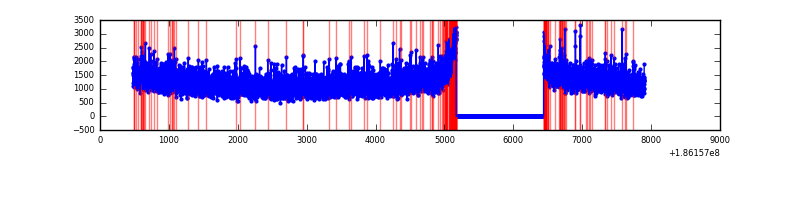 |
| C | 7422 | 6153 | 146 | 146 | 1.97% | 2.37% | 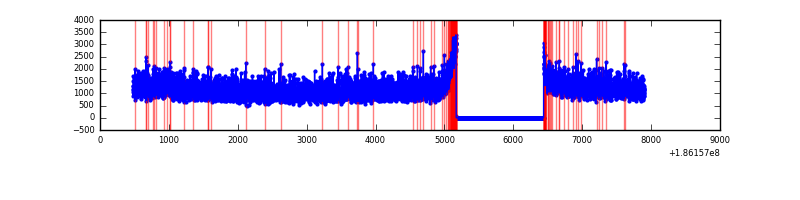 |
| D | 7422 | 6152 | 168 | 168 | 2.26% | 2.73% | 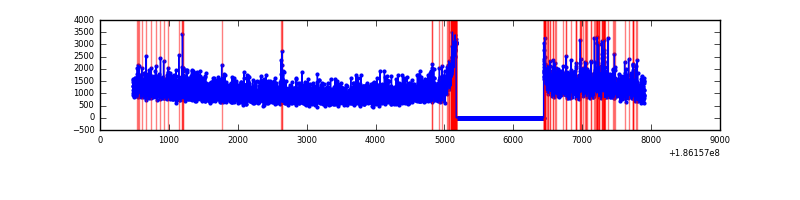 |
Top three noisy pixels from each quadrant. If the there are fewer than three noisy pixels in the level2.evt file, extra rows are filled as -1
| Pixel properties | Quadrant properties | ||||||
|---|---|---|---|---|---|---|---|
| Quadrant | DetID | PixID | Counts | Sigma | Mean | Median | Sigma |
| A | 12 | 189 | 8594 | 14.86 | 1895 | 1903 | 450.4 |
| A | 11 | 79 | 6879 | 11.05 | 1895 | 1903 | 450.4 |
| A | 0 | 214 | 5884 | 8.84 | 1895 | 1903 | 450.4 |
| B | 0 | 220 | 80199 | 171.55 | 1960 | 1969 | 456.0 |
| B | 15 | 255 | 25659 | 51.95 | 1960 | 1969 | 456.0 |
| B | 5 | 249 | 14120 | 26.65 | 1960 | 1969 | 456.0 |
| C | 8 | 208 | 33411 | 62.77 | 1824 | 1886 | 502.2 |
| C | 3 | 111 | 26667 | 49.34 | 1824 | 1886 | 502.2 |
| C | 3 | 79 | 21507 | 39.07 | 1824 | 1886 | 502.2 |
| D | 13 | 169 | 84352 | 152.03 | 1771 | 1830 | 542.8 |
| D | 12 | 188 | 73758 | 132.51 | 1771 | 1830 | 542.8 |
| D | 1 | 4 | 53334 | 94.88 | 1771 | 1830 | 542.8 |
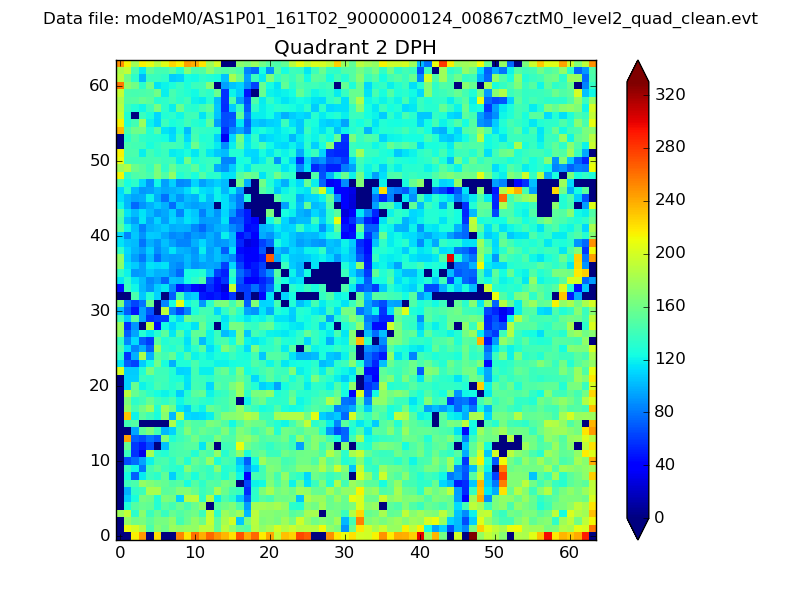
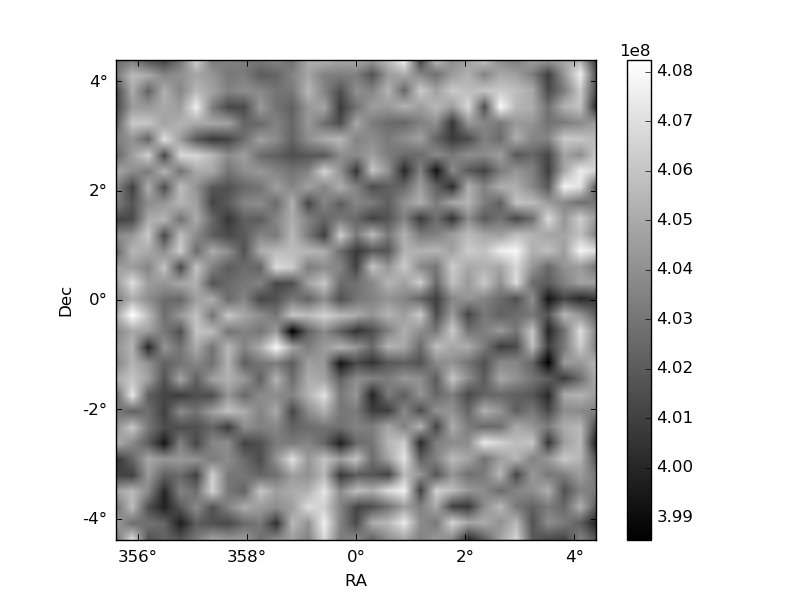
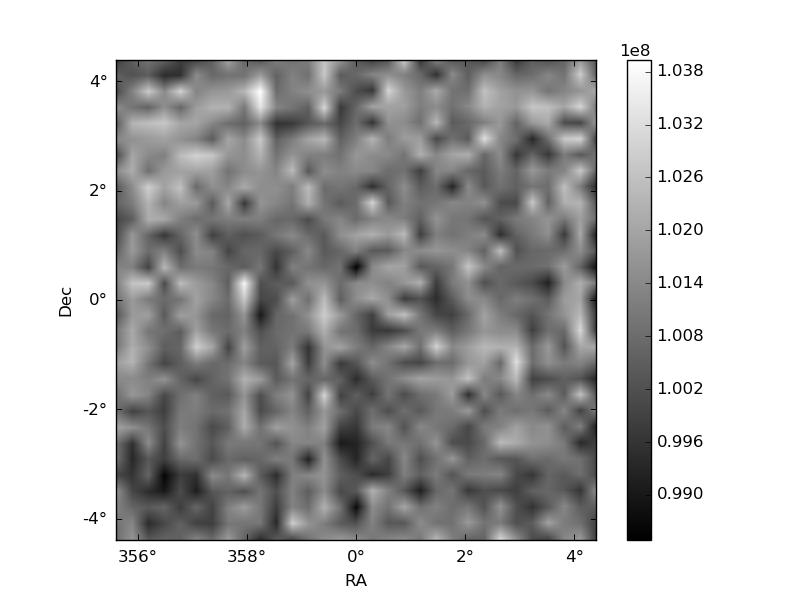
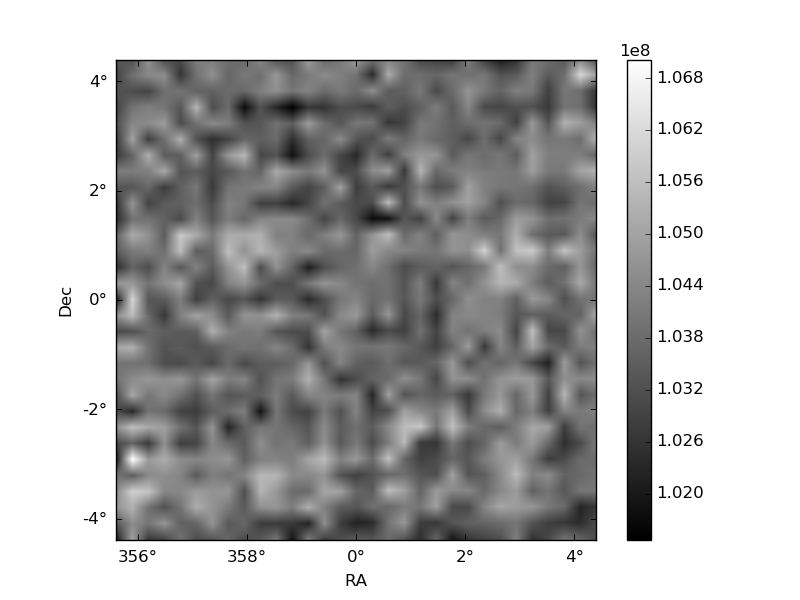
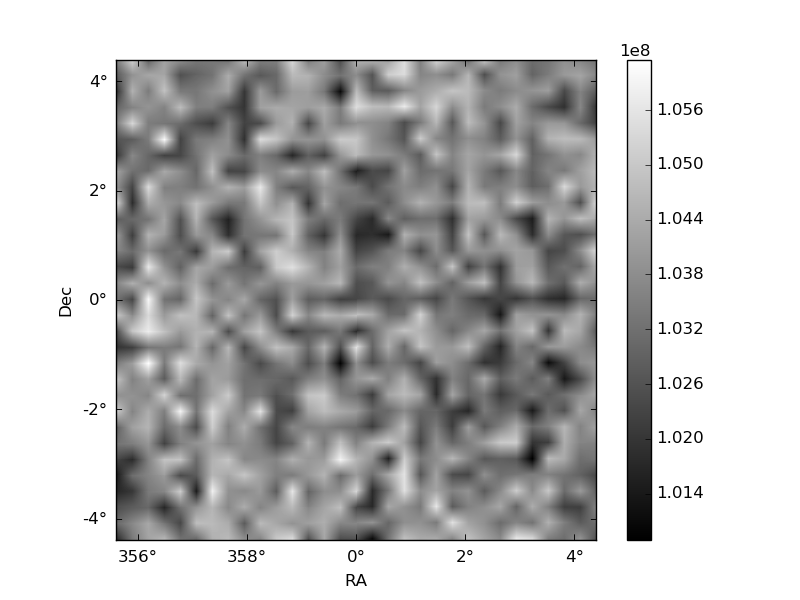
Histogram calculated using DETX and DETY for each event in the final _common_clean file
| Quadrant A | 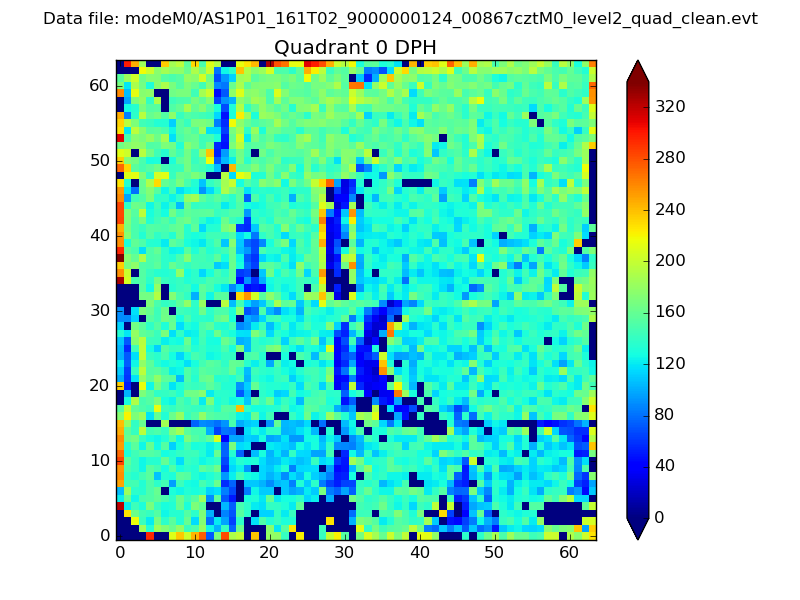 |
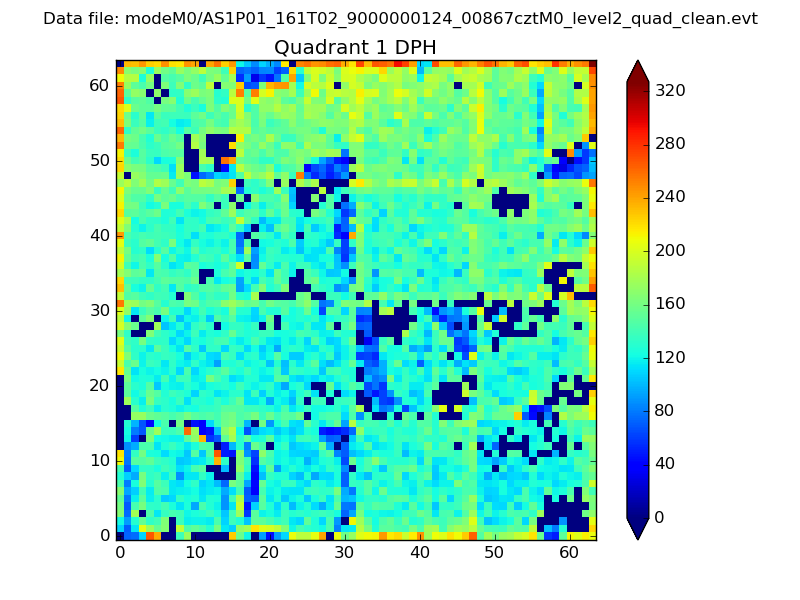 |
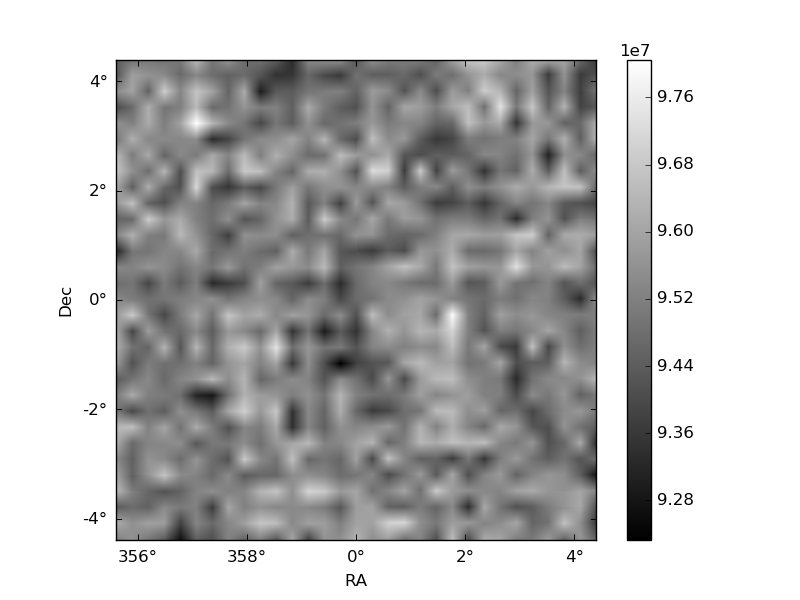
Quadrant B |
|---|---|---|---|
| Quadrant D | 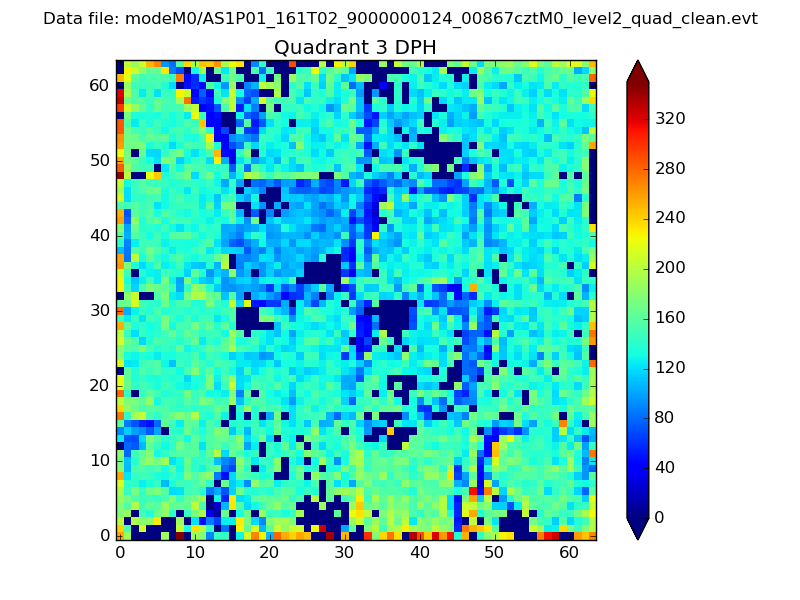 |
 |
Quadrant C |
| Plot type | Count rate plots | Images |
|---|---|---|
| Comparison with Poisson distribution Blue bars denote a histogram of data divided into 1 sec bins. Red curve is a Poisson curve with rate = median count rate of data. |
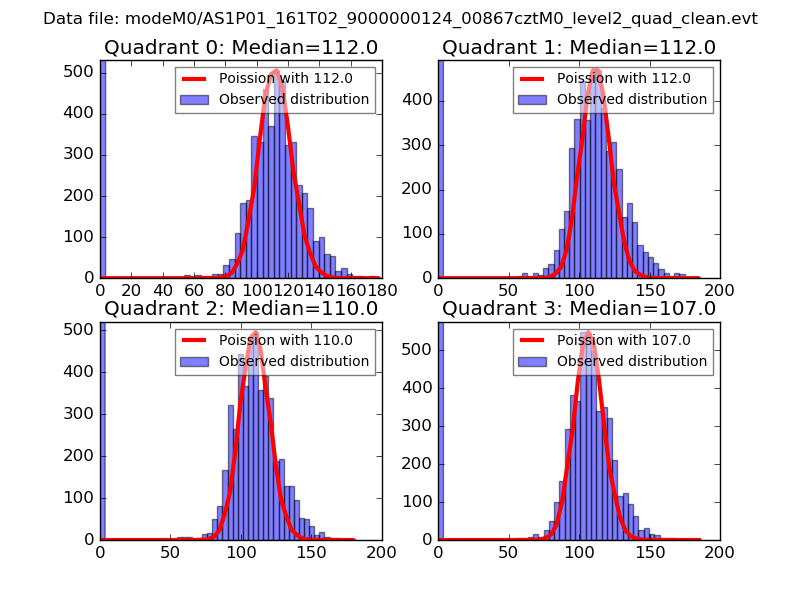 |
 |
| Quadrant-wise count rates Data is divided into 100 sec bins |
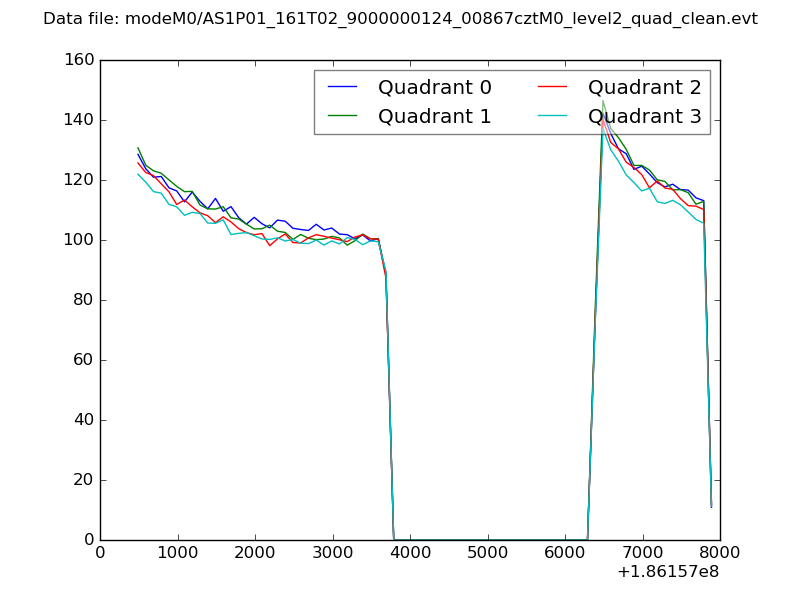 |
|
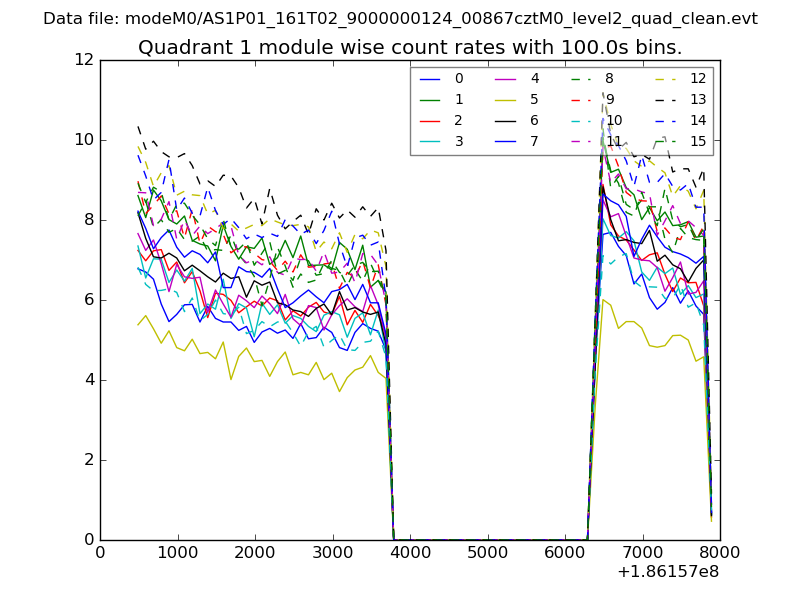
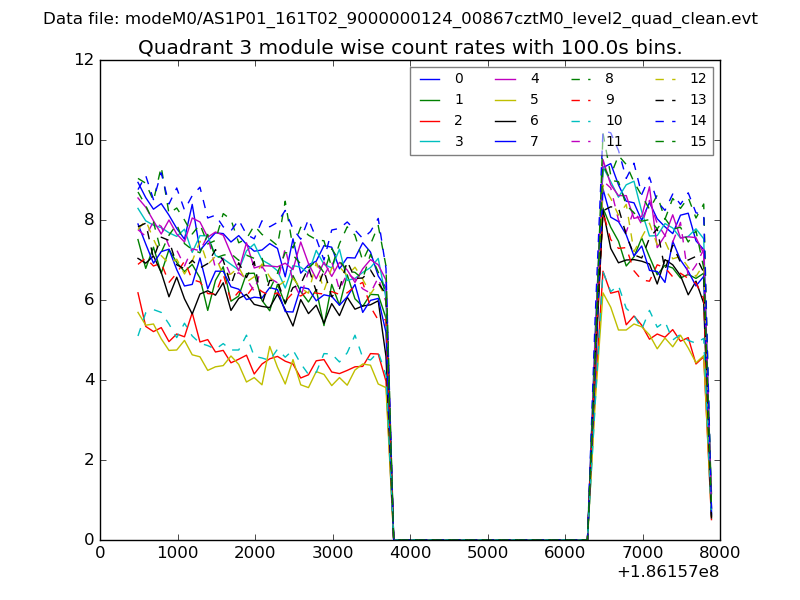
| Module-wise count rates for Quadrant A Data is divided into 100 sec bins |
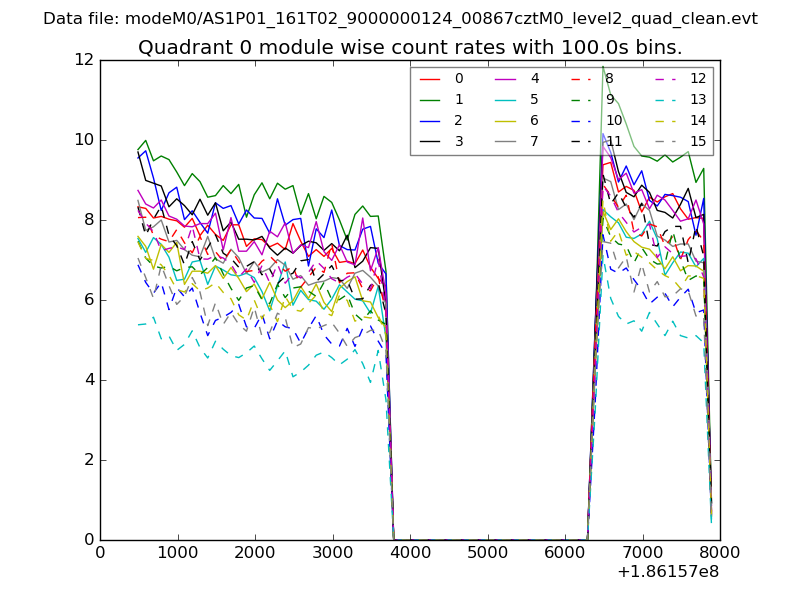 |
 |
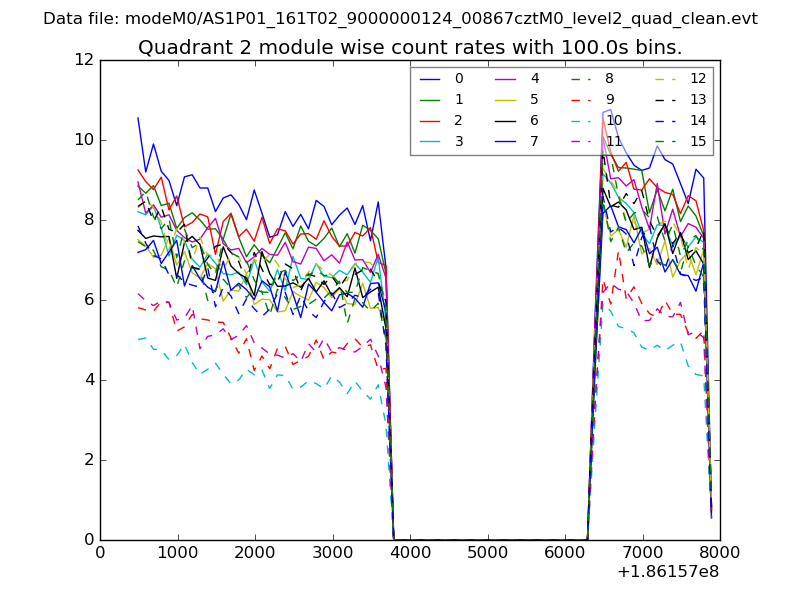
| Module-wise count rates for Quadrant B Data is divided into 100 sec bins |
 |
 |
| Module-wise count rates for Quadrant C Data is divided into 100 sec bins |
 |
 |
| Module-wise count rates for Quadrant D Data is divided into 100 sec bins |
 |
 |
| Parameter | Plot |
|---|---|
| CZT HV Monitor | 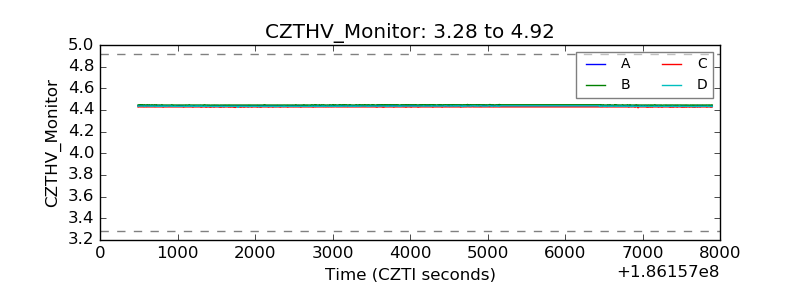 |
| D_VDD | 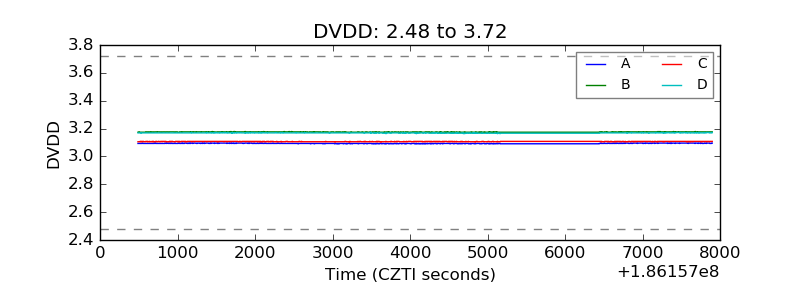 |
| Temperature 1 |  |
| Veto HV Monitor | 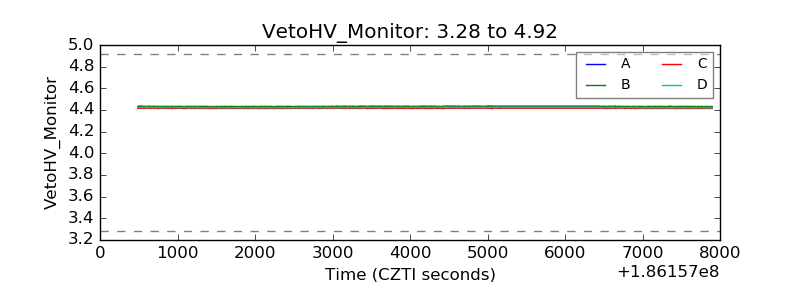 |
| Veto LLD |  |
| Alpha Counter | 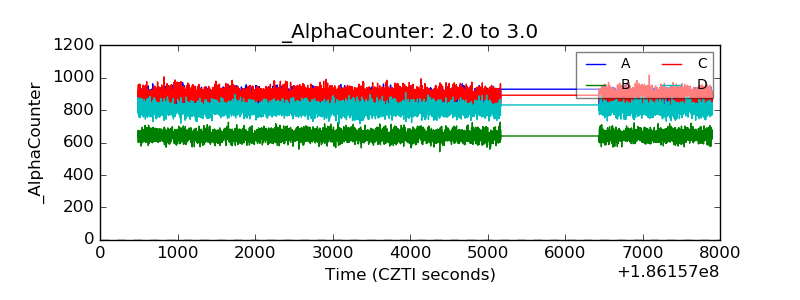 |
| _CPM_Rate | 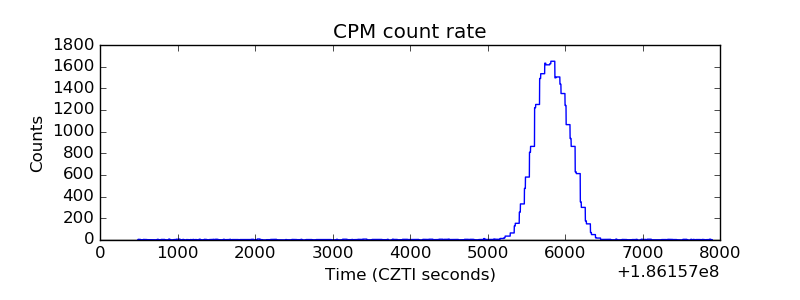 |
| CZT Counter | 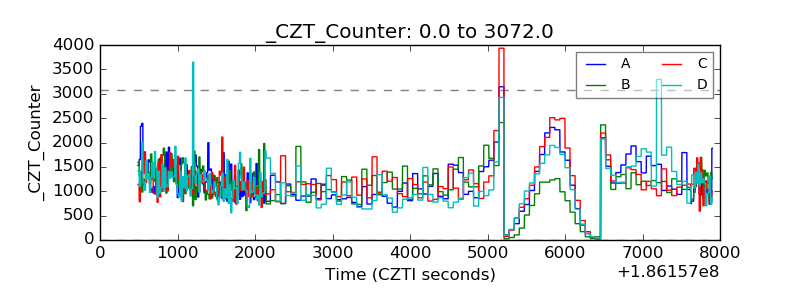 |
| +2.5 Volts monitor |  |
| +5 Volts monitor | 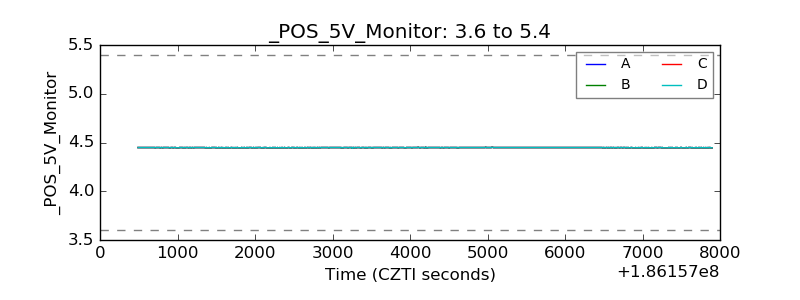 |
| _ROLL_ROT | 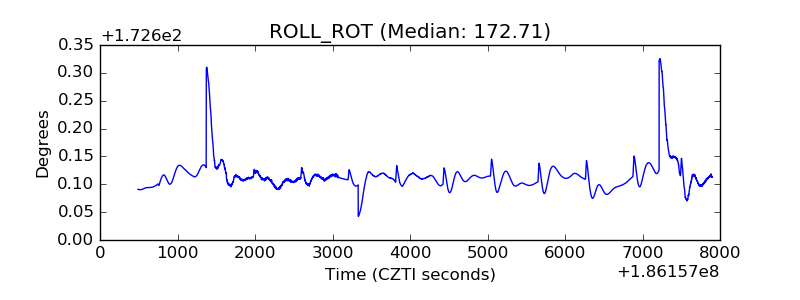 |
| _Roll_DEC | 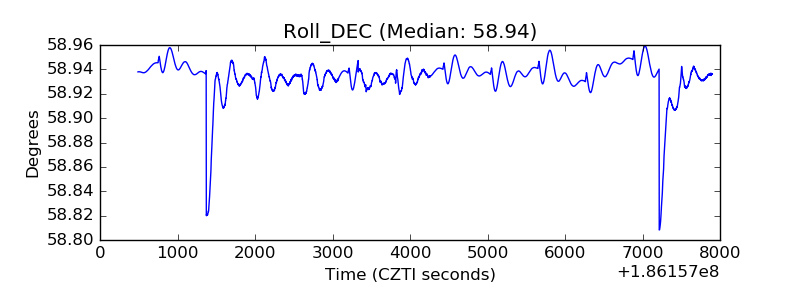 |
| _Roll_RA | 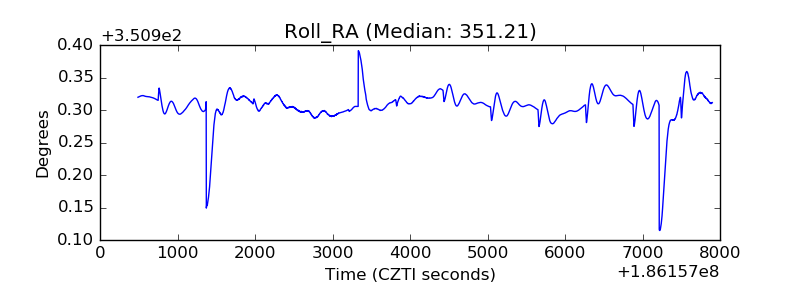 |
| Veto Counter | 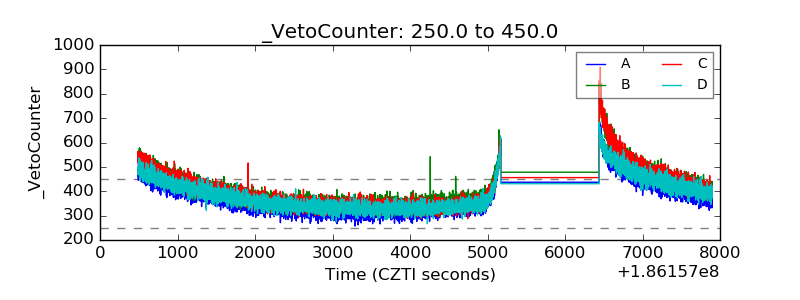 |