| Param | Original file | Final file |
|---|---|---|
| Filename | modeM0/AS1P01_161T02_9000000124_00869cztM0_level2.evt | modeM0/AS1P01_161T02_9000000124_00869cztM0_level2_quad_clean.evt |
| Size (bytes) | 261,590,400 | 25,704,000 |
| Size | 249.5 MB | 24.5 MB |
| Events in quadrant A | 1,805,101 | 172,595 |
| Events in quadrant B | 1,946,944 | 175,684 |
| Events in quadrant C | 1,823,746 | 171,960 |
| Events in quadrant D | 2,247,460 | 149,589 |
| Mode SS | |||
|---|---|---|---|
| Quadrant | BADHDUFLAG | Total packets | Discarded packets |
| A | 0 | 28 | 0 |
| B | 0 | 28 | 0 |
| C | 0 | 28 | 0 |
| D | 0 | 28 | 0 |
| Mode M0 | |||
|---|---|---|---|
| Quadrant | BADHDUFLAG | Total packets | Discarded packets |
| A | 0 | 6394 | 0 |
| B | 0 | 6836 | 0 |
| C | 0 | 6451 | 0 |
| D | 0 | 7738 | 0 |
| Mode M9 | |||
|---|---|---|---|
| Quadrant | BADHDUFLAG | Total packets | Discarded packets |
| A | 0 | 2 | 0 |
| B | 0 | 2 | 0 |
| C | 0 | 2 | 0 |
| D | 0 | 2 | 0 |
| Quadrant | Total seconds | Saturated seconds | Saturation percentage |
|---|---|---|---|
| A | 1456 | 1 | 0.068681% |
| B | 1456 | 2 | 0.137363% |
| C | 1456 | 1 | 0.068681% |
| D | 1456 | 223 | 15.315934% |
Noise dominated data is calculated using 1-second bins in cleaned event files. If a bin has >2000 counts, and if more than 50% of those come from <1% of pixels, then it is considered to be noise-dominated and hence unusable.
| Quadrant | # 1 sec bins | Bins with >0 counts | Bins with >2000 counts | High rate bins dominated by noise | Noise dominated (total time) | Noise dominated (detector-on time) | Marked lightcurve |
|---|---|---|---|---|---|---|---|
| A | 1456 | 1456 | 51 | 51 | 3.50% | 3.50% | 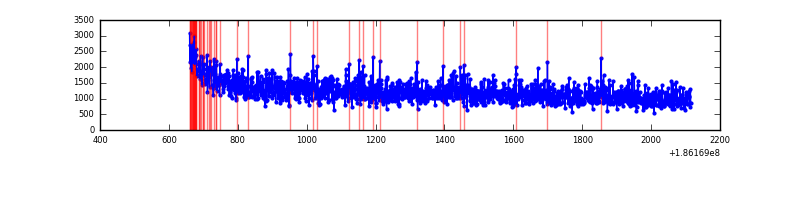 |
| B | 1456 | 1456 | 73 | 73 | 5.01% | 5.01% | 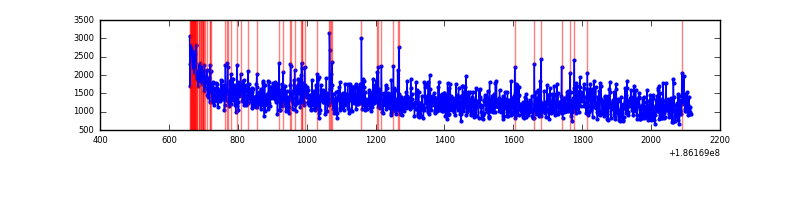 |
| C | 1456 | 1456 | 49 | 49 | 3.37% | 3.37% | 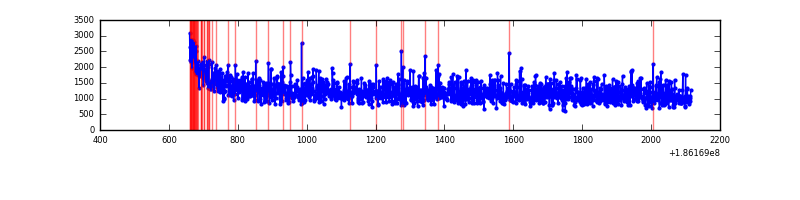 |
| D | 1456 | 1456 | 299 | 299 | 20.54% | 20.54% | 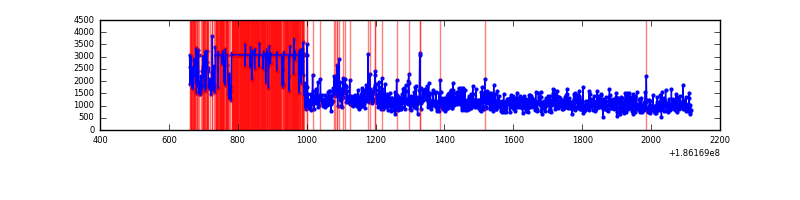 |
Top three noisy pixels from each quadrant. If the there are fewer than three noisy pixels in the level2.evt file, extra rows are filled as -1
| Pixel properties | Quadrant properties | ||||||
|---|---|---|---|---|---|---|---|
| Quadrant | DetID | PixID | Counts | Sigma | Mean | Median | Sigma |
| A | 15 | 233 | 13185 | 113.41 | 467 | 470 | 112.1 |
| A | 0 | 5 | 1937 | 13.08 | 467 | 470 | 112.1 |
| A | 3 | 111 | 1294 | 7.35 | 467 | 470 | 112.1 |
| B | 8 | 38 | 42862 | 379.46 | 482 | 484 | 111.7 |
| B | 0 | 220 | 31907 | 281.37 | 482 | 484 | 111.7 |
| B | 7 | 221 | 21368 | 187.0 | 482 | 484 | 111.7 |
| C | 3 | 111 | 6402 | 45.94 | 462 | 480 | 128.9 |
| C | 3 | 79 | 5563 | 39.43 | 462 | 480 | 128.9 |
| C | 15 | 241 | 3445 | 23.0 | 462 | 480 | 128.9 |
| D | 10 | 102 | 617574 | 4866.25 | 416 | 431 | 126.8 |
| D | 12 | 188 | 29929 | 232.6 | 416 | 431 | 126.8 |
| D | 13 | 169 | 9258 | 69.6 | 416 | 431 | 126.8 |
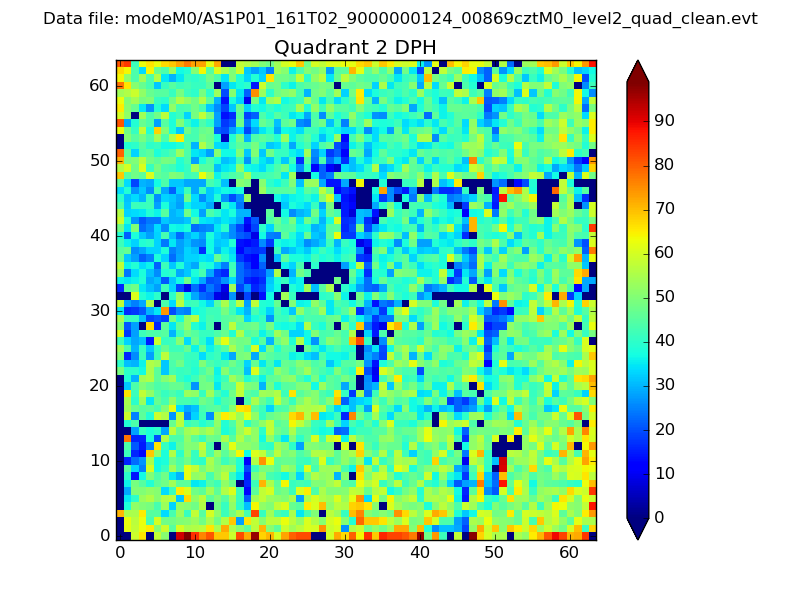
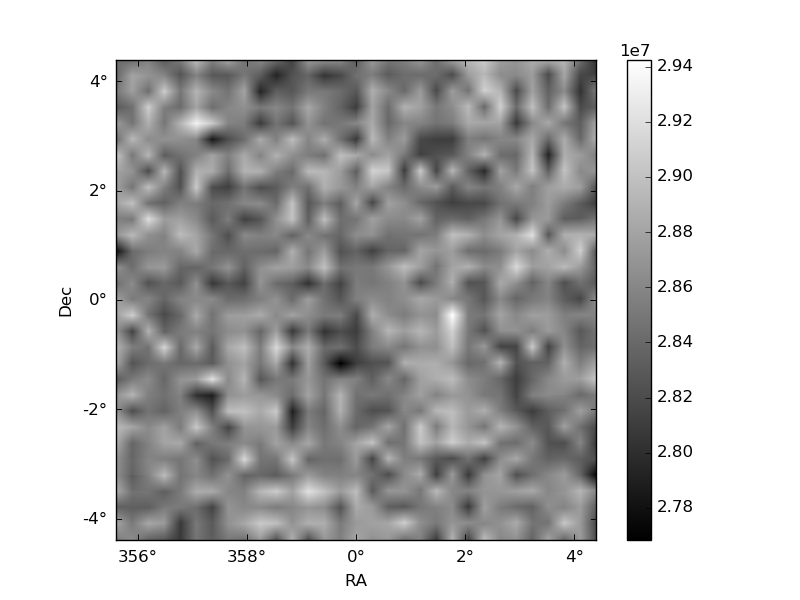
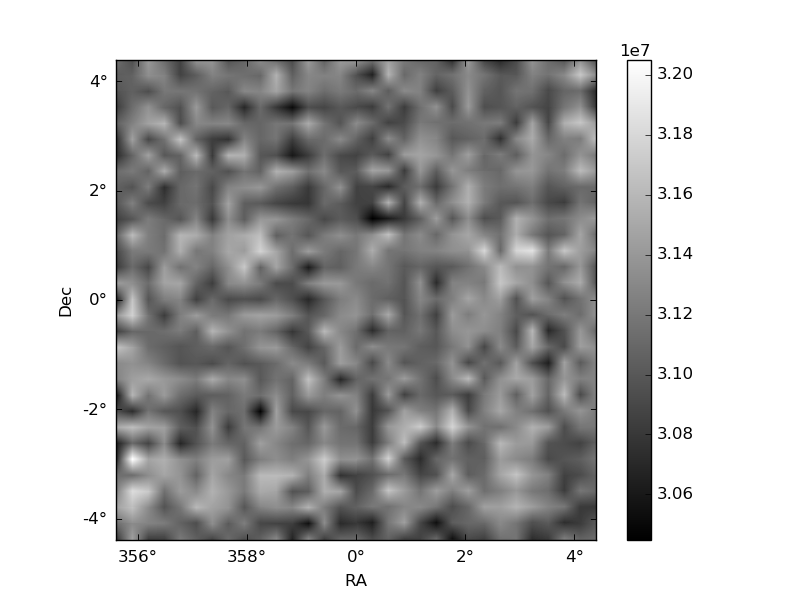
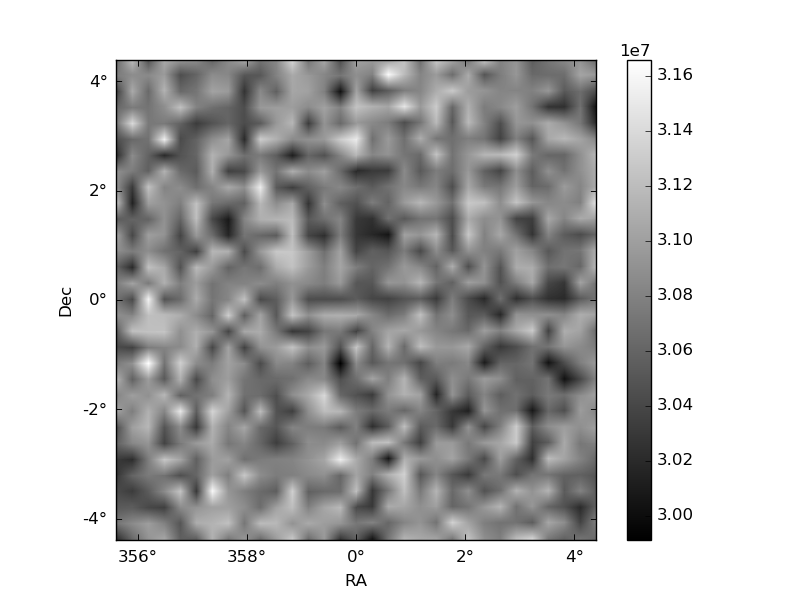
Histogram calculated using DETX and DETY for each event in the final _common_clean file
| Quadrant A | 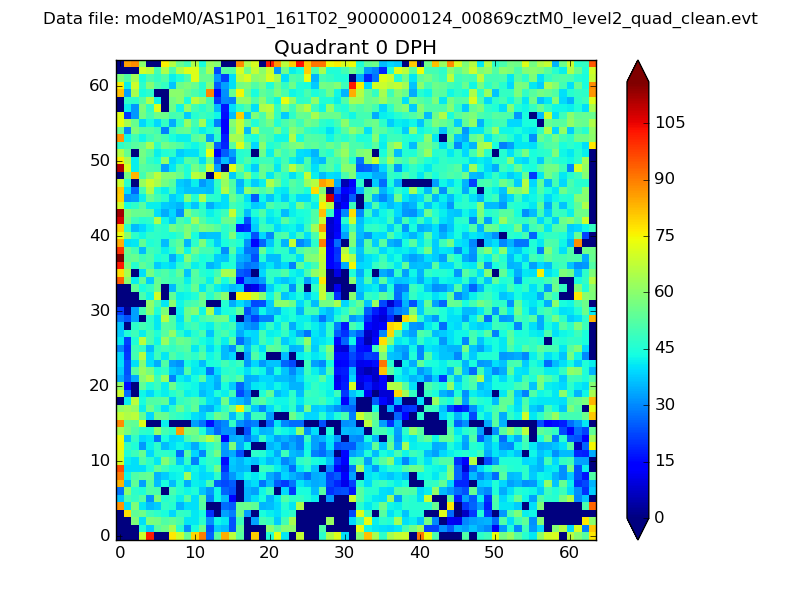 |
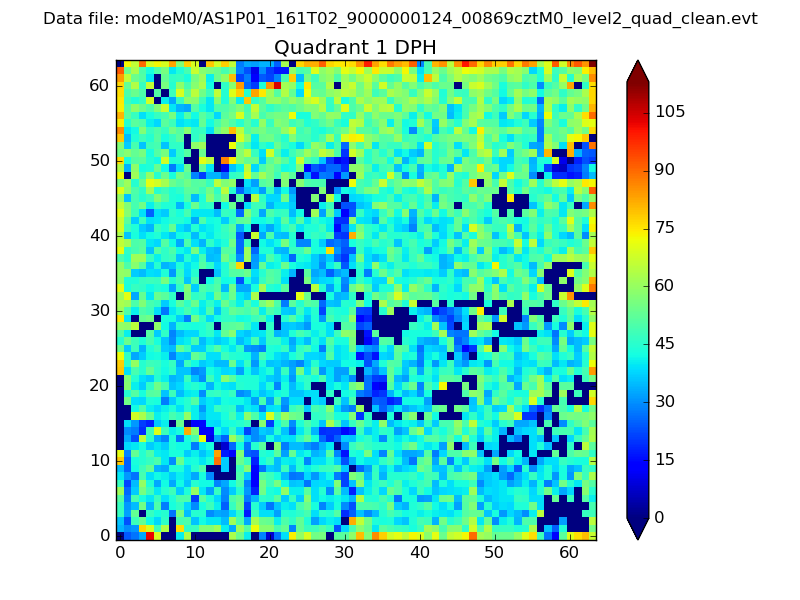 |
Quadrant B |
|---|---|---|---|
| Quadrant D | 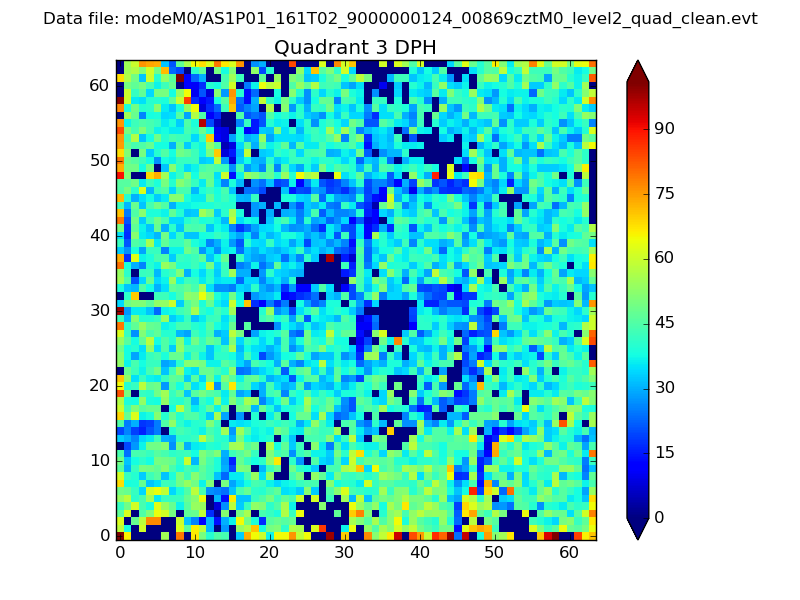 |
 |
Quadrant C |
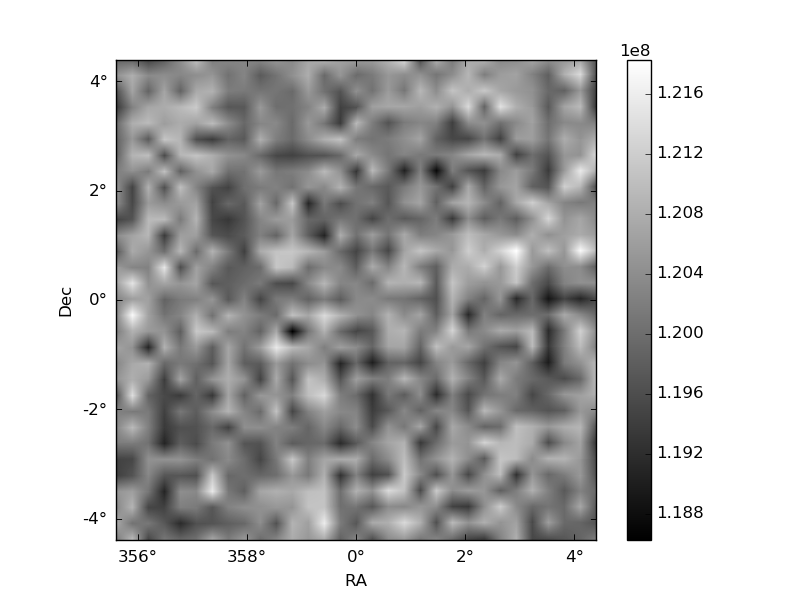
| Plot type | Count rate plots | Images |
|---|---|---|
| Comparison with Poisson distribution Blue bars denote a histogram of data divided into 1 sec bins. Red curve is a Poisson curve with rate = median count rate of data. |
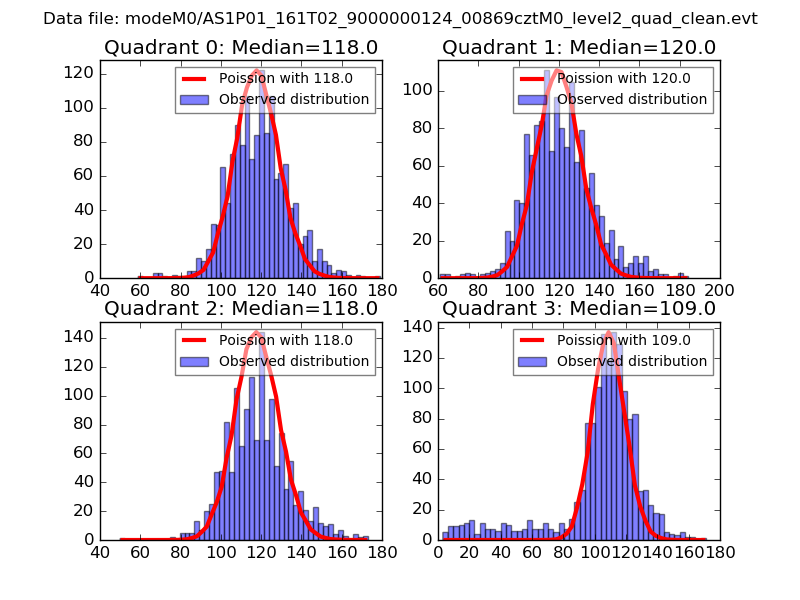 |
 |
| Quadrant-wise count rates Data is divided into 100 sec bins |
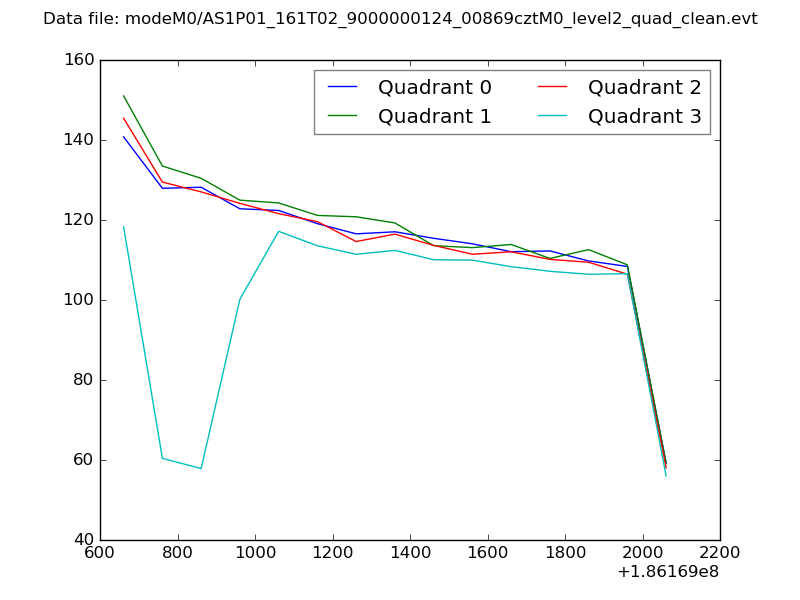 |
|
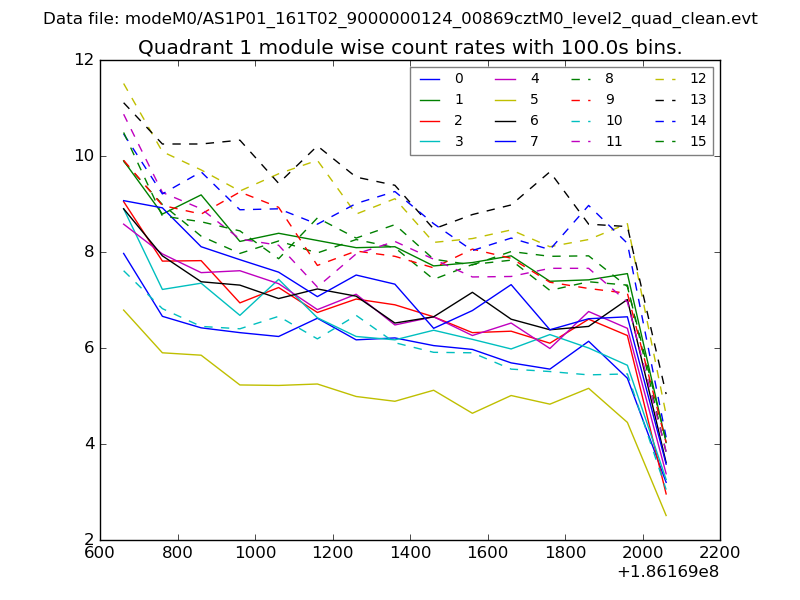
| Module-wise count rates for Quadrant A Data is divided into 100 sec bins |
 |
 |
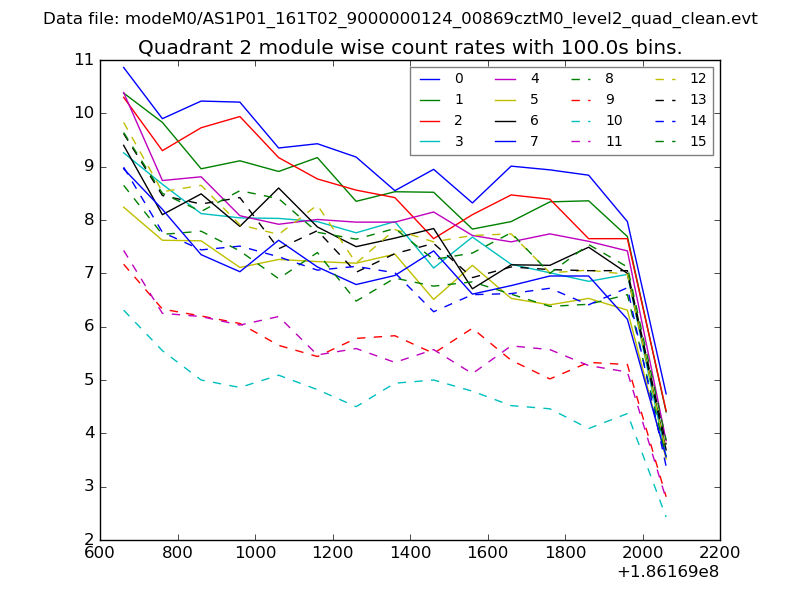
| Module-wise count rates for Quadrant B Data is divided into 100 sec bins |
 |
 |
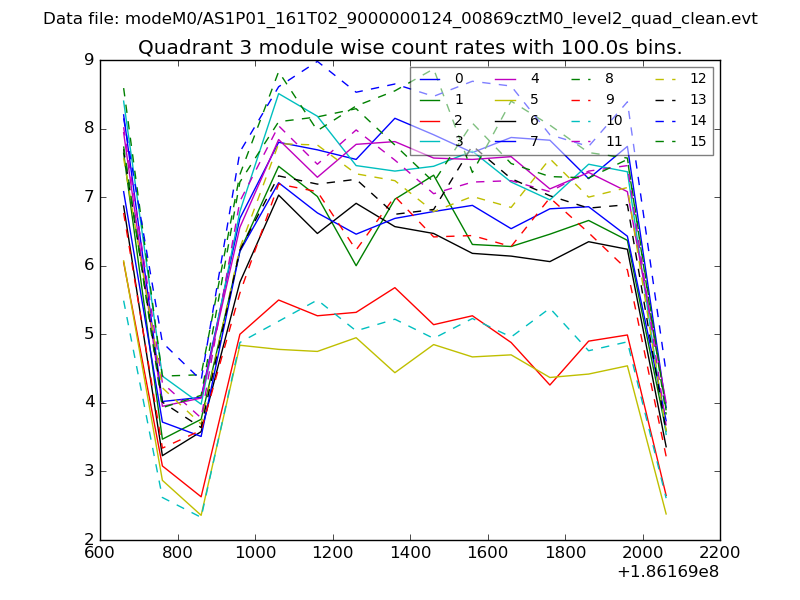
| Module-wise count rates for Quadrant C Data is divided into 100 sec bins |
 |
 |
| Module-wise count rates for Quadrant D Data is divided into 100 sec bins |
 |
 |
| Parameter | Plot |
|---|---|
| CZT HV Monitor | 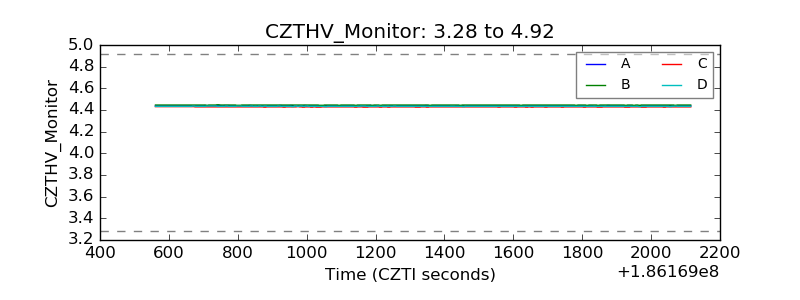 |
| D_VDD | 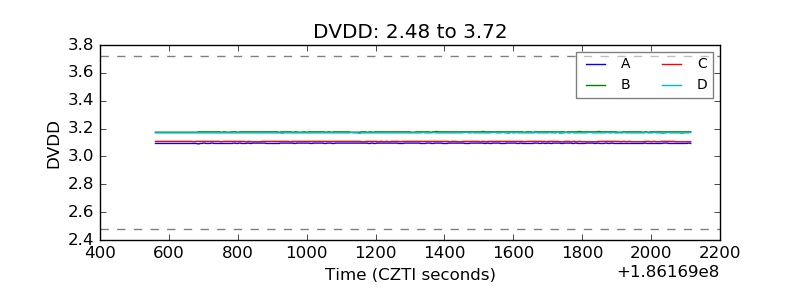 |
| Temperature 1 | 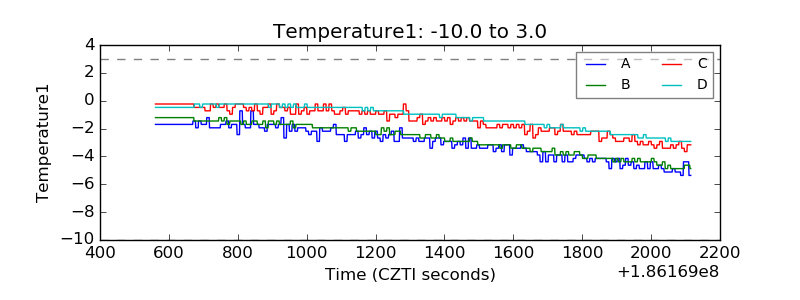 |
| Veto HV Monitor | 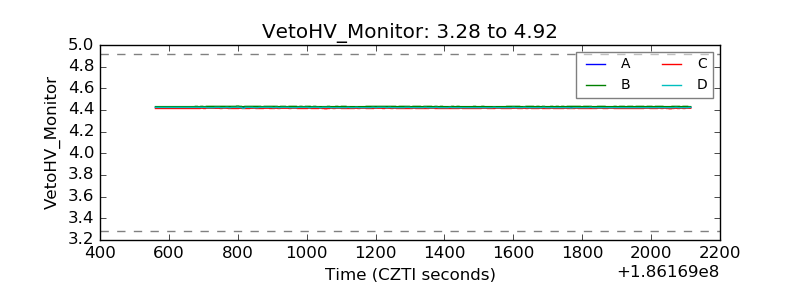 |
| Veto LLD | 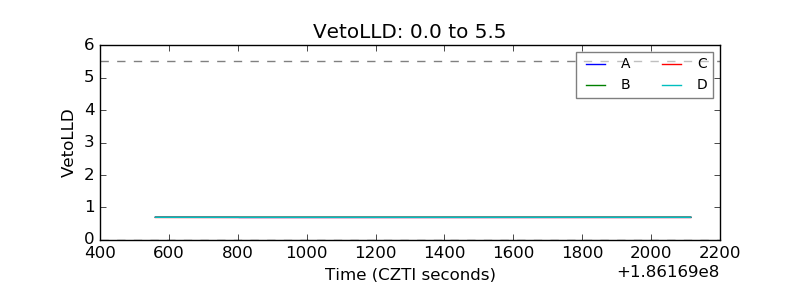 |
| Alpha Counter |  |
| _CPM_Rate | 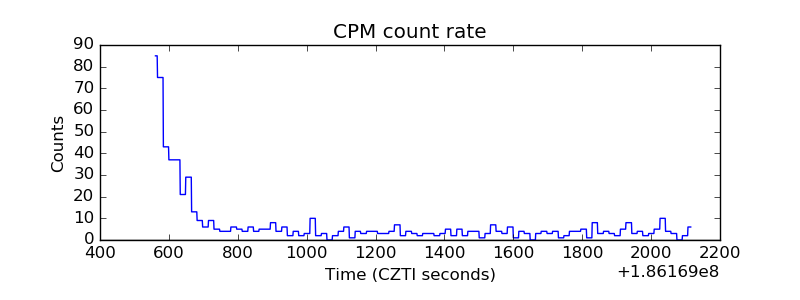 |
| CZT Counter | 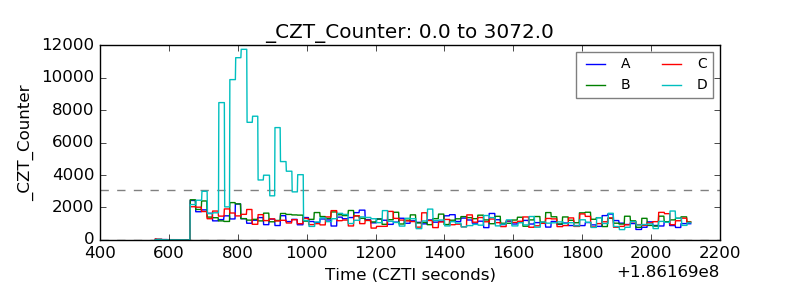 |
| +2.5 Volts monitor |  |
| +5 Volts monitor |  |
| _ROLL_ROT | 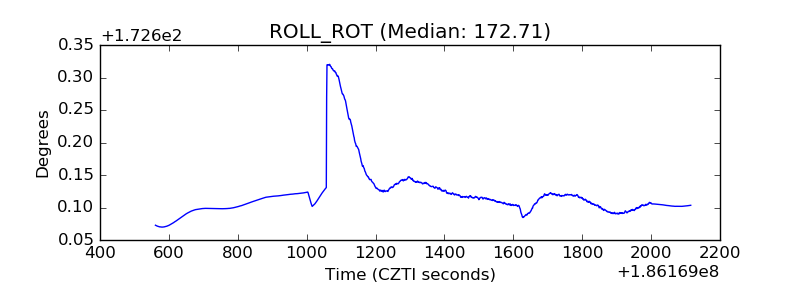 |
| _Roll_DEC | 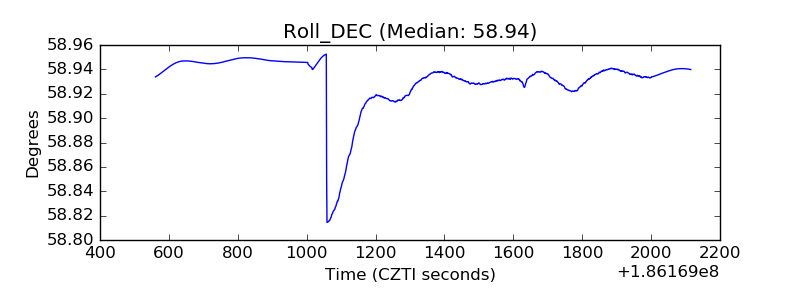 |
| _Roll_RA | 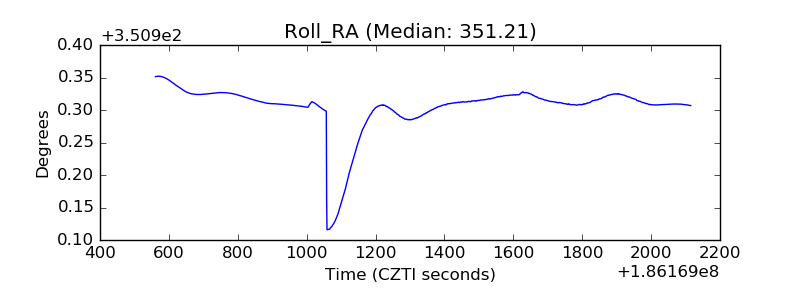 |
| Veto Counter |  |