| Param | Original file | Final file |
|---|---|---|
| Filename | modeM0/AS1P01_171T01_9000000126cztM0_level2.fits | modeM0/AS1P01_171T01_9000000126cztM0_level2_quad_clean.evt |
| Size (bytes) | 260,187,840 | 293,034,240 |
| Size | 248.1 MB | 279.5 MB |
| Events in quadrant A | 1,503,932 | 1,761,133 |
| Events in quadrant B | 1,486,850 | 1,766,341 |
| Events in quadrant C | 1,485,642 | 1,684,694 |
| Events in quadrant D | 1,275,122 | 1,534,253 |
| Mode SS | |||
|---|---|---|---|
| Quadrant | BADHDUFLAG | Total packets | Discarded packets |
| A | 0 | 626 | 0 |
| B | 0 | 626 | 0 |
| C | 0 | 626 | 0 |
| D | 0 | 626 | 0 |
| Mode M0 | |||
|---|---|---|---|
| Quadrant | BADHDUFLAG | Total packets | Discarded packets |
| A | 0 | 132355 | 0 |
| B | 0 | 141827 | 0 |
| C | 0 | 132400 | 0 |
| D | 0 | 129586 | 0 |
| Mode M9 | |||
|---|---|---|---|
| Quadrant | BADHDUFLAG | Total packets | Discarded packets |
| A | 0 | 30 | 0 |
| B | 0 | 30 | 0 |
| C | 0 | 30 | 0 |
| D | 0 | 30 | 0 |
| Quadrant | Total seconds | Saturated seconds | Saturation percentage |
|---|---|---|---|
| A | 30962 | 75 | 0.242232% |
| B | 30962 | 433 | 1.398488% |
| C | 30962 | 52 | 0.167948% |
| D | 30962 | 416 | 1.343582% |
Noise dominated data is calculated using 1-second bins in cleaned event files. If a bin has >2000 counts, and if more than 50% of those come from <1% of pixels, then it is considered to be noise-dominated and hence unusable.
| Quadrant | # 1 sec bins | Bins with >0 counts | Bins with >2000 counts | High rate bins dominated by noise | Noise dominated (total time) | Noise dominated (detector-on time) | Marked lightcurve |
|---|---|---|---|---|---|---|---|
| A | 33921 | 30959 | 0 | 0 | 0.00% | 0.00% |  |
| B | 33922 | 30959 | 0 | 0 | 0.00% | 0.00% |  |
| C | 33922 | 30962 | 0 | 0 | 0.00% | 0.00% |  |
| D | 33921 | 30960 | 0 | 0 | 0.00% | 0.00% |  |
Top three noisy pixels from each quadrant. If the there are fewer than three noisy pixels in the level2.evt file, extra rows are filled as -1
| Pixel properties | Quadrant properties | ||||||
|---|---|---|---|---|---|---|---|
| Quadrant | DetID | PixID | Counts | Sigma | Mean | Median | Sigma |
| A | 0 | 29 | 1376 | 10.92 | 388 | 362 | 92.8 |
| A | 7 | 110 | 1364 | 10.8 | 388 | 362 | 92.8 |
| A | 0 | 30 | 1100 | 7.95 | 388 | 362 | 92.8 |
| B | 2 | 9 | 1214 | 11.37 | 392 | 371 | 74.2 |
| B | 14 | 254 | 1046 | 9.1 | 392 | 371 | 74.2 |
| B | 2 | 8 | 951 | 7.82 | 392 | 371 | 74.2 |
| C | 12 | 241 | 1055 | 7.09 | 392 | 361 | 97.9 |
| C | 9 | 242 | 1043 | 6.96 | 392 | 361 | 97.9 |
| C | 2 | 191 | 1016 | 6.69 | 392 | 361 | 97.9 |
| D | 6 | 44 | 953 | 7.1 | 363 | 331 | 87.6 |
| D | 11 | 82 | 951 | 7.08 | 363 | 331 | 87.6 |
| D | 6 | 231 | 929 | 6.83 | 363 | 331 | 87.6 |
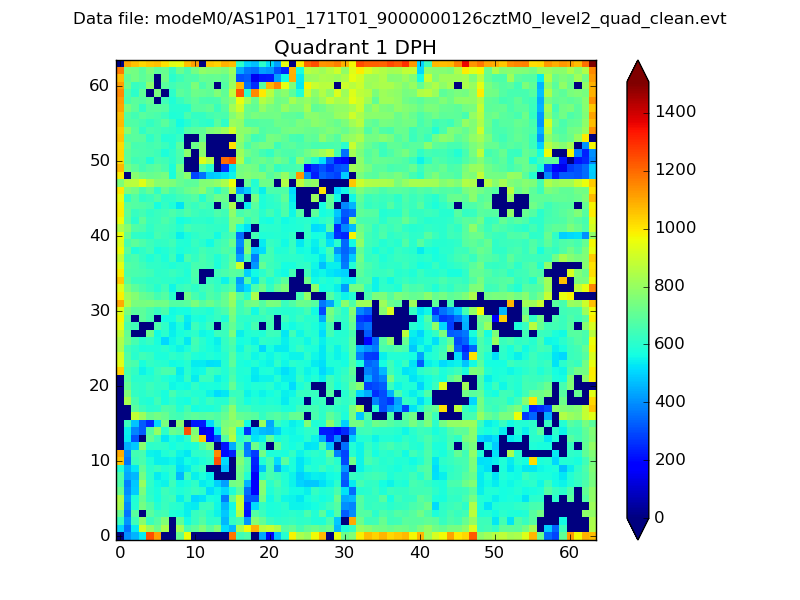
Histogram calculated using DETX and DETY for each event in the final _common_clean file
| Quadrant A |  |
 |
Quadrant B |
|---|---|---|---|
| Quadrant D |  |
 |
Quadrant C |
| Plot type | Count rate plots | Images |
|---|---|---|
| Comparison with Poisson distribution Blue bars denote a histogram of data divided into 1 sec bins. Red curve is a Poisson curve with rate = median count rate of data. |
 |
 |
| Quadrant-wise count rates Data is divided into 100 sec bins |
 |
|
| Module-wise count rates for Quadrant A Data is divided into 100 sec bins |
 |
 |
| Module-wise count rates for Quadrant B Data is divided into 100 sec bins |
 |
 |
| Module-wise count rates for Quadrant C Data is divided into 100 sec bins |
 |
 |
| Module-wise count rates for Quadrant D Data is divided into 100 sec bins |
 |
 |
| Parameter | Plot |
|---|---|
| CZT HV Monitor |  |
| D_VDD | 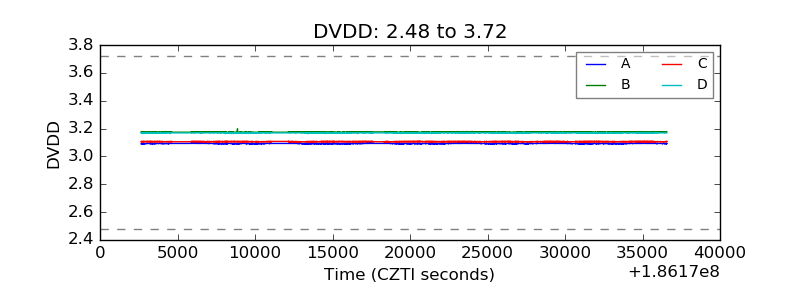 |
| Temperature 1 |  |
| Veto HV Monitor |  |
| Veto LLD |  |
| Alpha Counter |  |
| _CPM_Rate |  |
| CZT Counter |  |
| +2.5 Volts monitor |  |
| +5 Volts monitor |  |
| _ROLL_ROT |  |
| _Roll_DEC |  |
| _Roll_RA |  |
| Veto Counter |  |