| Param | Original file | Final file |
|---|---|---|
| Filename | modeM0/AS1P01_171T01_9000000126_00871cztM0_level2.evt | modeM0/AS1P01_171T01_9000000126_00871cztM0_level2_quad_clean.evt |
| Size (bytes) | 1,105,208,640 | 83,989,440 |
| Size | 1.0 GB | 80.1 MB |
| Events in quadrant A | 8,267,329 | 520,947 |
| Events in quadrant B | 8,952,618 | 523,085 |
| Events in quadrant C | 7,985,711 | 512,884 |
| Events in quadrant D | 7,803,583 | 500,901 |
| Mode SS | |||
|---|---|---|---|
| Quadrant | BADHDUFLAG | Total packets | Discarded packets |
| A | 0 | 142 | 0 |
| B | 0 | 142 | 0 |
| C | 0 | 142 | 0 |
| D | 0 | 142 | 0 |
| Mode M0 | |||
|---|---|---|---|
| Quadrant | BADHDUFLAG | Total packets | Discarded packets |
| A | 0 | 29515 | 0 |
| B | 0 | 31542 | 0 |
| C | 0 | 28670 | 0 |
| D | 0 | 28161 | 0 |
| Mode M9 | |||
|---|---|---|---|
| Quadrant | BADHDUFLAG | Total packets | Discarded packets |
| A | 0 | 12 | 0 |
| B | 0 | 12 | 0 |
| C | 0 | 12 | 0 |
| D | 0 | 12 | 0 |
| Quadrant | Total seconds | Saturated seconds | Saturation percentage |
|---|---|---|---|
| A | 6968 | 21 | 0.301378% |
| B | 6968 | 66 | 0.947187% |
| C | 6968 | 7 | 0.100459% |
| D | 6968 | 25 | 0.358783% |
Noise dominated data is calculated using 1-second bins in cleaned event files. If a bin has >2000 counts, and if more than 50% of those come from <1% of pixels, then it is considered to be noise-dominated and hence unusable.
| Quadrant | # 1 sec bins | Bins with >0 counts | Bins with >2000 counts | High rate bins dominated by noise | Noise dominated (total time) | Noise dominated (detector-on time) | Marked lightcurve |
|---|---|---|---|---|---|---|---|
| A | 7658 | 6969 | 255 | 255 | 3.33% | 3.66% | 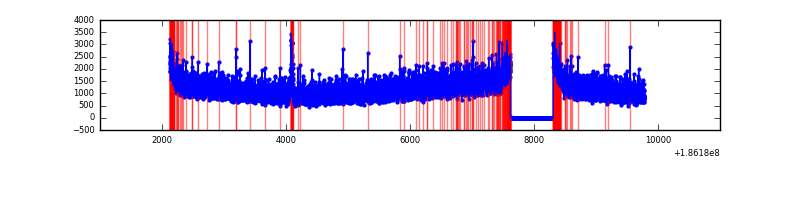 |
| B | 7658 | 6969 | 438 | 438 | 5.72% | 6.28% | 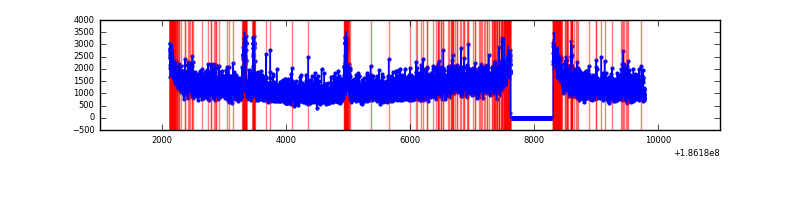 |
| C | 7658 | 6969 | 163 | 163 | 2.13% | 2.34% | 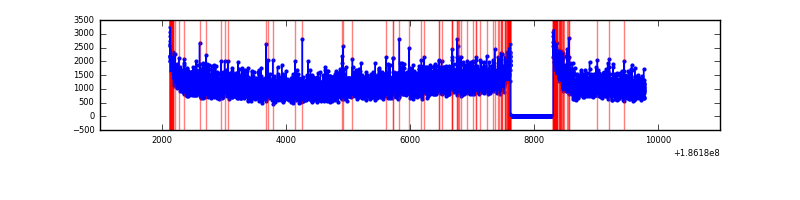 |
| D | 7658 | 6969 | 222 | 222 | 2.90% | 3.19% | 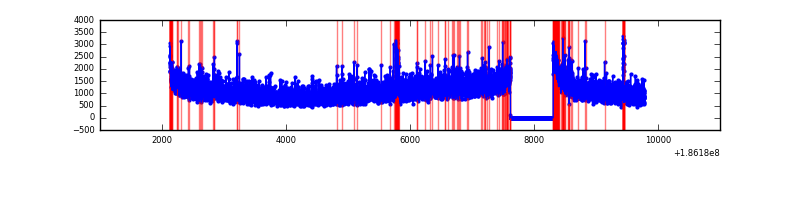 |
Top three noisy pixels from each quadrant. If the there are fewer than three noisy pixels in the level2.evt file, extra rows are filled as -1
| Pixel properties | Quadrant properties | ||||||
|---|---|---|---|---|---|---|---|
| Quadrant | DetID | PixID | Counts | Sigma | Mean | Median | Sigma |
| A | 12 | 133 | 68378 | 127.79 | 2135 | 2151 | 518.3 |
| A | 11 | 79 | 8538 | 12.32 | 2135 | 2151 | 518.3 |
| A | 10 | 133 | 7159 | 9.66 | 2135 | 2151 | 518.3 |
| B | 0 | 184 | 213747 | 404.08 | 2239 | 2250 | 523.4 |
| B | 0 | 220 | 120093 | 225.15 | 2239 | 2250 | 523.4 |
| B | 5 | 191 | 42632 | 77.15 | 2239 | 2250 | 523.4 |
| C | 3 | 111 | 25268 | 40.85 | 2030 | 2106 | 567.0 |
| C | 3 | 79 | 15275 | 23.22 | 2030 | 2106 | 567.0 |
| C | 15 | 241 | 11503 | 16.57 | 2030 | 2106 | 567.0 |
| D | 13 | 169 | 146851 | 240.41 | 1950 | 2020 | 602.4 |
| D | 13 | 73 | 109928 | 179.12 | 1950 | 2020 | 602.4 |
| D | 11 | 131 | 89659 | 145.48 | 1950 | 2020 | 602.4 |
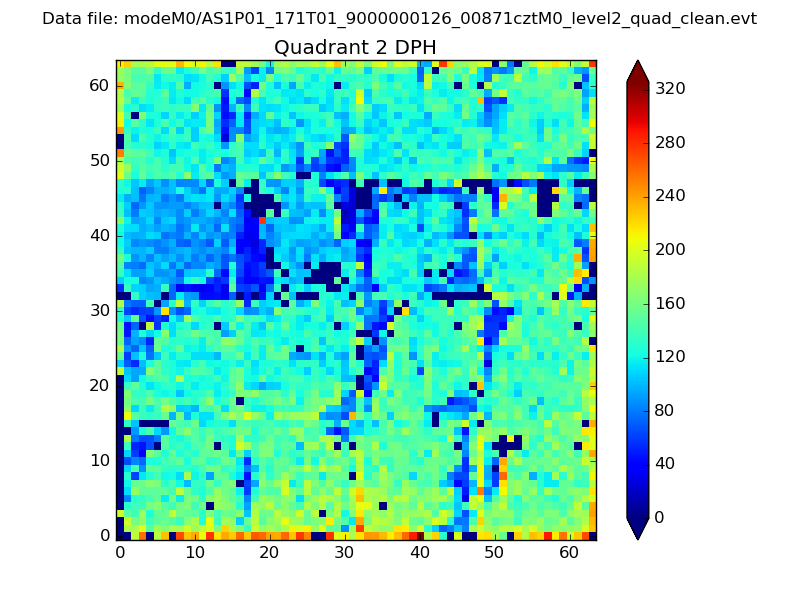
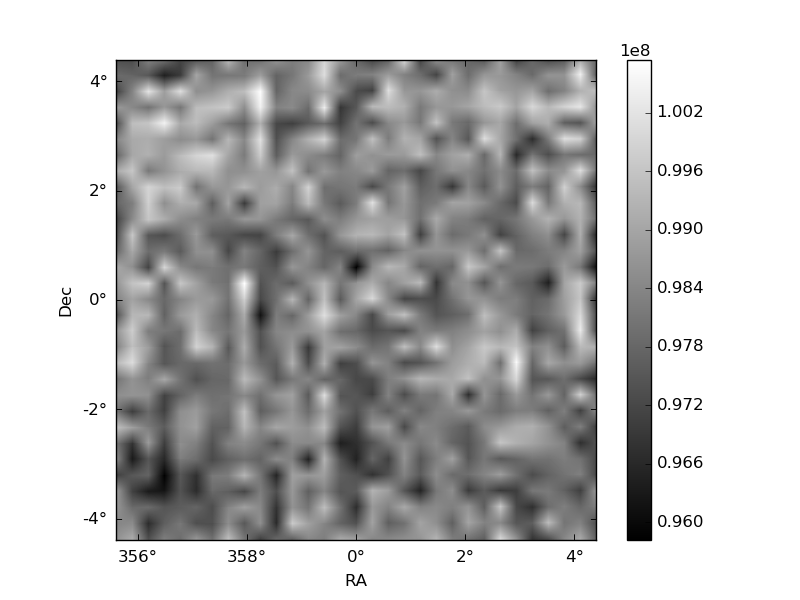
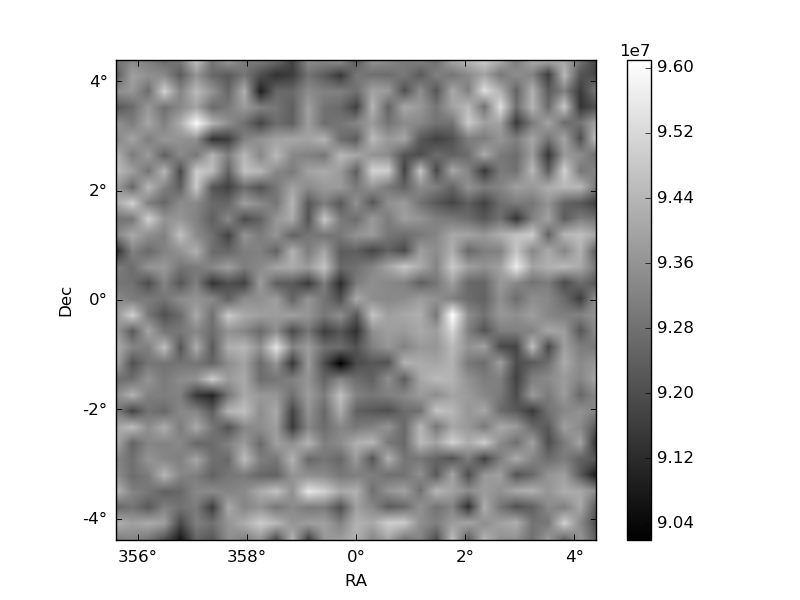
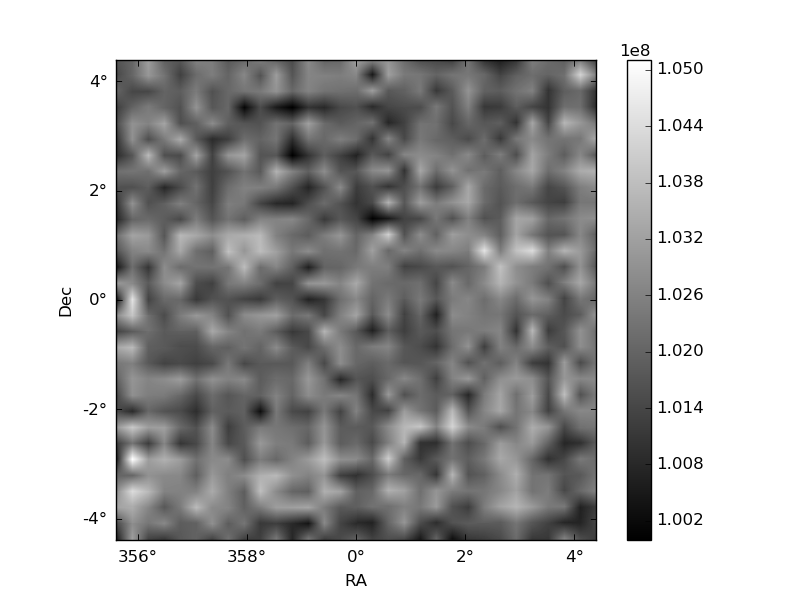
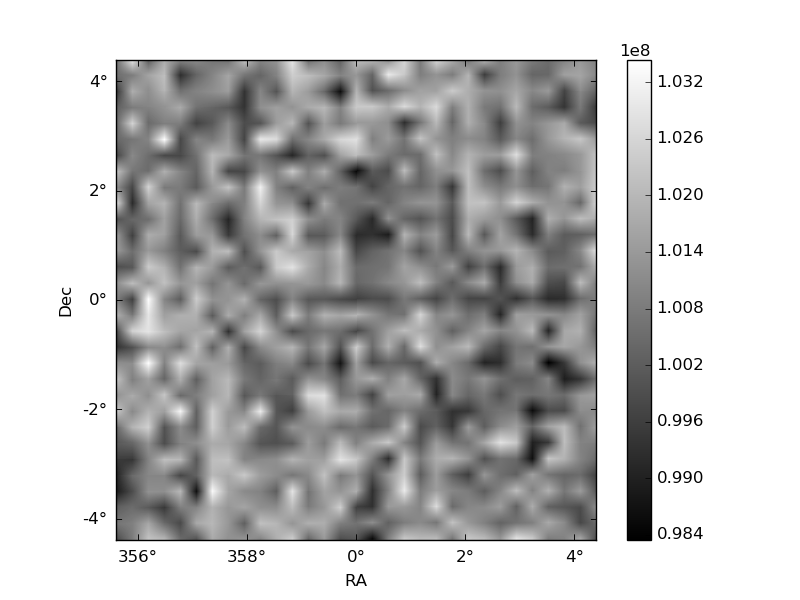
Histogram calculated using DETX and DETY for each event in the final _common_clean file
| Quadrant A | 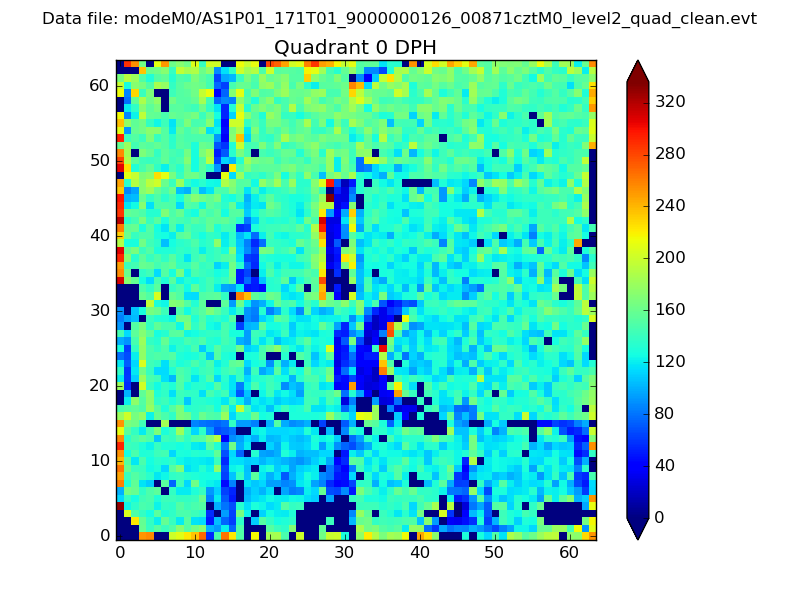 |
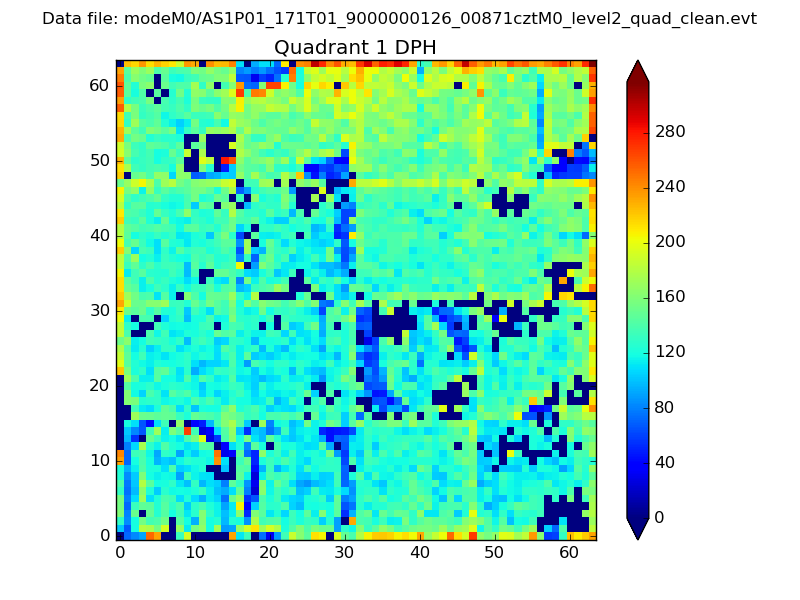 |
Quadrant B |
|---|---|---|---|
| Quadrant D | 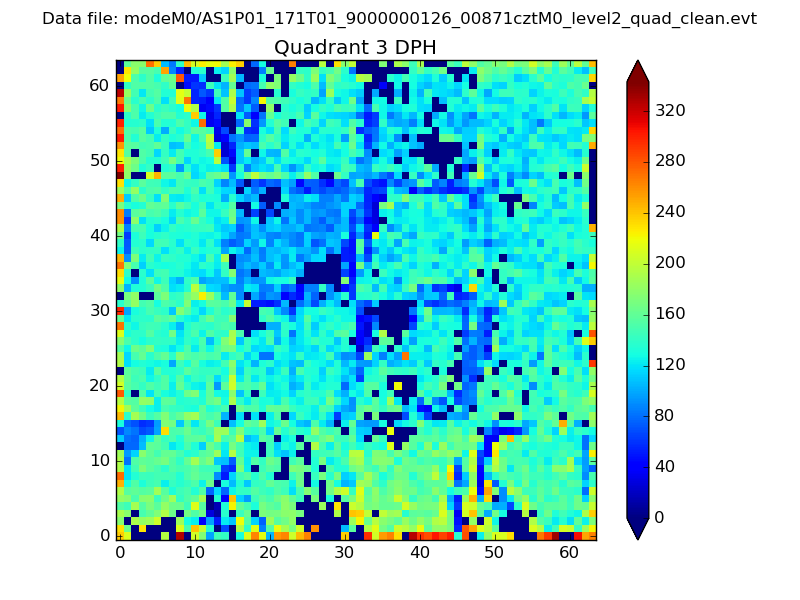 |
 |
Quadrant C |
| Plot type | Count rate plots | Images |
|---|---|---|
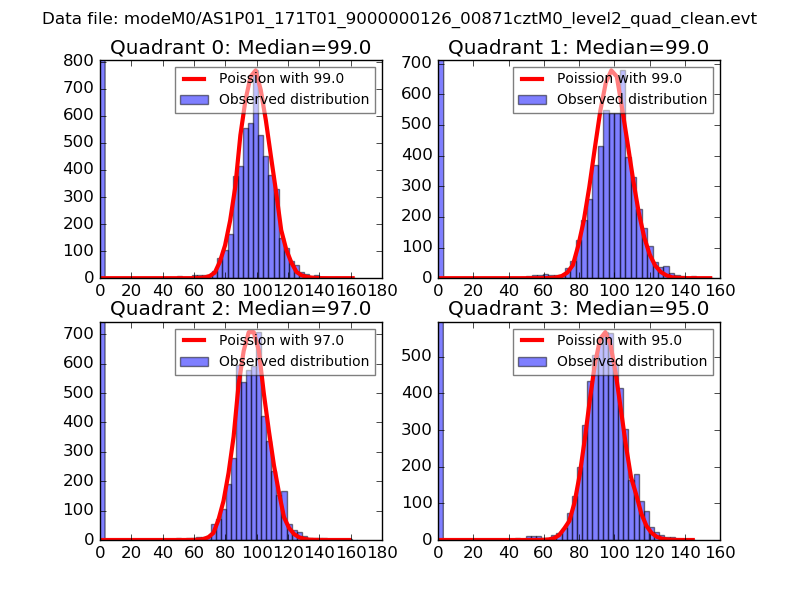
| Comparison with Poisson distribution Blue bars denote a histogram of data divided into 1 sec bins. Red curve is a Poisson curve with rate = median count rate of data. |
 |
 |
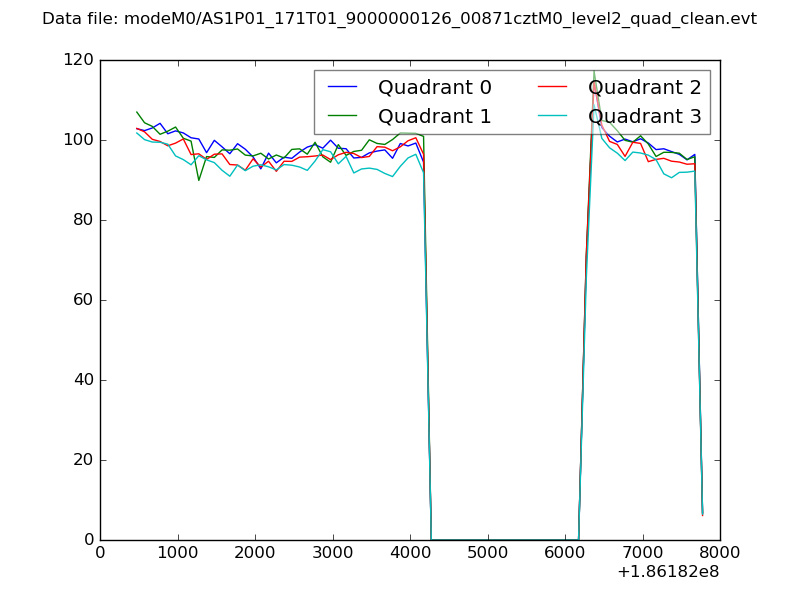
| Quadrant-wise count rates Data is divided into 100 sec bins |
 |
|
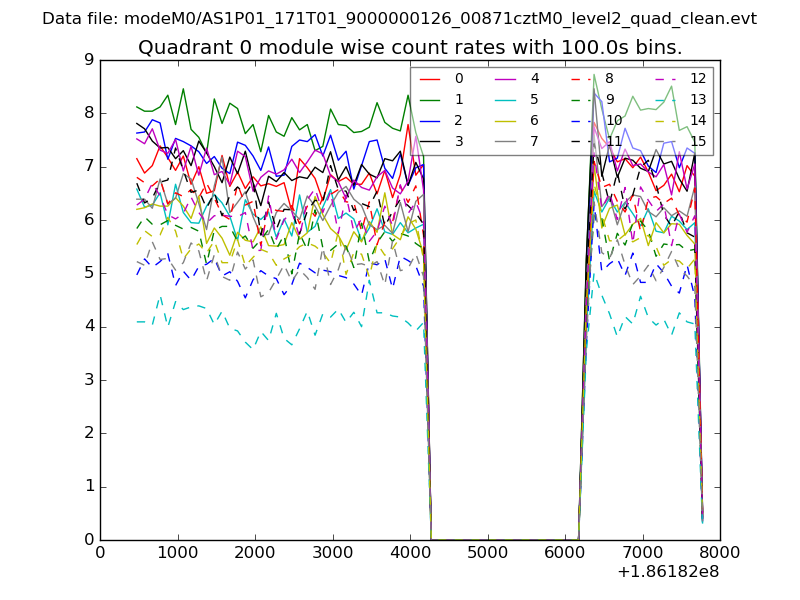
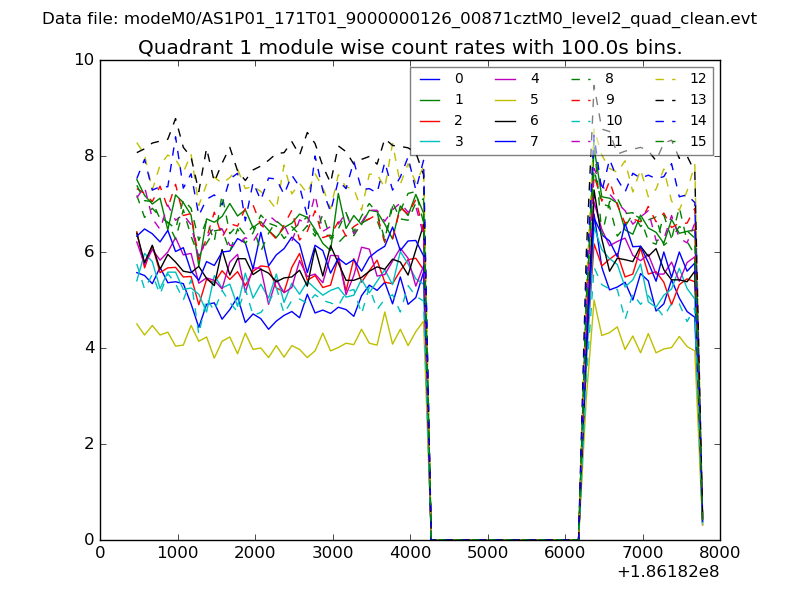
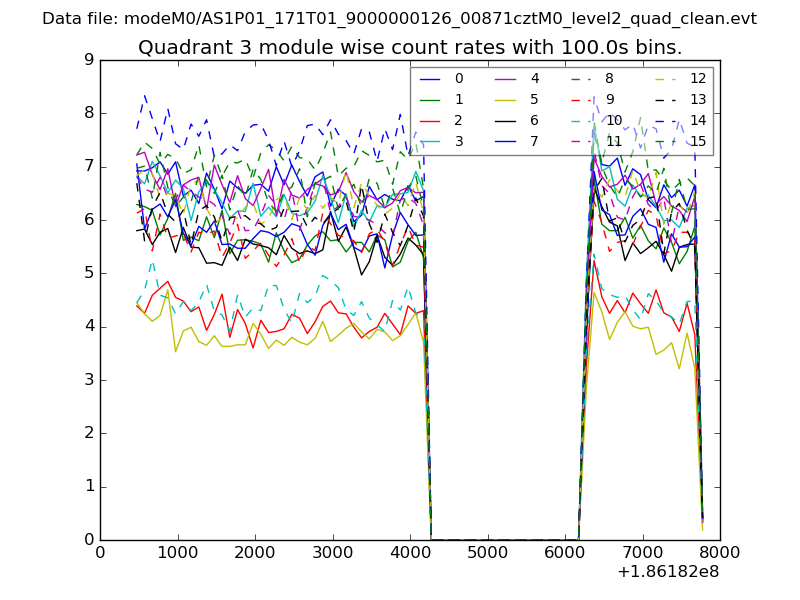
| Module-wise count rates for Quadrant A Data is divided into 100 sec bins |
 |
 |
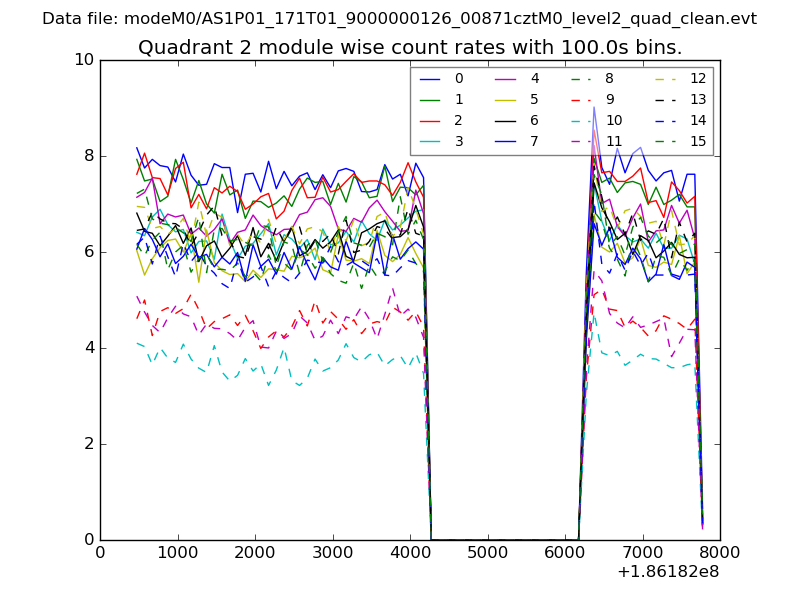
| Module-wise count rates for Quadrant B Data is divided into 100 sec bins |
 |
 |
| Module-wise count rates for Quadrant C Data is divided into 100 sec bins |
 |
 |
| Module-wise count rates for Quadrant D Data is divided into 100 sec bins |
 |
 |
| Parameter | Plot |
|---|---|
| CZT HV Monitor | 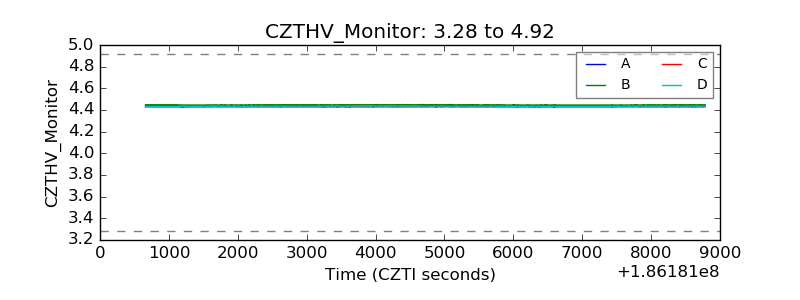 |
| D_VDD | 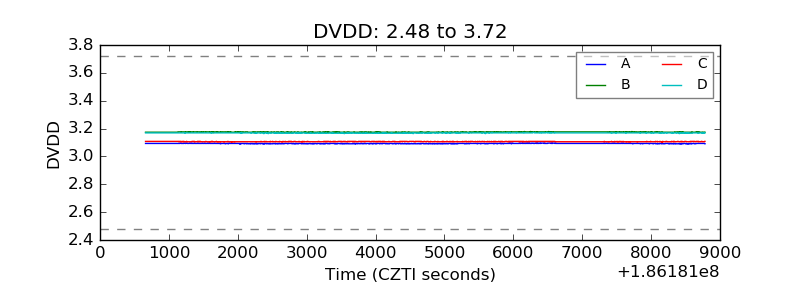 |
| Temperature 1 | 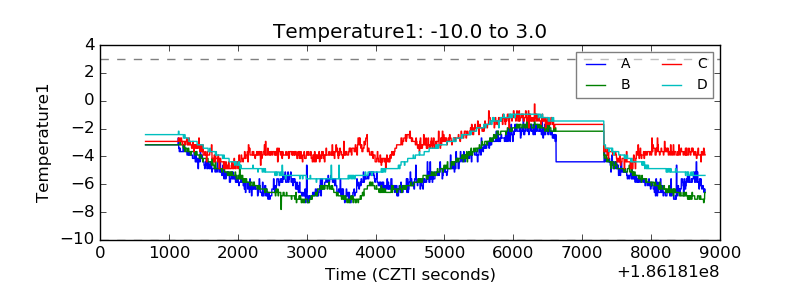 |
| Veto HV Monitor | 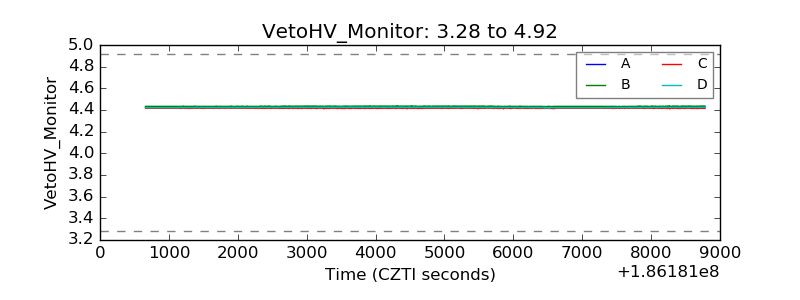 |
| Veto LLD | 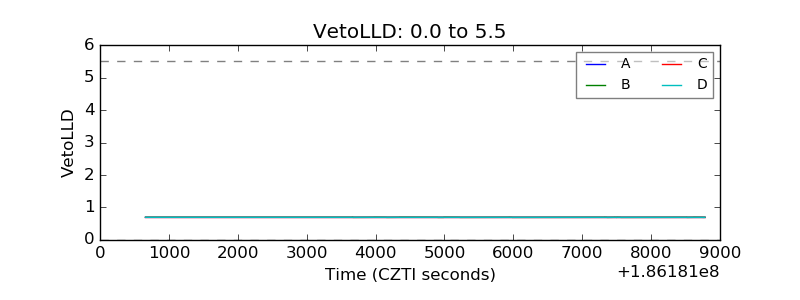 |
| Alpha Counter | 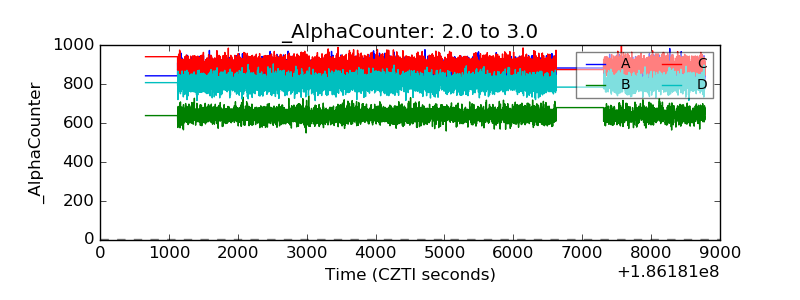 |
| _CPM_Rate | 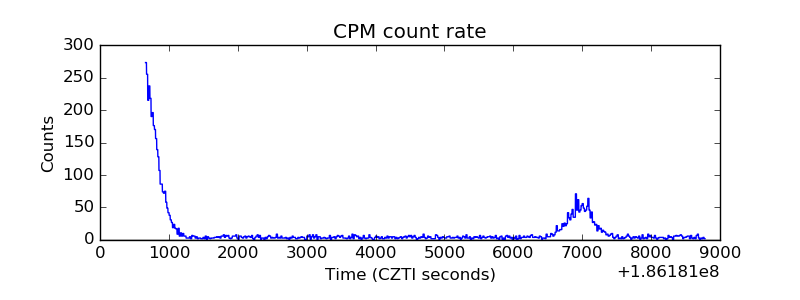 |
| CZT Counter | 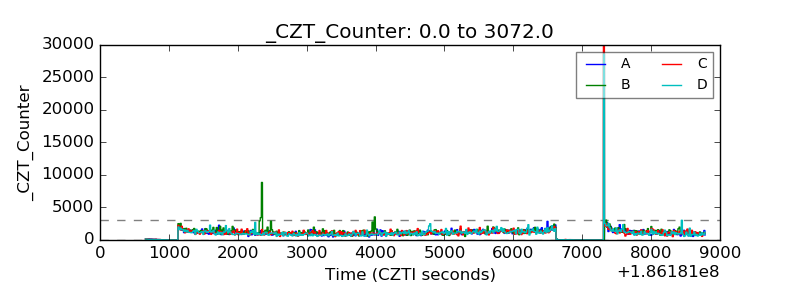 |
| +2.5 Volts monitor |  |
| +5 Volts monitor |  |
| _ROLL_ROT | 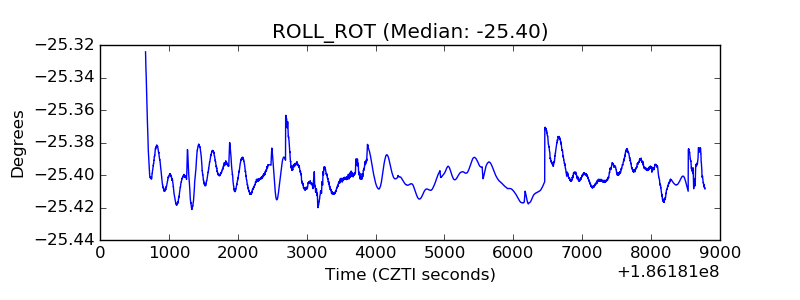 |
| _Roll_DEC | 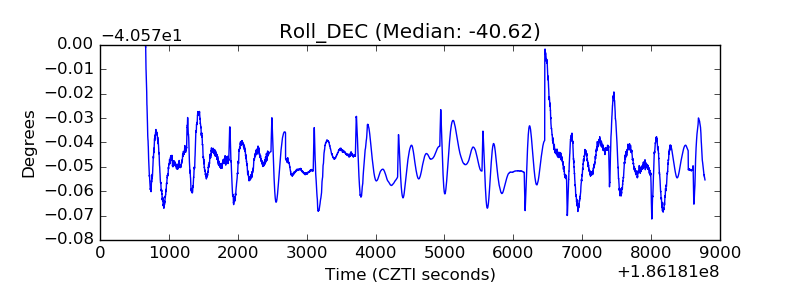 |
| _Roll_RA | 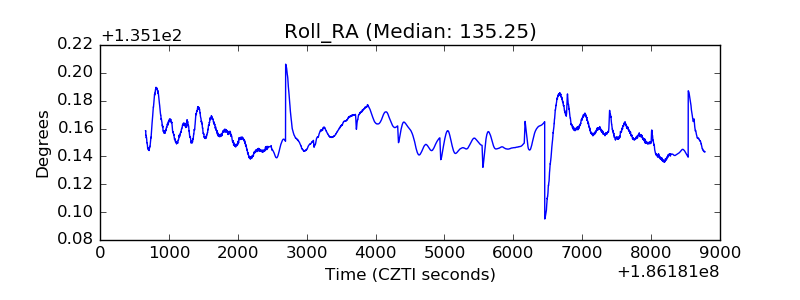 |
| Veto Counter | 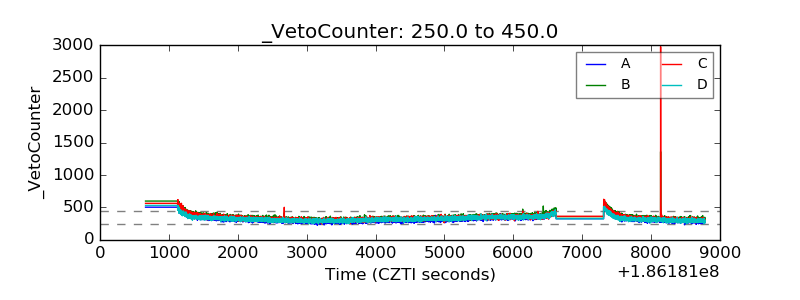 |