| Param | Original file | Final file |
|---|---|---|
| Filename | modeM0/AS1P01_171T01_9000000126_00872cztM0_level2.evt | modeM0/AS1P01_171T01_9000000126_00872cztM0_level2_quad_clean.evt |
| Size (bytes) | 1,233,714,240 | 89,824,320 |
| Size | 1.1 GB | 85.7 MB |
| Events in quadrant A | 9,212,389 | 552,698 |
| Events in quadrant B | 9,722,659 | 557,346 |
| Events in quadrant C | 9,000,943 | 544,526 |
| Events in quadrant D | 8,919,582 | 532,204 |
| Mode SS | |||
|---|---|---|---|
| Quadrant | BADHDUFLAG | Total packets | Discarded packets |
| A | 0 | 152 | 0 |
| B | 0 | 152 | 0 |
| C | 0 | 152 | 0 |
| D | 0 | 152 | 0 |
| Mode M0 | |||
|---|---|---|---|
| Quadrant | BADHDUFLAG | Total packets | Discarded packets |
| A | 0 | 32768 | 0 |
| B | 0 | 34294 | 0 |
| C | 0 | 32228 | 0 |
| D | 0 | 31938 | 0 |
| Quadrant | Total seconds | Saturated seconds | Saturation percentage |
|---|---|---|---|
| A | 7672 | 5 | 0.065172% |
| B | 7672 | 15 | 0.195516% |
| C | 7672 | 9 | 0.117310% |
| D | 7672 | 41 | 0.534411% |
Noise dominated data is calculated using 1-second bins in cleaned event files. If a bin has >2000 counts, and if more than 50% of those come from <1% of pixels, then it is considered to be noise-dominated and hence unusable.
| Quadrant | # 1 sec bins | Bins with >0 counts | Bins with >2000 counts | High rate bins dominated by noise | Noise dominated (total time) | Noise dominated (detector-on time) | Marked lightcurve |
|---|---|---|---|---|---|---|---|
| A | 7672 | 7672 | 381 | 381 | 4.97% | 4.97% | 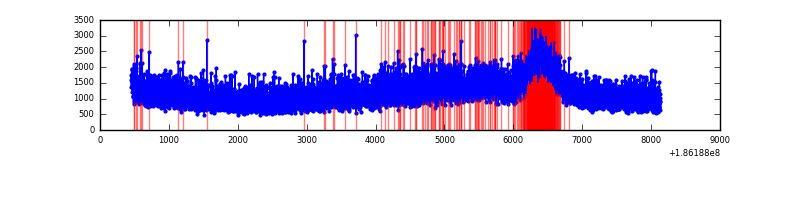 |
| B | 7672 | 7672 | 509 | 509 | 6.63% | 6.63% | 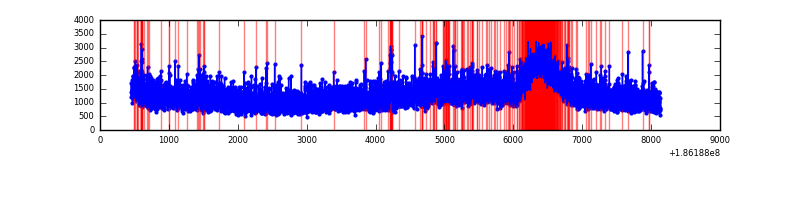 |
| C | 7672 | 7672 | 321 | 321 | 4.18% | 4.18% | 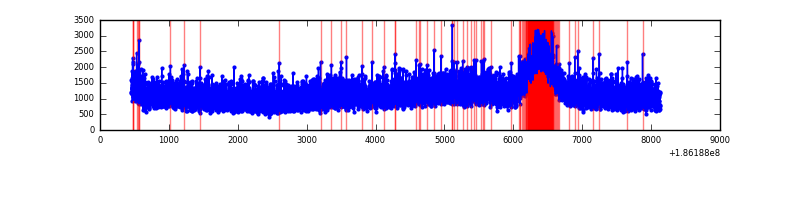 |
| D | 7672 | 7672 | 382 | 382 | 4.98% | 4.98% | 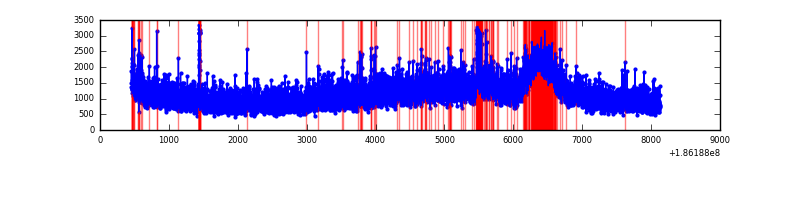 |
Top three noisy pixels from each quadrant. If the there are fewer than three noisy pixels in the level2.evt file, extra rows are filled as -1
| Pixel properties | Quadrant properties | ||||||
|---|---|---|---|---|---|---|---|
| Quadrant | DetID | PixID | Counts | Sigma | Mean | Median | Sigma |
| A | 11 | 79 | 11202 | 15.05 | 2400 | 2424 | 583.2 |
| A | 3 | 111 | 7585 | 8.85 | 2400 | 2424 | 583.2 |
| A | 14 | 203 | 6349 | 6.73 | 2400 | 2424 | 583.2 |
| B | 0 | 220 | 37452 | 59.14 | 2521 | 2532 | 590.5 |
| B | 5 | 249 | 32901 | 51.43 | 2521 | 2532 | 590.5 |
| B | 0 | 184 | 32162 | 50.18 | 2521 | 2532 | 590.5 |
| C | 3 | 111 | 31537 | 45.35 | 2289 | 2374 | 643.1 |
| C | 3 | 79 | 20284 | 27.85 | 2289 | 2374 | 643.1 |
| C | 15 | 241 | 13075 | 16.64 | 2289 | 2374 | 643.1 |
| D | 13 | 169 | 214867 | 309.7 | 2199 | 2276 | 686.4 |
| D | 1 | 4 | 135993 | 194.8 | 2199 | 2276 | 686.4 |
| D | 2 | 107 | 101583 | 144.67 | 2199 | 2276 | 686.4 |
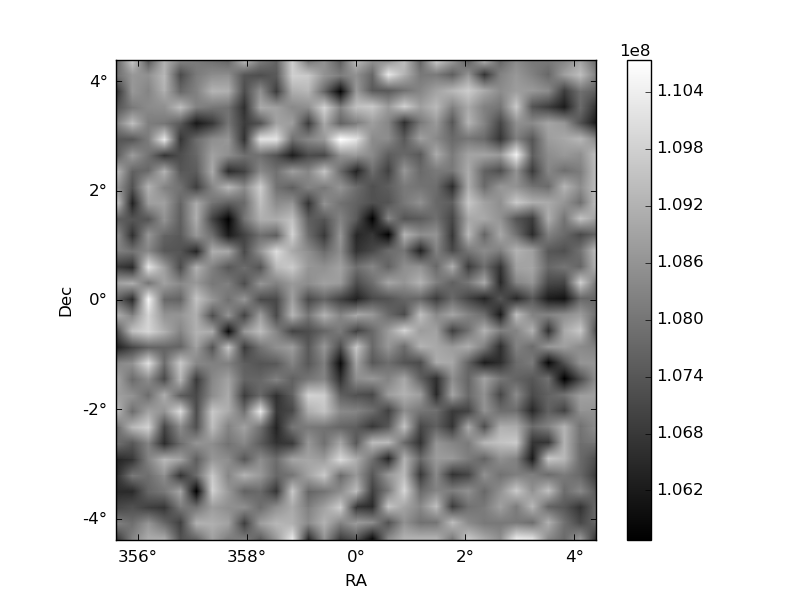
Histogram calculated using DETX and DETY for each event in the final _common_clean file
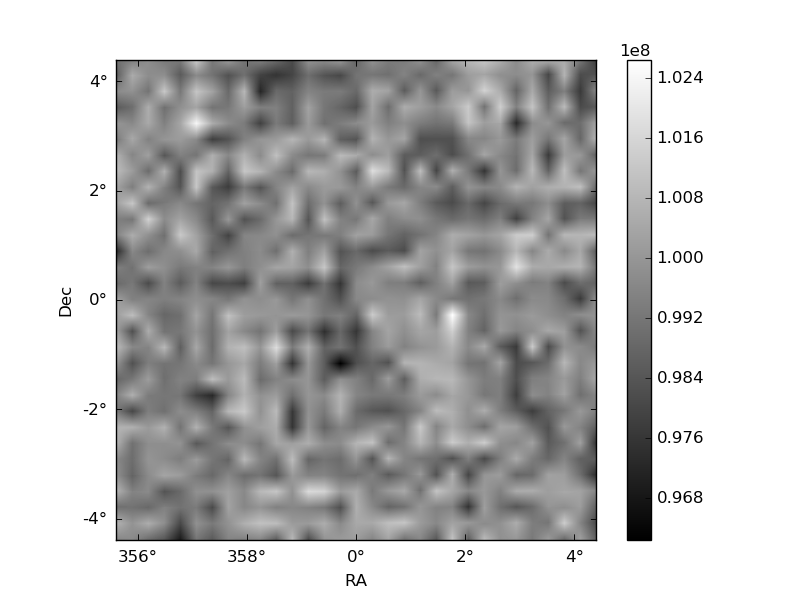
| Quadrant A | 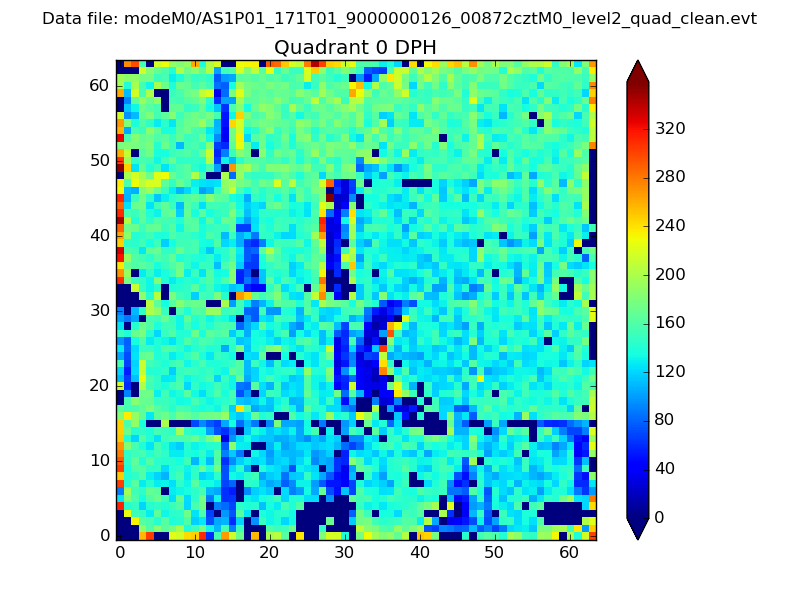 |
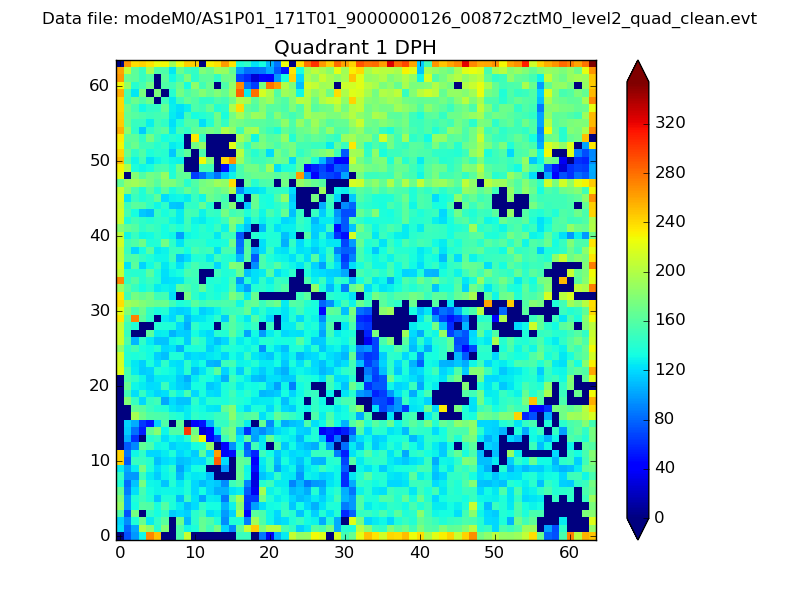 |
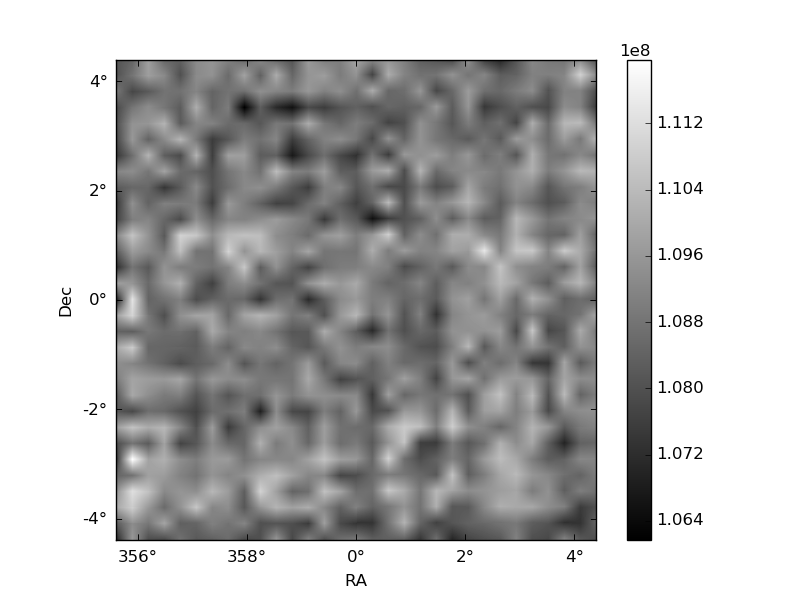
Quadrant B |
|---|---|---|---|
| Quadrant D | 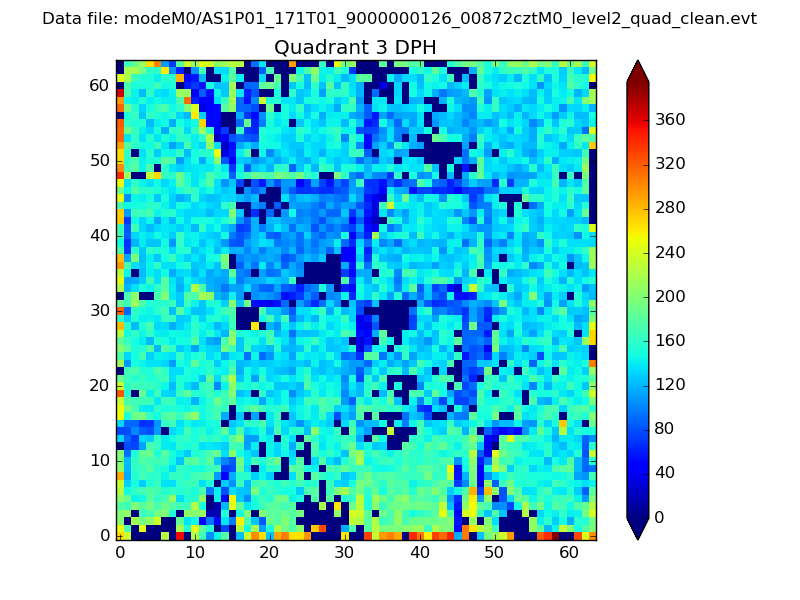 |
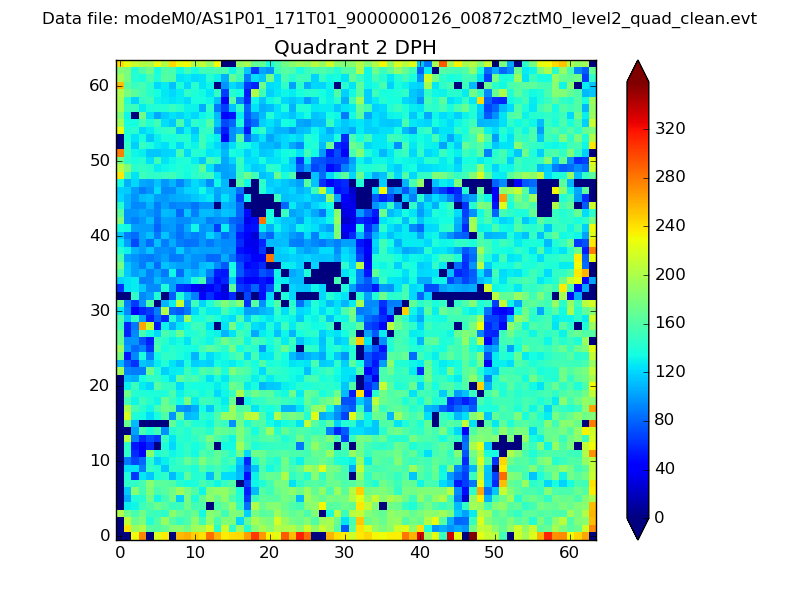 |
Quadrant C |
| Plot type | Count rate plots | Images |
|---|---|---|
| Comparison with Poisson distribution Blue bars denote a histogram of data divided into 1 sec bins. Red curve is a Poisson curve with rate = median count rate of data. |
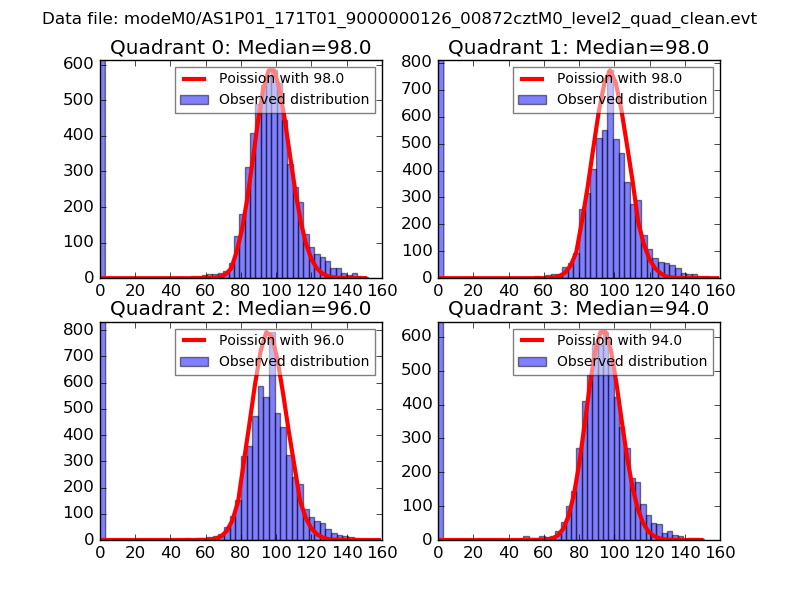 |
 |
| Quadrant-wise count rates Data is divided into 100 sec bins |
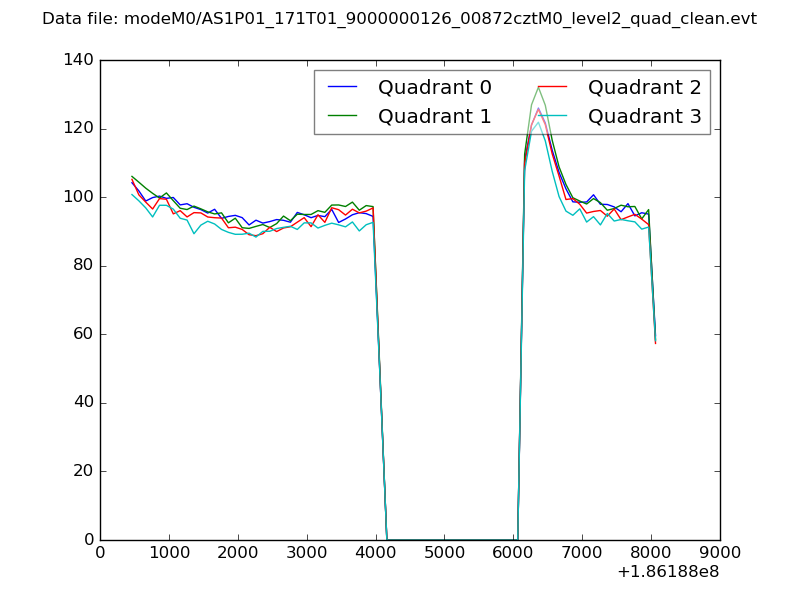 |
|
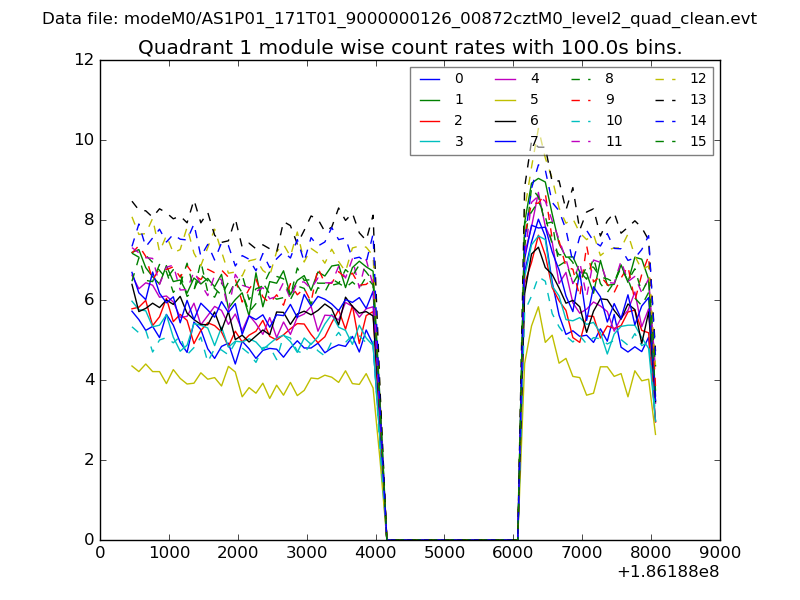
| Module-wise count rates for Quadrant A Data is divided into 100 sec bins |
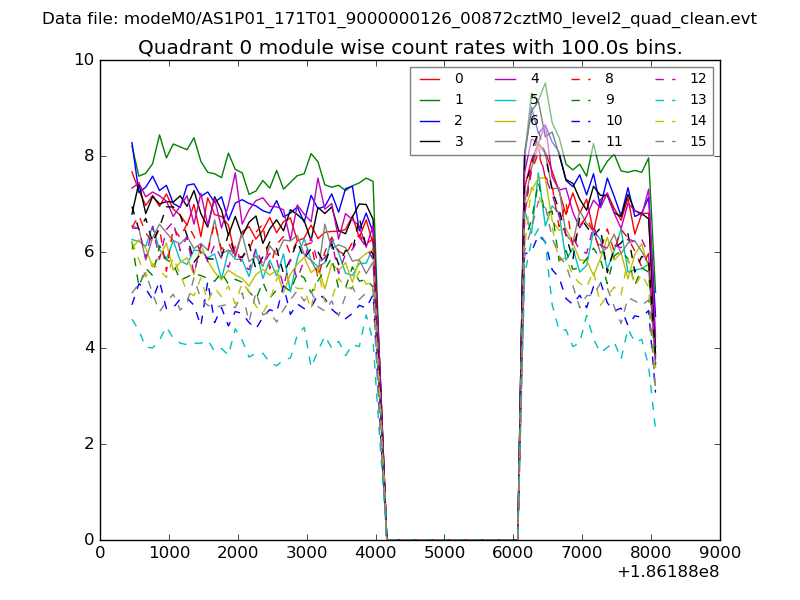 |
 |
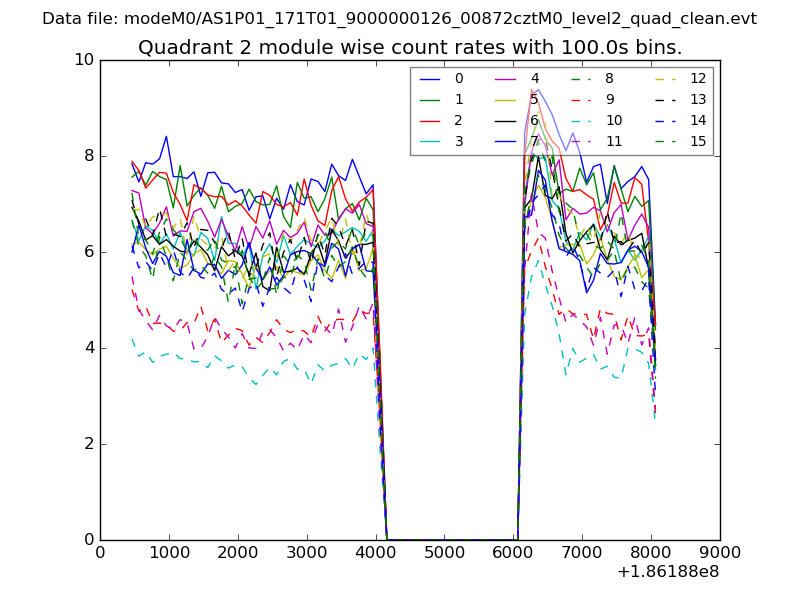
| Module-wise count rates for Quadrant B Data is divided into 100 sec bins |
 |
 |
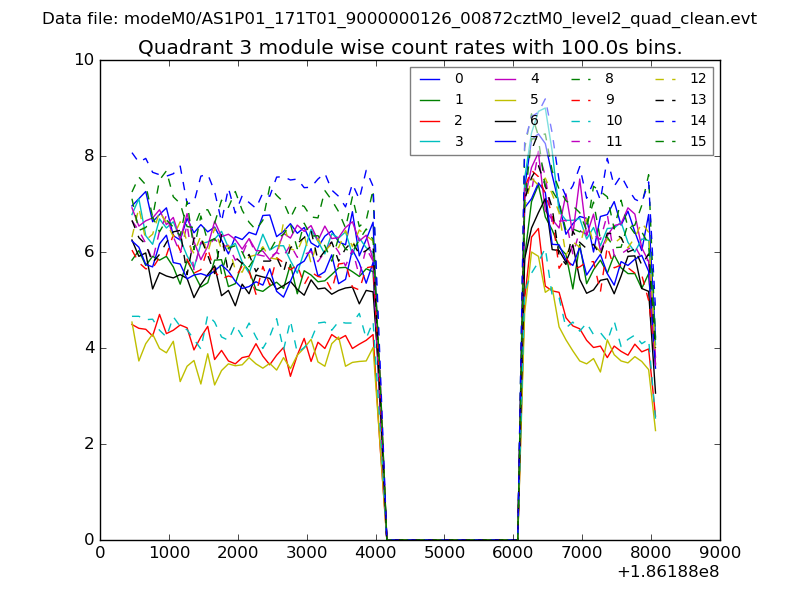
| Module-wise count rates for Quadrant C Data is divided into 100 sec bins |
 |
 |
| Module-wise count rates for Quadrant D Data is divided into 100 sec bins |
 |
 |
| Parameter | Plot |
|---|---|
| CZT HV Monitor | 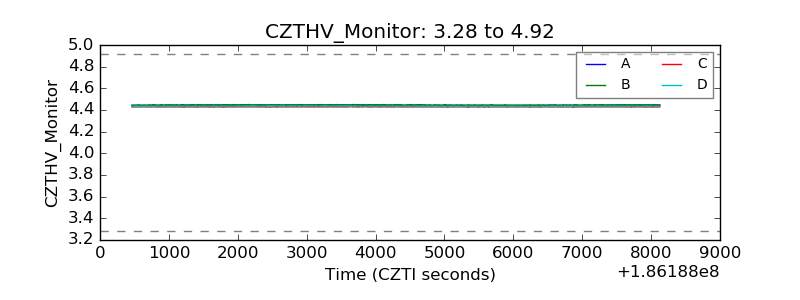 |
| D_VDD |  |
| Temperature 1 | 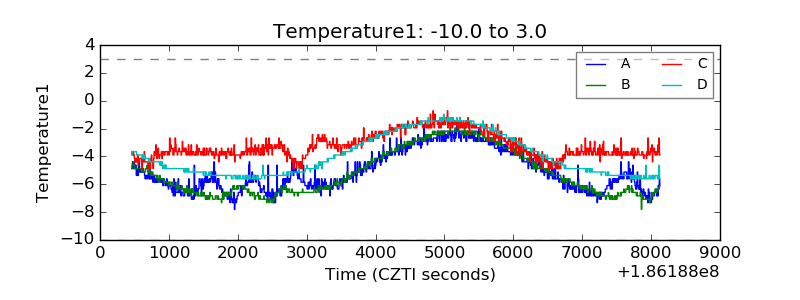 |
| Veto HV Monitor | 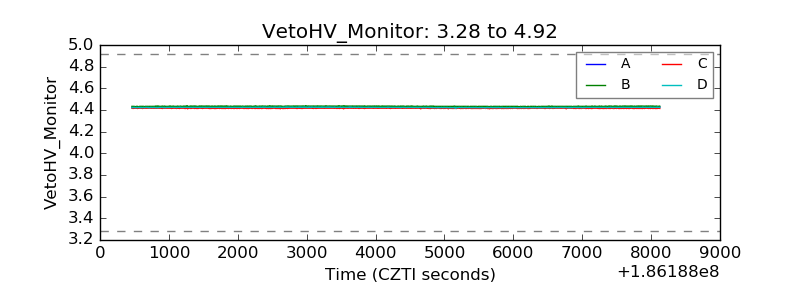 |
| Veto LLD | 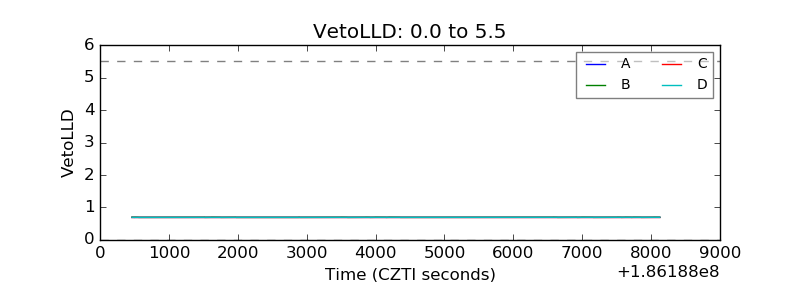 |
| Alpha Counter | 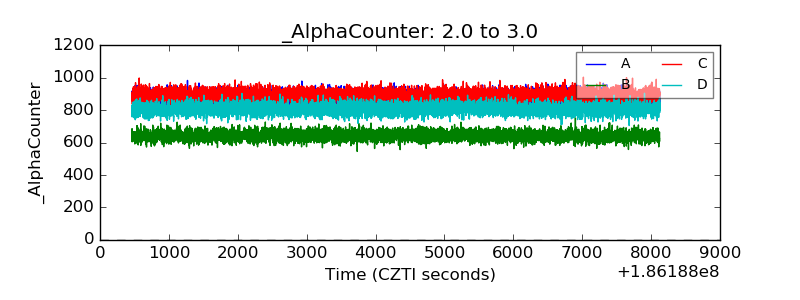 |
| _CPM_Rate | 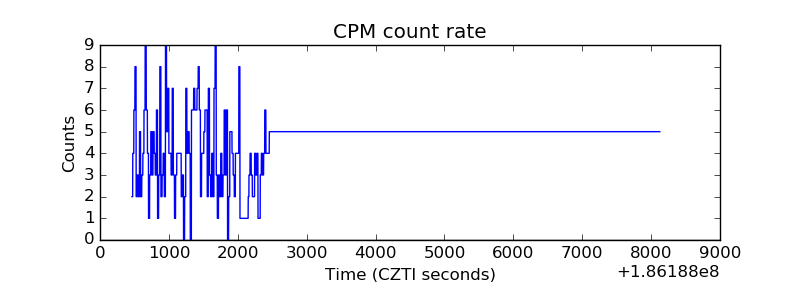 |
| CZT Counter | 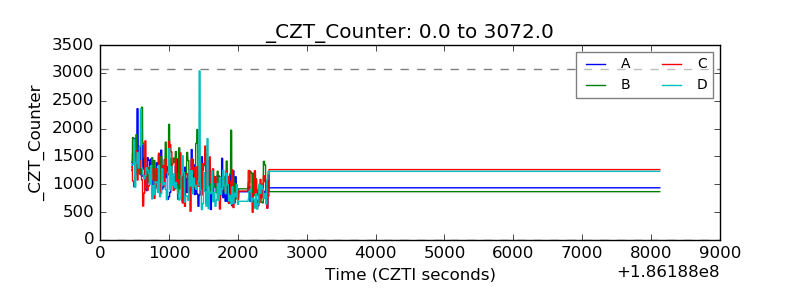 |
| +2.5 Volts monitor |  |
| +5 Volts monitor |  |
| _ROLL_ROT | 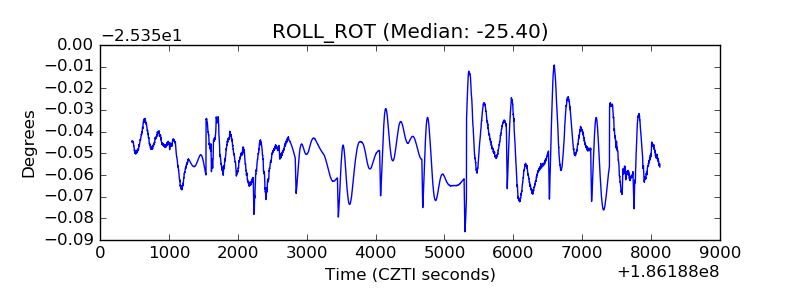 |
| _Roll_DEC | 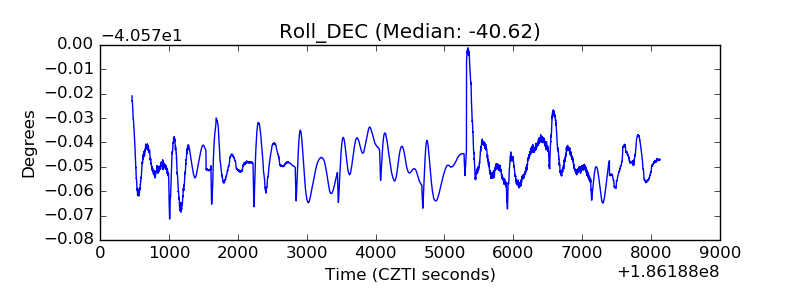 |
| _Roll_RA |  |
| Veto Counter | 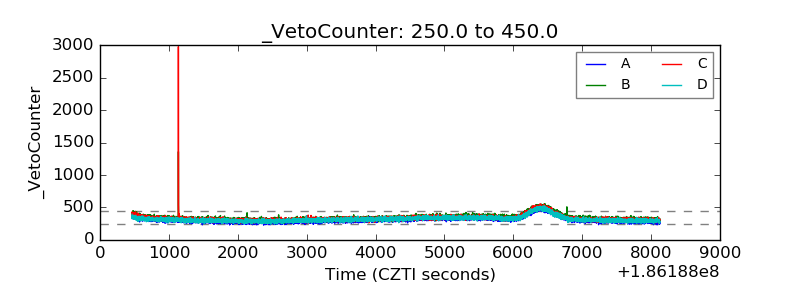 |