| Param | Original file | Final file |
|---|---|---|
| Filename | modeM0/AS1P01_171T01_9000000126_00873cztM0_level2.evt | modeM0/AS1P01_171T01_9000000126_00873cztM0_level2_quad_clean.evt |
| Size (bytes) | 1,123,922,880 | 80,377,920 |
| Size | 1.0 GB | 76.7 MB |
| Events in quadrant A | 8,309,035 | 489,753 |
| Events in quadrant B | 8,887,936 | 493,489 |
| Events in quadrant C | 8,469,721 | 482,767 |
| Events in quadrant D | 7,900,411 | 473,034 |
| Mode SS | |||
|---|---|---|---|
| Quadrant | BADHDUFLAG | Total packets | Discarded packets |
| A | 0 | 142 | 0 |
| B | 0 | 142 | 0 |
| C | 0 | 142 | 0 |
| D | 0 | 142 | 0 |
| Mode M0 | |||
|---|---|---|---|
| Quadrant | BADHDUFLAG | Total packets | Discarded packets |
| A | 0 | 29739 | 0 |
| B | 0 | 31447 | 0 |
| C | 0 | 30190 | 0 |
| D | 0 | 28517 | 0 |
| Quadrant | Total seconds | Saturated seconds | Saturation percentage |
|---|---|---|---|
| A | 7106 | 1 | 0.014073% |
| B | 7106 | 9 | 0.126654% |
| C | 7107 | 5 | 0.070353% |
| D | 7107 | 7 | 0.098494% |
Noise dominated data is calculated using 1-second bins in cleaned event files. If a bin has >2000 counts, and if more than 50% of those come from <1% of pixels, then it is considered to be noise-dominated and hence unusable.
| Quadrant | # 1 sec bins | Bins with >0 counts | Bins with >2000 counts | High rate bins dominated by noise | Noise dominated (total time) | Noise dominated (detector-on time) | Marked lightcurve |
|---|---|---|---|---|---|---|---|
| A | 7106 | 7106 | 194 | 194 | 2.73% | 2.73% | 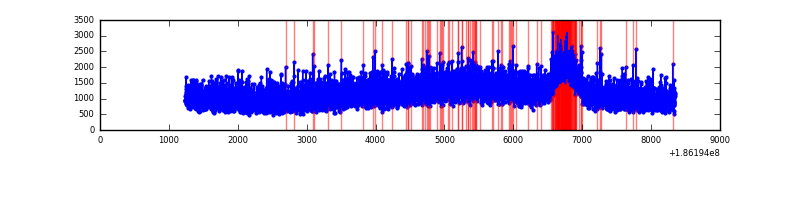 |
| B | 7106 | 7106 | 352 | 352 | 4.95% | 4.95% | 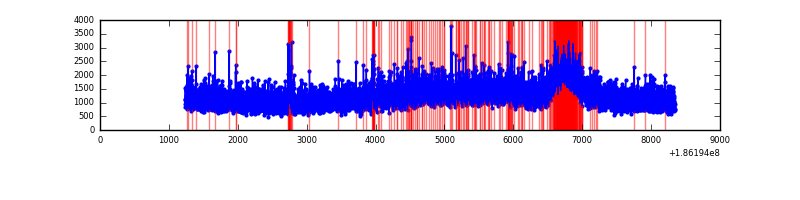 |
| C | 7107 | 7107 | 253 | 253 | 3.56% | 3.56% | 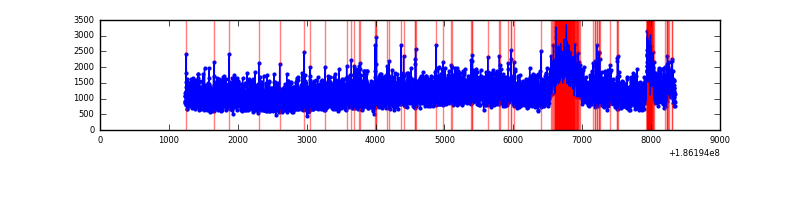 |
| D | 7107 | 7107 | 128 | 128 | 1.80% | 1.80% | 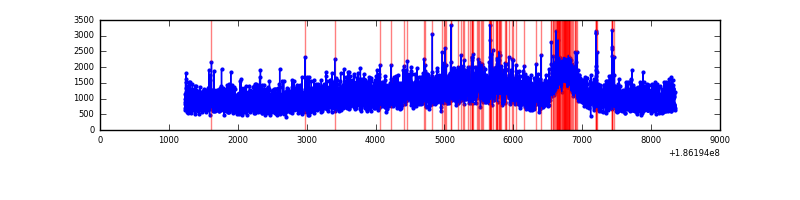 |
Top three noisy pixels from each quadrant. If the there are fewer than three noisy pixels in the level2.evt file, extra rows are filled as -1
| Pixel properties | Quadrant properties | ||||||
|---|---|---|---|---|---|---|---|
| Quadrant | DetID | PixID | Counts | Sigma | Mean | Median | Sigma |
| A | 11 | 79 | 10502 | 15.97 | 2164 | 2177 | 521.2 |
| A | 3 | 111 | 6559 | 8.41 | 2164 | 2177 | 521.2 |
| A | 14 | 203 | 5619 | 6.6 | 2164 | 2177 | 521.2 |
| B | 0 | 184 | 70745 | 126.7 | 2282 | 2296 | 540.3 |
| B | 0 | 220 | 70595 | 126.42 | 2282 | 2296 | 540.3 |
| B | 5 | 249 | 26931 | 45.6 | 2282 | 2296 | 540.3 |
| C | 1 | 192 | 254146 | 432.31 | 2088 | 2168 | 582.9 |
| C | 3 | 111 | 28726 | 45.56 | 2088 | 2168 | 582.9 |
| C | 3 | 79 | 17977 | 27.12 | 2088 | 2168 | 582.9 |
| D | 1 | 4 | 243950 | 388.16 | 2003 | 2077 | 623.1 |
| D | 13 | 169 | 125403 | 197.91 | 2003 | 2077 | 623.1 |
| D | 2 | 16 | 17701 | 25.07 | 2003 | 2077 | 623.1 |
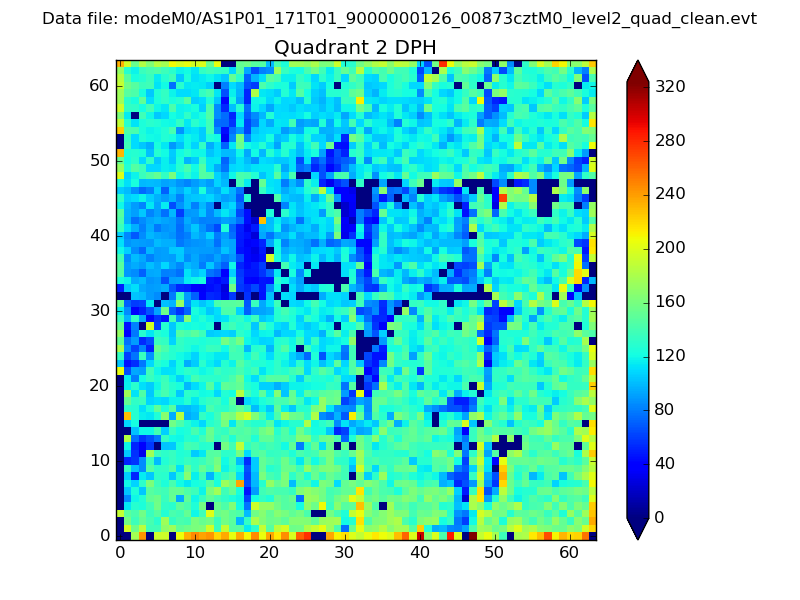
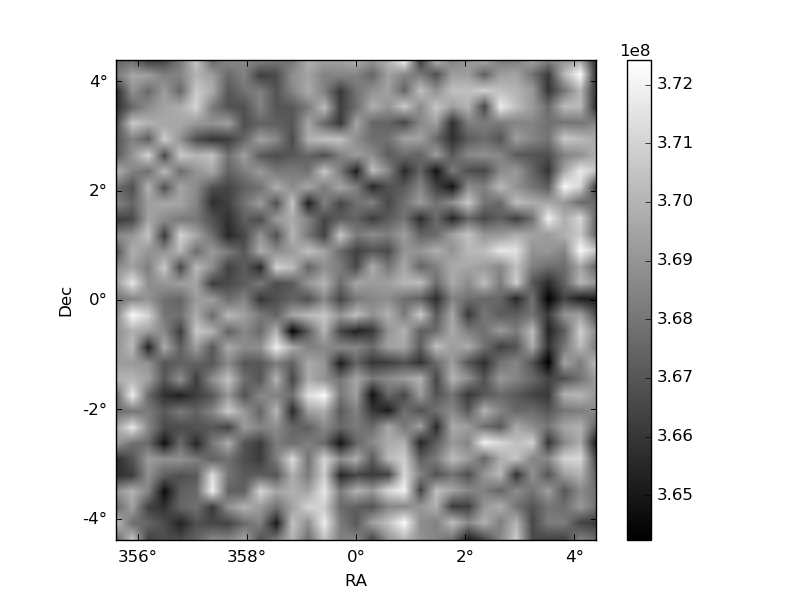
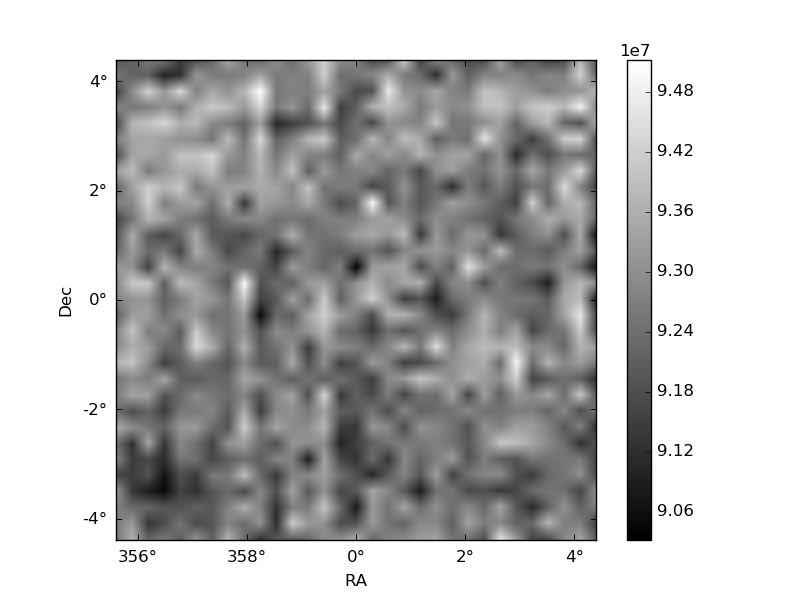
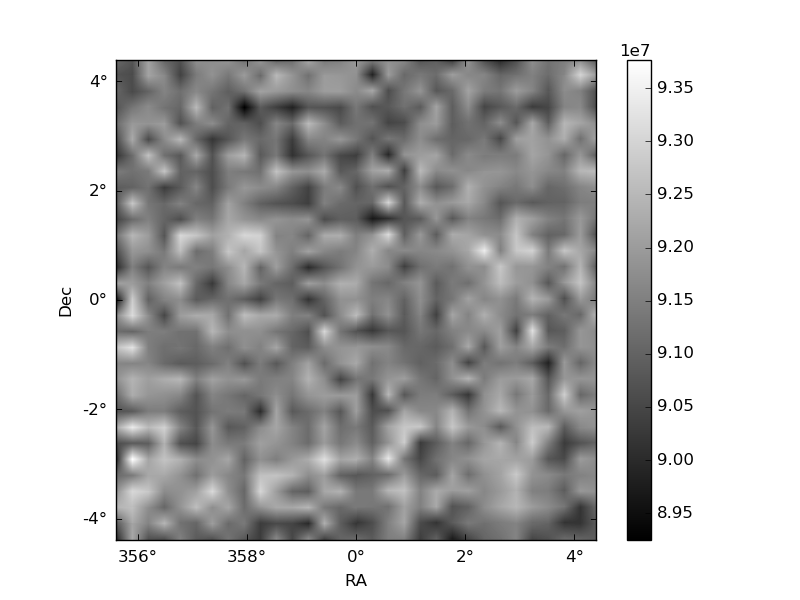
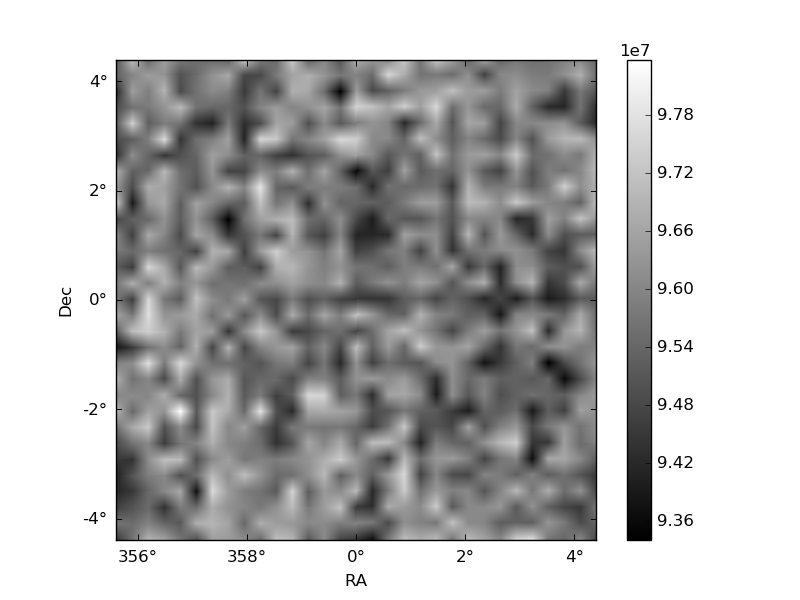
Histogram calculated using DETX and DETY for each event in the final _common_clean file
| Quadrant A | 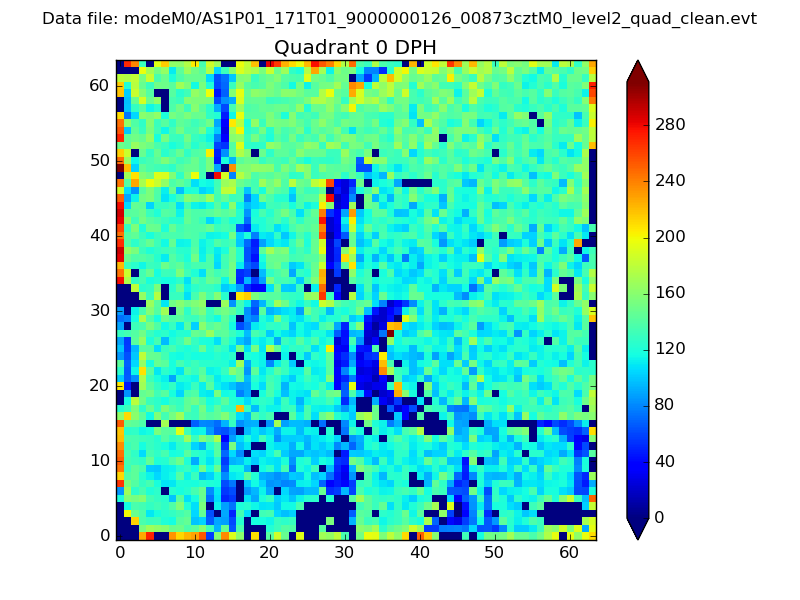 |
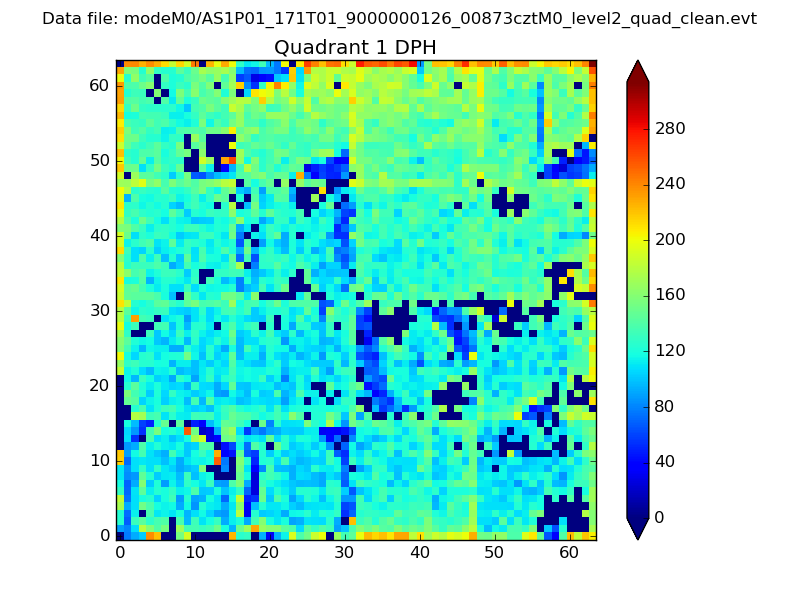 |
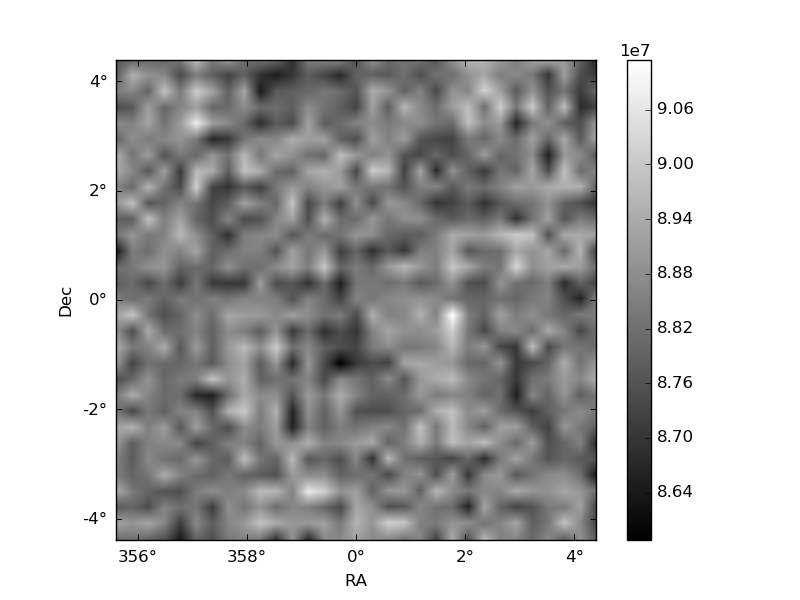
Quadrant B |
|---|---|---|---|
| Quadrant D | 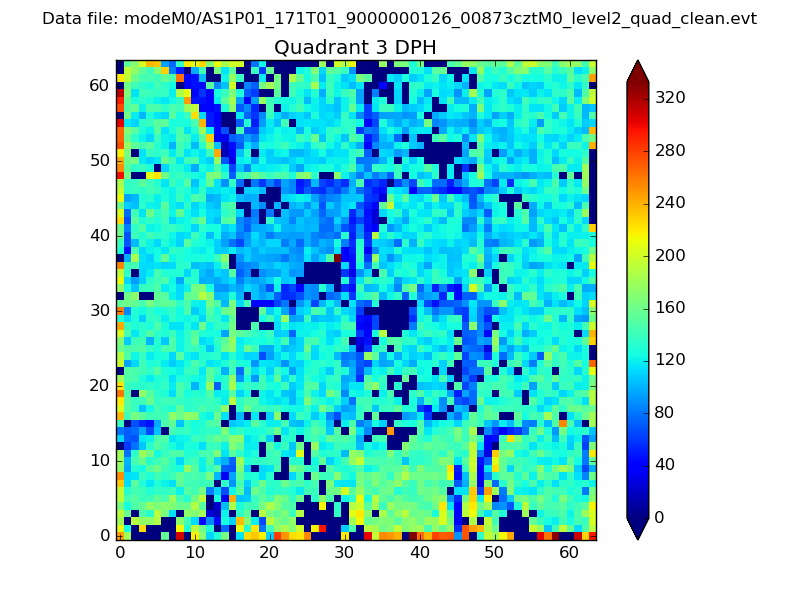 |
 |
Quadrant C |
| Plot type | Count rate plots | Images |
|---|---|---|
| Comparison with Poisson distribution Blue bars denote a histogram of data divided into 1 sec bins. Red curve is a Poisson curve with rate = median count rate of data. |
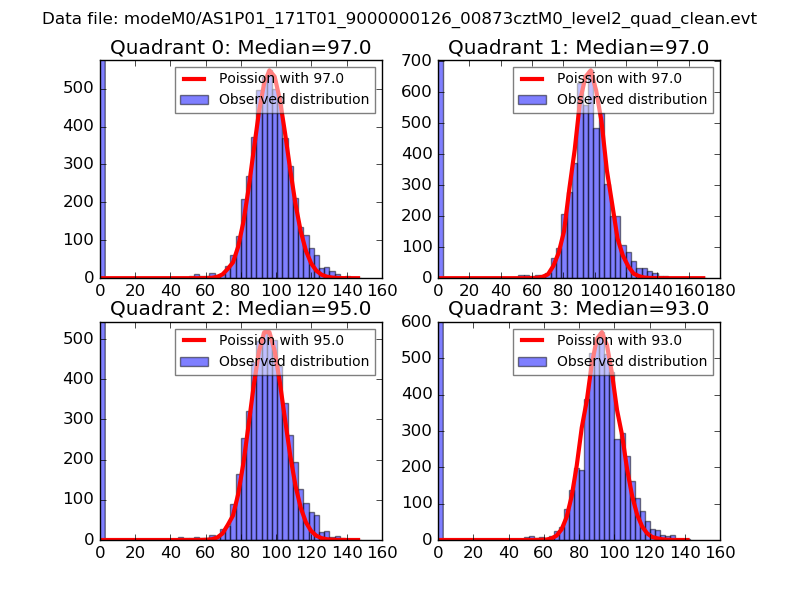 |
 |
| Quadrant-wise count rates Data is divided into 100 sec bins |
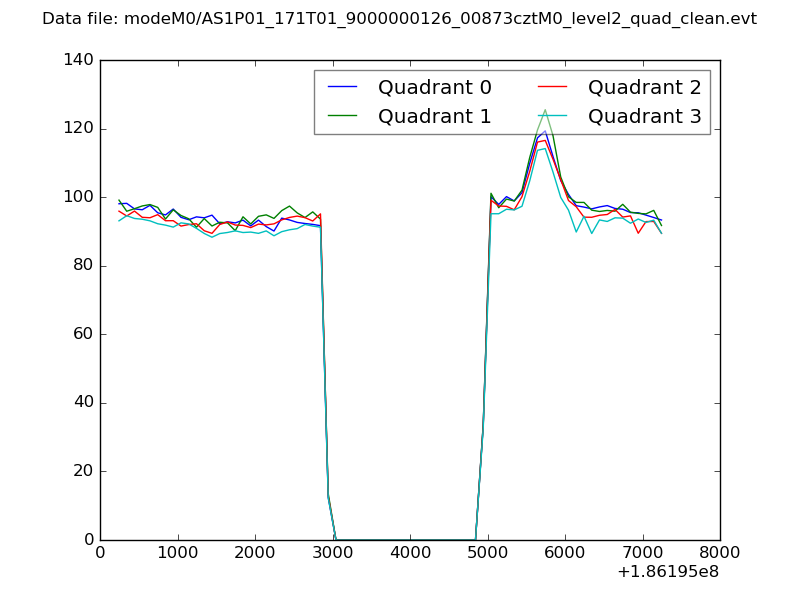 |
|
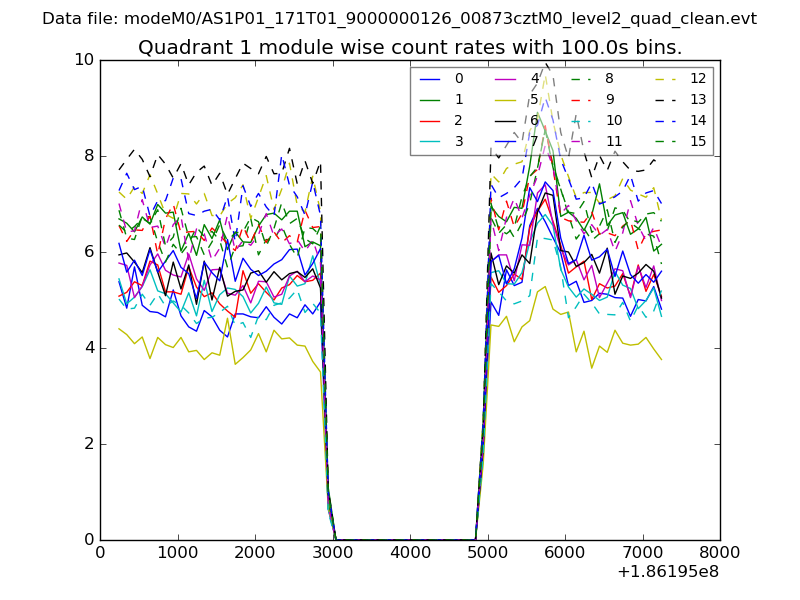
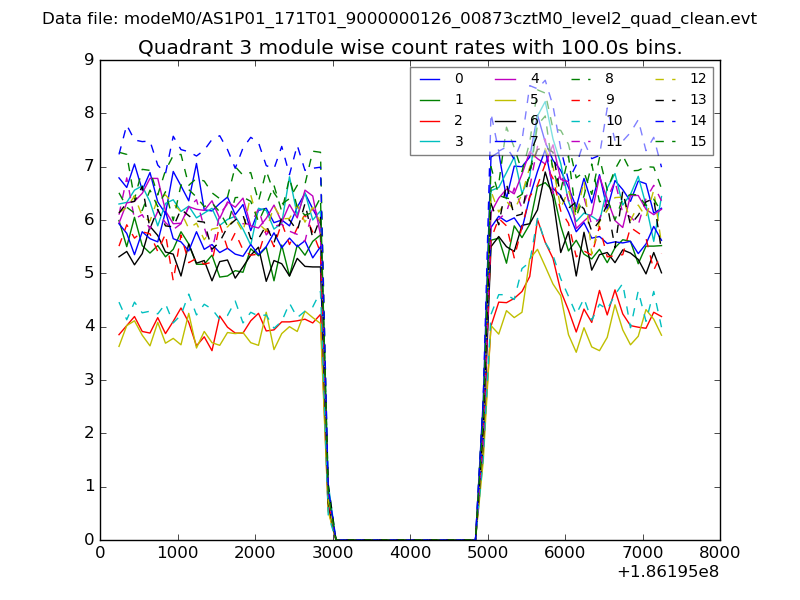
| Module-wise count rates for Quadrant A Data is divided into 100 sec bins |
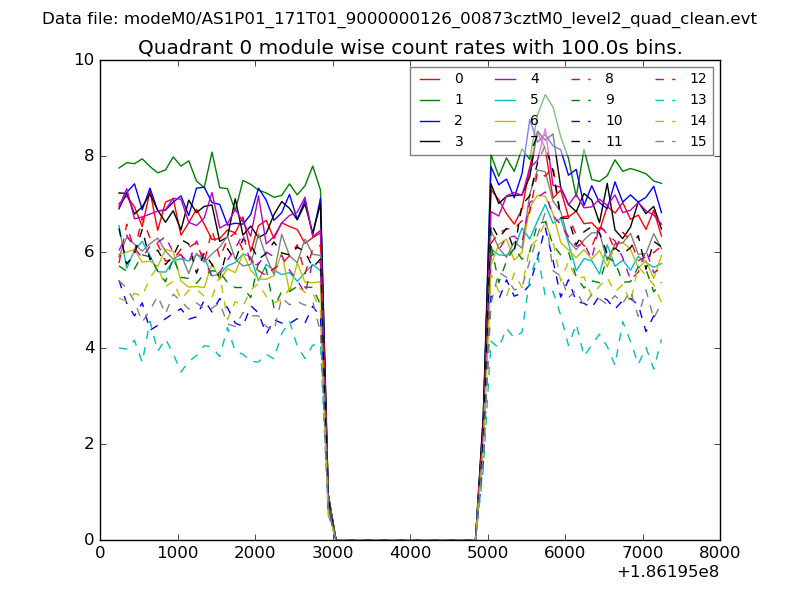 |
 |
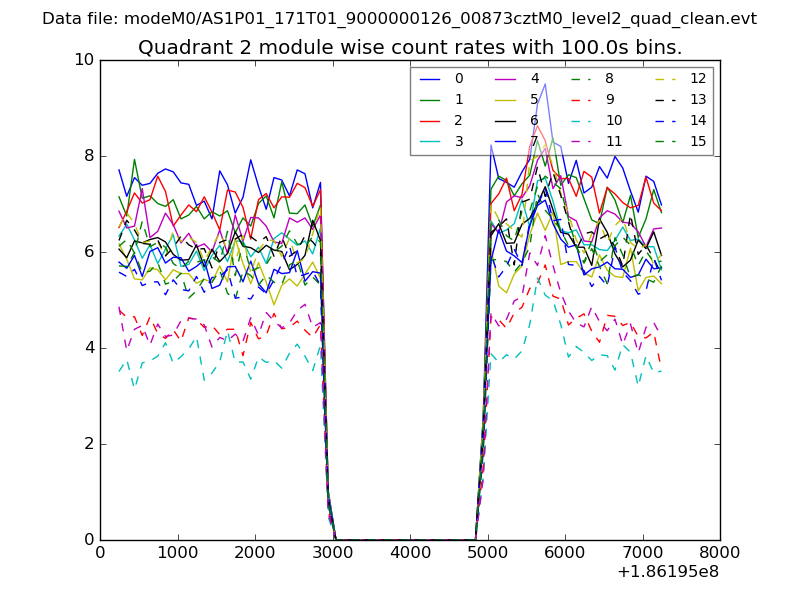
| Module-wise count rates for Quadrant B Data is divided into 100 sec bins |
 |
 |
| Module-wise count rates for Quadrant C Data is divided into 100 sec bins |
 |
 |
| Module-wise count rates for Quadrant D Data is divided into 100 sec bins |
 |
 |
| Parameter | Plot |
|---|---|
| CZT HV Monitor | 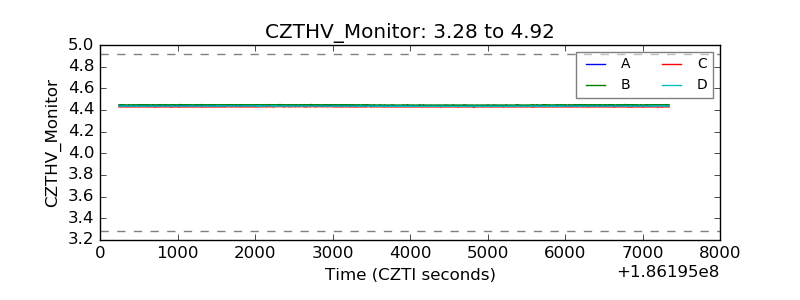 |
| D_VDD | 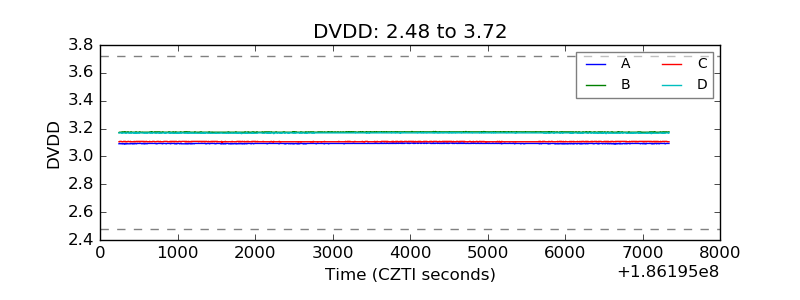 |
| Temperature 1 | 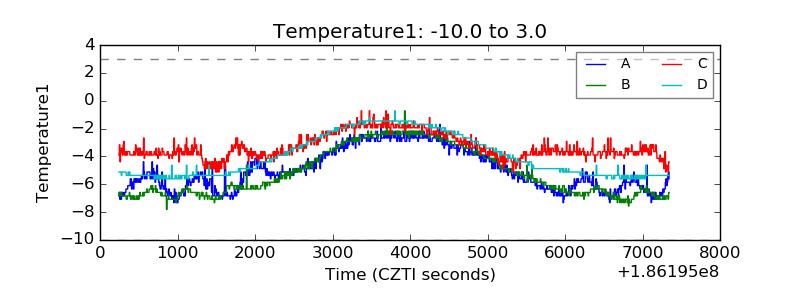 |
| Veto HV Monitor |  |
| Veto LLD | 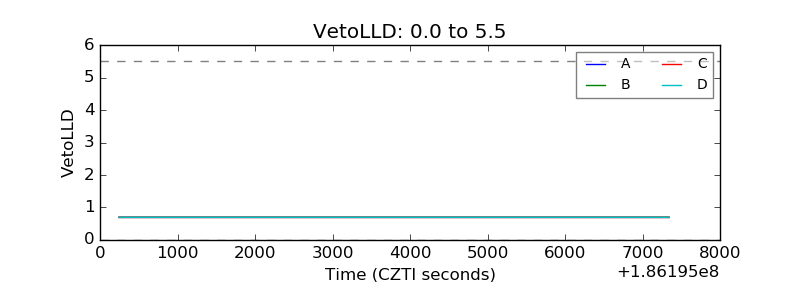 |
| Alpha Counter | 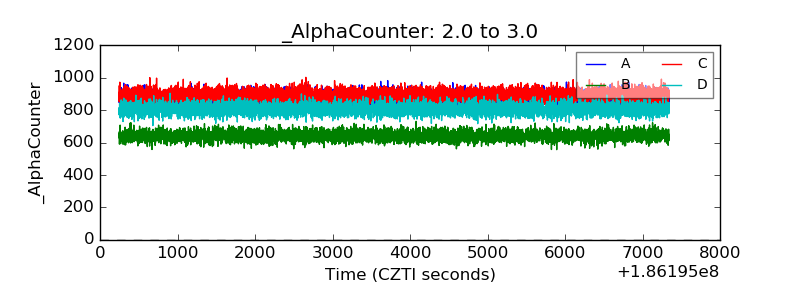 |
| _CPM_Rate | 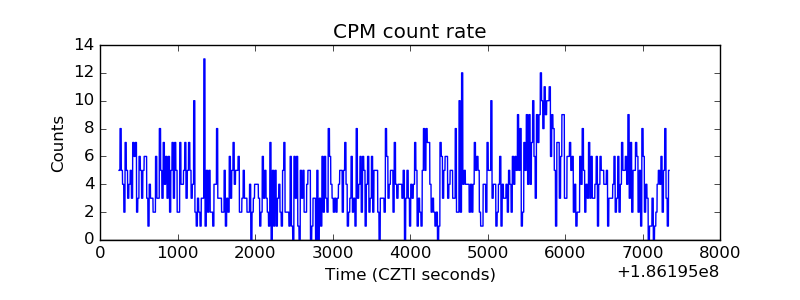 |
| CZT Counter | 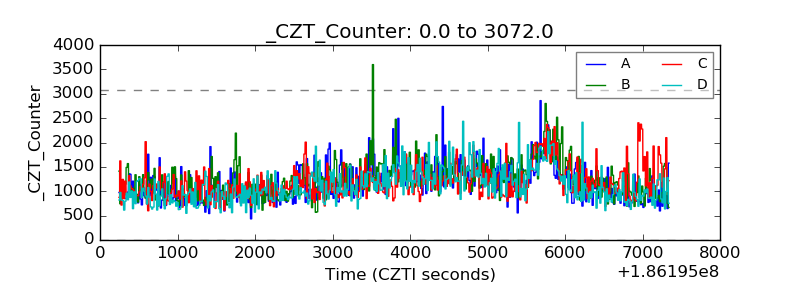 |
| +2.5 Volts monitor |  |
| +5 Volts monitor |  |
| _ROLL_ROT | 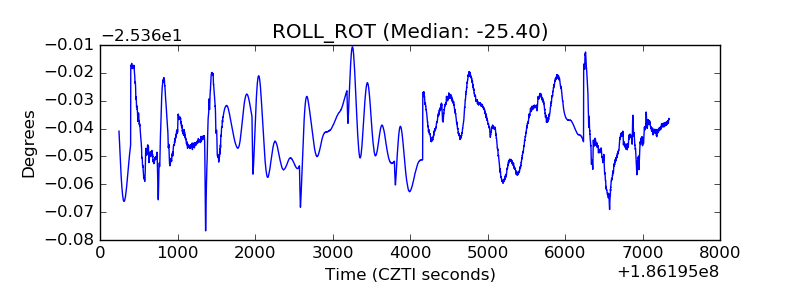 |
| _Roll_DEC | 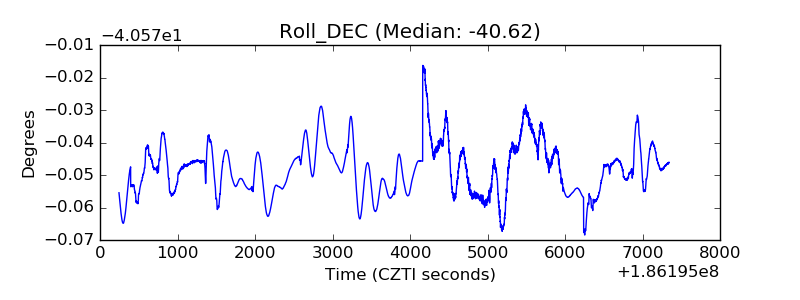 |
| _Roll_RA | 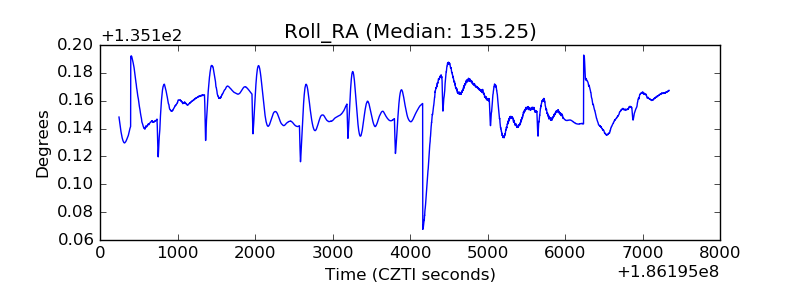 |
| Veto Counter | 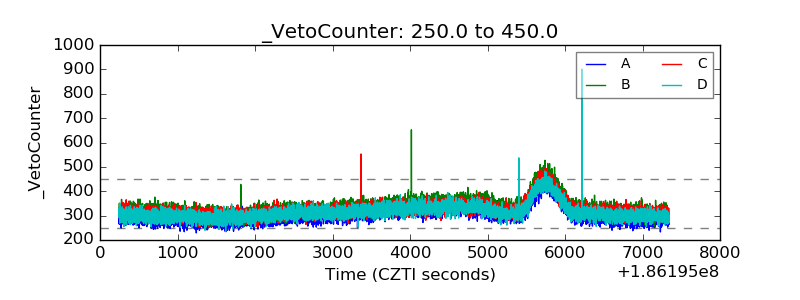 |