| Param | Original file | Final file |
|---|---|---|
| Filename | modeM0/AS1P01_171T01_9000000126_00874cztM0_level2.evt | modeM0/AS1P01_171T01_9000000126_00874cztM0_level2_quad_clean.evt |
| Size (bytes) | 757,339,200 | 44,314,560 |
| Size | 722.3 MB | 42.3 MB |
| Events in quadrant A | 5,494,041 | 254,611 |
| Events in quadrant B | 5,715,398 | 257,256 |
| Events in quadrant C | 6,126,852 | 250,094 |
| Events in quadrant D | 5,285,103 | 247,222 |
| Mode SS | |||
|---|---|---|---|
| Quadrant | BADHDUFLAG | Total packets | Discarded packets |
| A | 0 | 96 | 0 |
| B | 0 | 96 | 0 |
| C | 0 | 96 | 0 |
| D | 0 | 96 | 0 |
| Mode M0 | |||
|---|---|---|---|
| Quadrant | BADHDUFLAG | Total packets | Discarded packets |
| A | 0 | 19669 | 0 |
| B | 0 | 20331 | 0 |
| C | 0 | 21504 | 0 |
| D | 0 | 19073 | 0 |
| Quadrant | Total seconds | Saturated seconds | Saturation percentage |
|---|---|---|---|
| A | 4724 | 0 | 0.000000% |
| B | 4725 | 3 | 0.063492% |
| C | 4725 | 14 | 0.296296% |
| D | 4725 | 1 | 0.021164% |
Noise dominated data is calculated using 1-second bins in cleaned event files. If a bin has >2000 counts, and if more than 50% of those come from <1% of pixels, then it is considered to be noise-dominated and hence unusable.
| Quadrant | # 1 sec bins | Bins with >0 counts | Bins with >2000 counts | High rate bins dominated by noise | Noise dominated (total time) | Noise dominated (detector-on time) | Marked lightcurve |
|---|---|---|---|---|---|---|---|
| A | 4724 | 4724 | 63 | 63 | 1.33% | 1.33% |  |
| B | 4725 | 4725 | 88 | 88 | 1.86% | 1.86% | 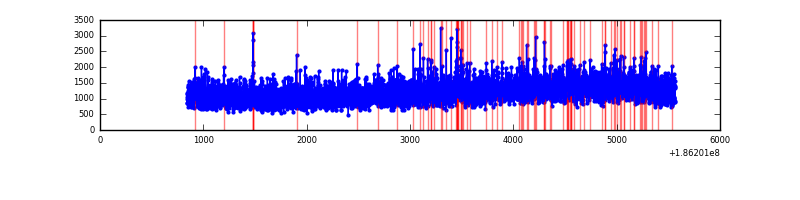 |
| C | 4725 | 4725 | 304 | 304 | 6.43% | 6.43% | 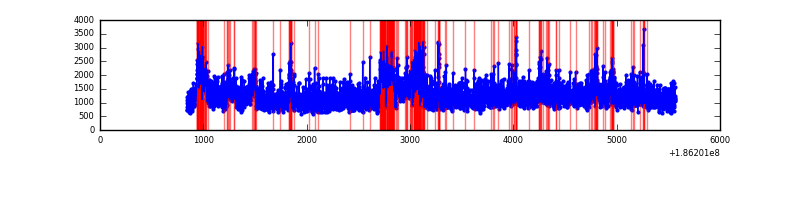 |
| D | 4725 | 4725 | 61 | 61 | 1.29% | 1.29% | 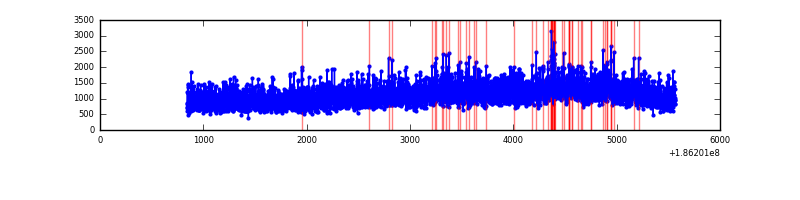 |
Top three noisy pixels from each quadrant. If the there are fewer than three noisy pixels in the level2.evt file, extra rows are filled as -1
| Pixel properties | Quadrant properties | ||||||
|---|---|---|---|---|---|---|---|
| Quadrant | DetID | PixID | Counts | Sigma | Mean | Median | Sigma |
| A | 11 | 79 | 5253 | 10.98 | 1431 | 1442 | 347.1 |
| A | 3 | 111 | 4440 | 8.64 | 1431 | 1442 | 347.1 |
| A | 14 | 203 | 3735 | 6.61 | 1431 | 1442 | 347.1 |
| B | 0 | 220 | 57171 | 159.22 | 1476 | 1487 | 349.7 |
| B | 5 | 249 | 18214 | 47.83 | 1476 | 1487 | 349.7 |
| B | 15 | 85 | 12117 | 30.4 | 1476 | 1487 | 349.7 |
| C | 1 | 192 | 774591 | 2037.01 | 1353 | 1407 | 379.6 |
| C | 3 | 111 | 19673 | 48.12 | 1353 | 1407 | 379.6 |
| C | 9 | 83 | 18045 | 43.83 | 1353 | 1407 | 379.6 |
| D | 1 | 4 | 261384 | 631.04 | 1326 | 1375 | 412.0 |
| D | 13 | 169 | 35573 | 83.0 | 1326 | 1375 | 412.0 |
| D | 2 | 63 | 11403 | 24.34 | 1326 | 1375 | 412.0 |
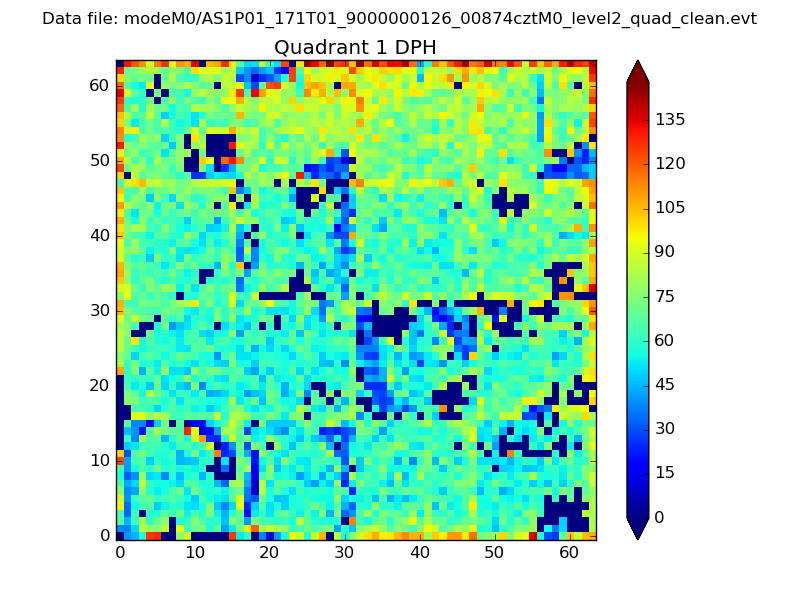
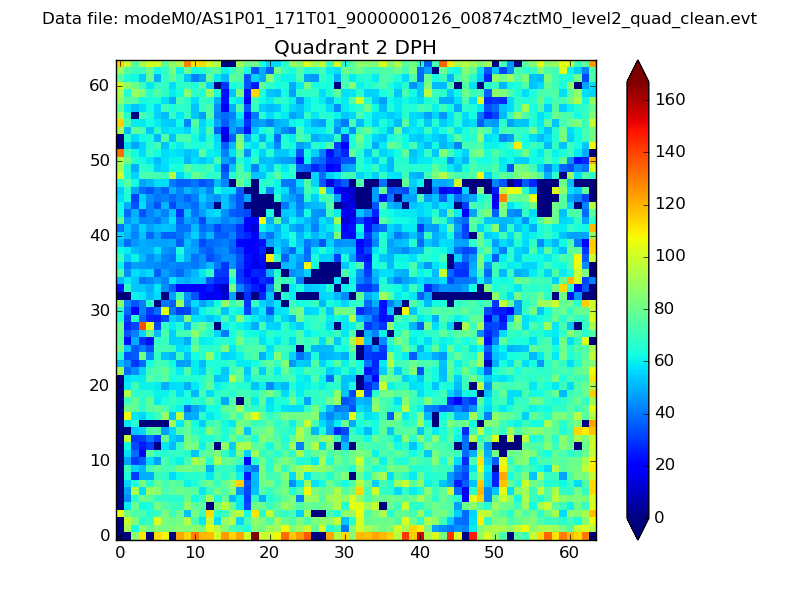
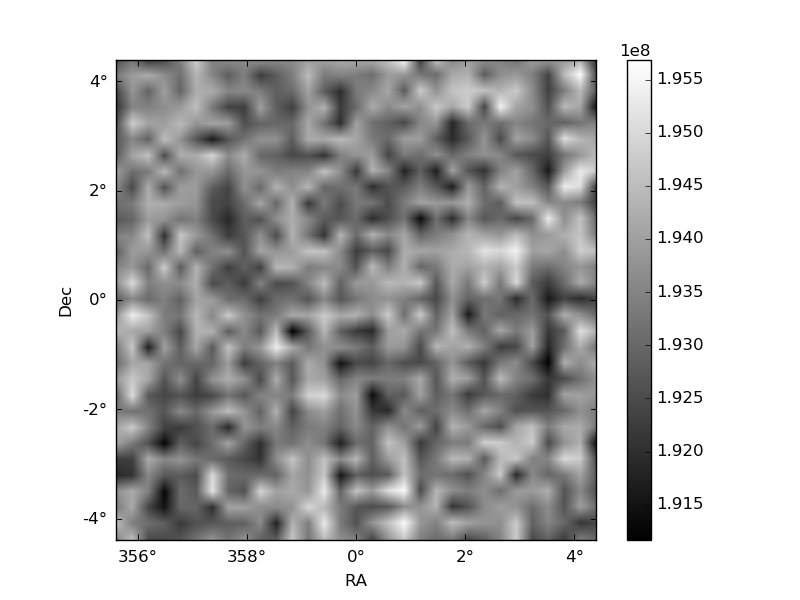
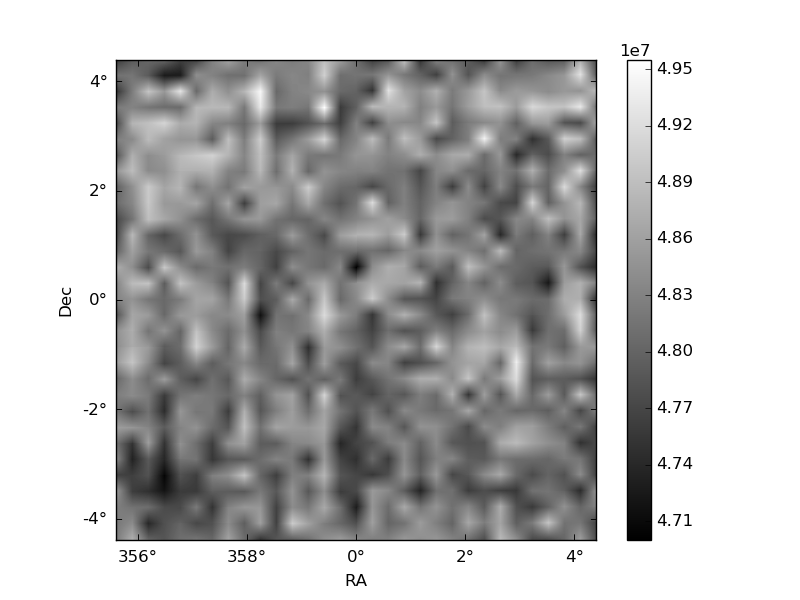
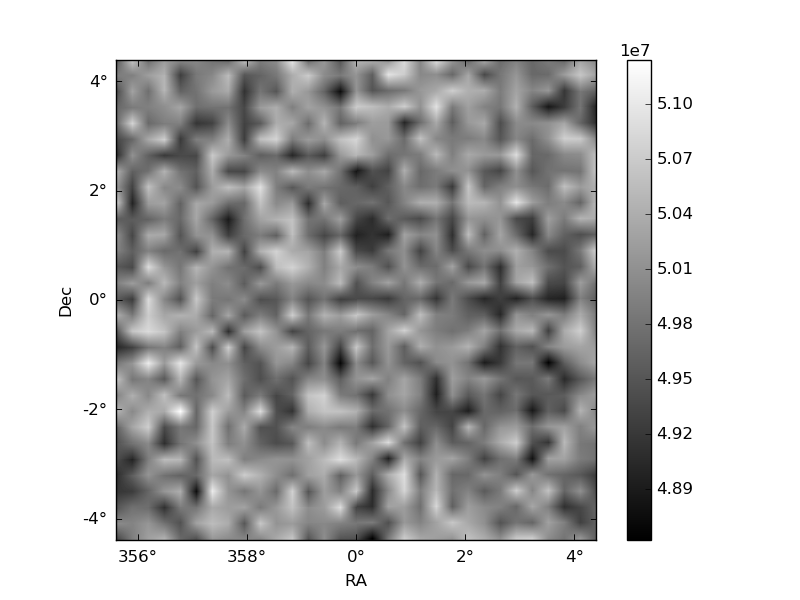
Histogram calculated using DETX and DETY for each event in the final _common_clean file
| Quadrant A | 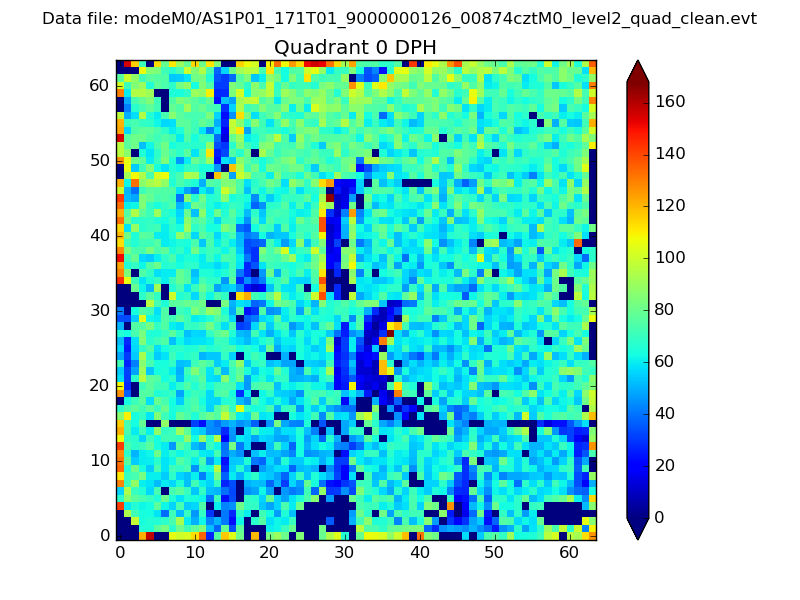 |
 |
Quadrant B |
|---|---|---|---|
| Quadrant D | 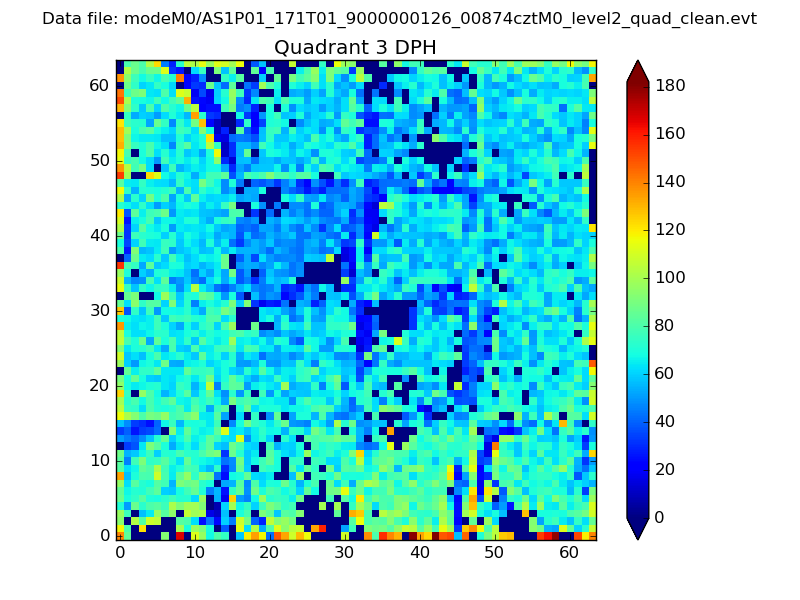 |
 |
Quadrant C |
| Plot type | Count rate plots | Images |
|---|---|---|
| Comparison with Poisson distribution Blue bars denote a histogram of data divided into 1 sec bins. Red curve is a Poisson curve with rate = median count rate of data. |
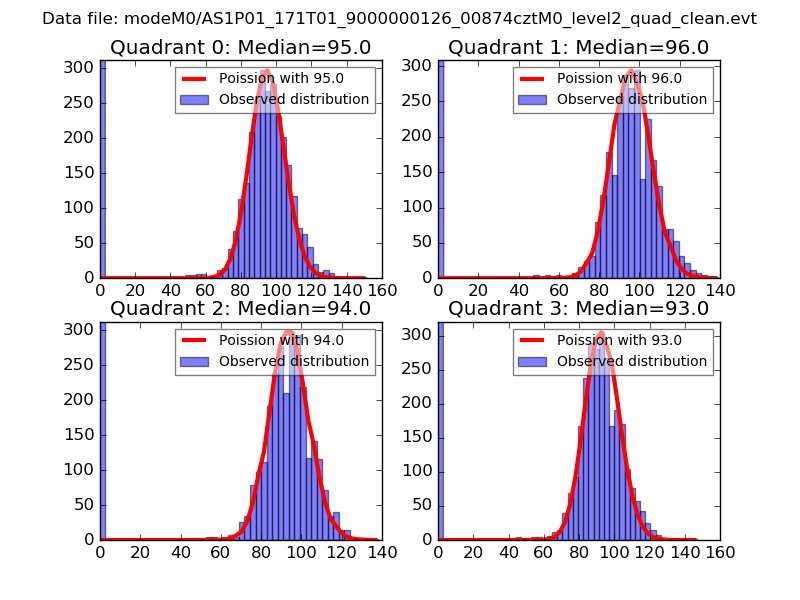 |
 |
| Quadrant-wise count rates Data is divided into 100 sec bins |
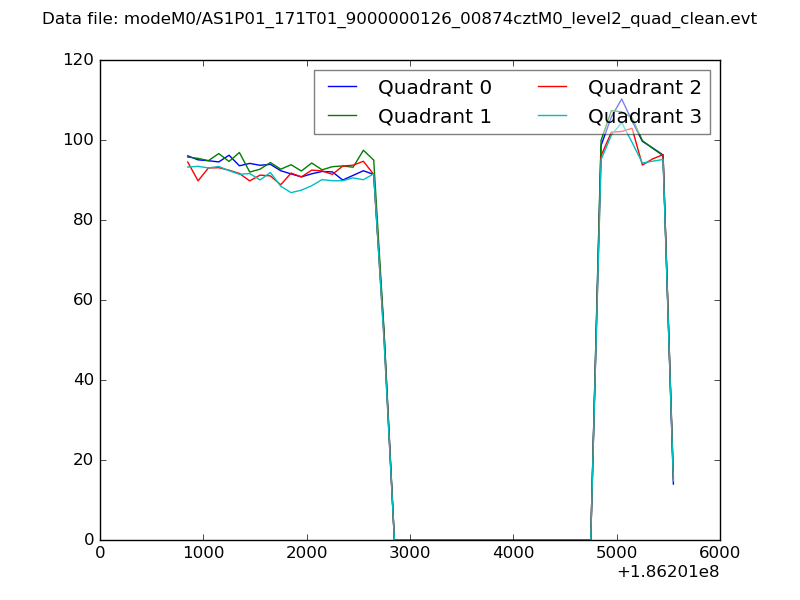 |
|
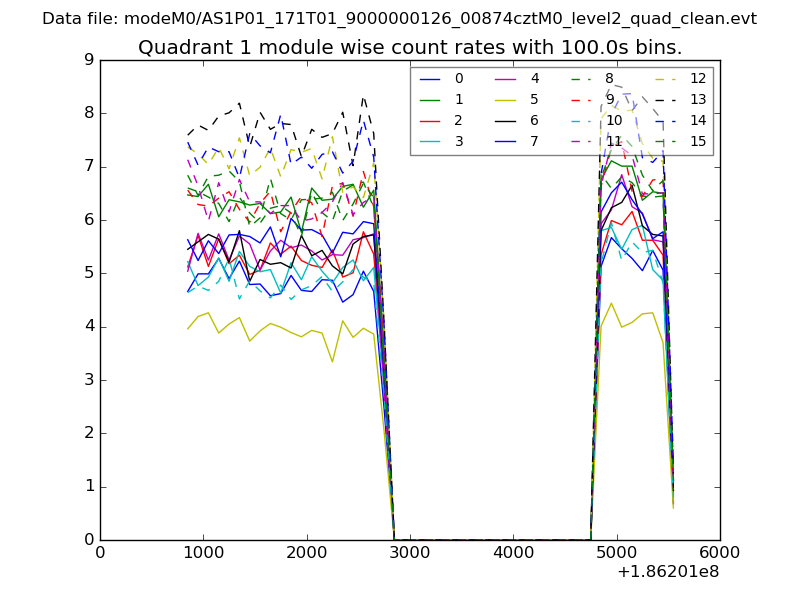
| Module-wise count rates for Quadrant A Data is divided into 100 sec bins |
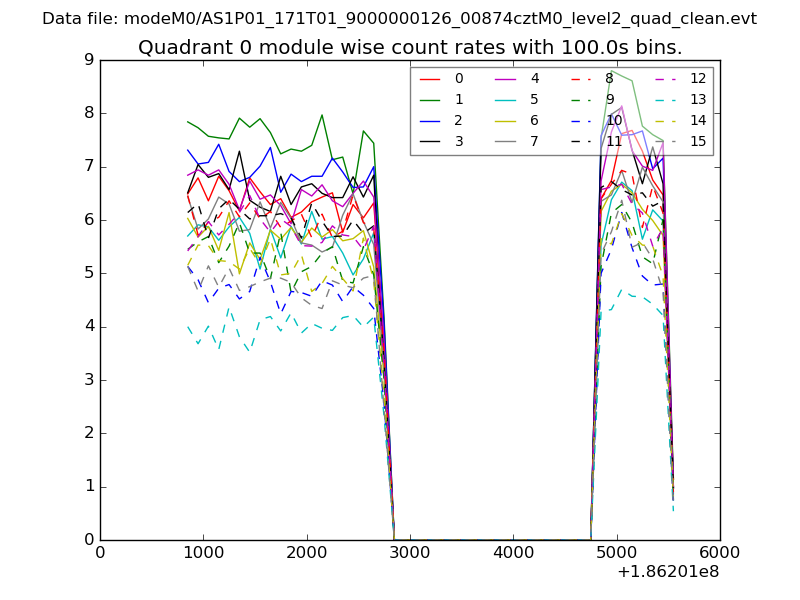 |
 |
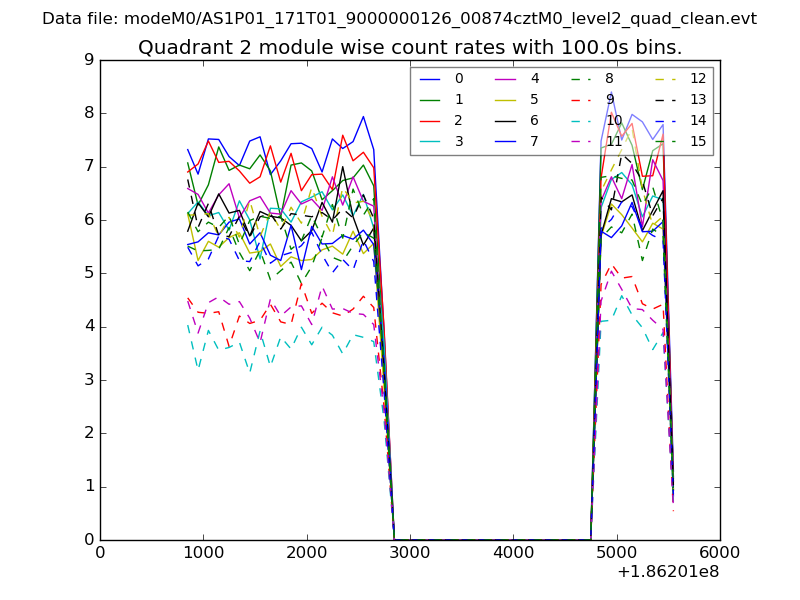
| Module-wise count rates for Quadrant B Data is divided into 100 sec bins |
 |
 |
| Module-wise count rates for Quadrant C Data is divided into 100 sec bins |
 |
 |
| Module-wise count rates for Quadrant D Data is divided into 100 sec bins |
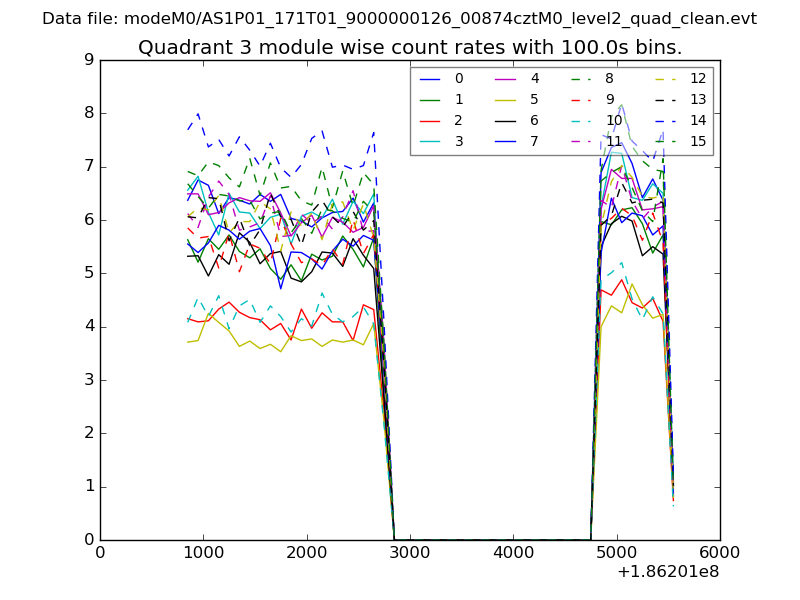 |
 |
| Parameter | Plot |
|---|---|
| CZT HV Monitor | 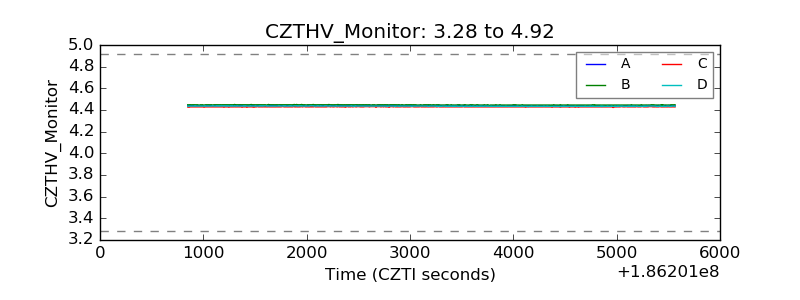 |
| D_VDD |  |
| Temperature 1 | 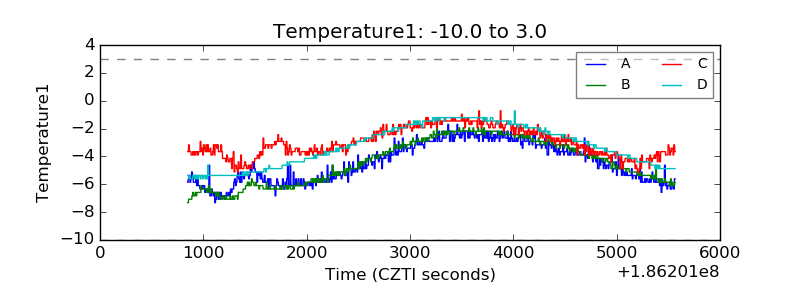 |
| Veto HV Monitor |  |
| Veto LLD | 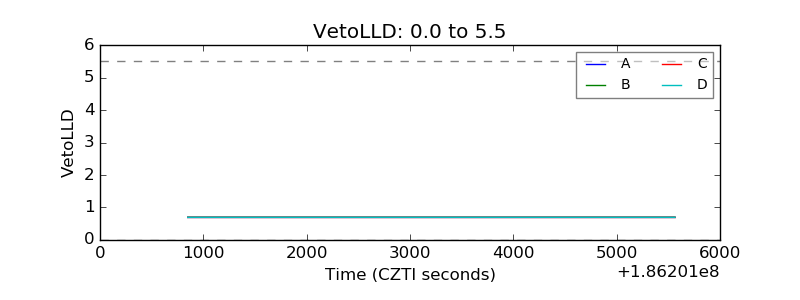 |
| Alpha Counter |  |
| _CPM_Rate |  |
| CZT Counter | 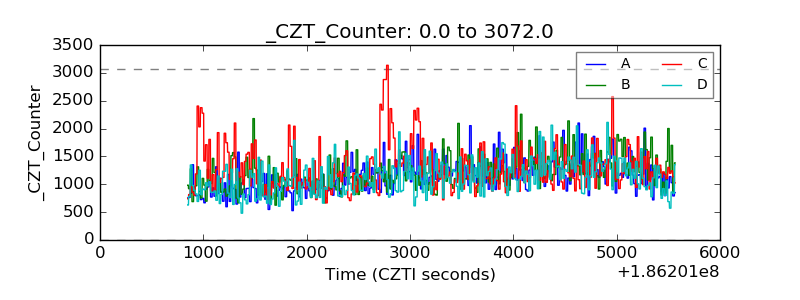 |
| +2.5 Volts monitor |  |
| +5 Volts monitor |  |
| _ROLL_ROT | 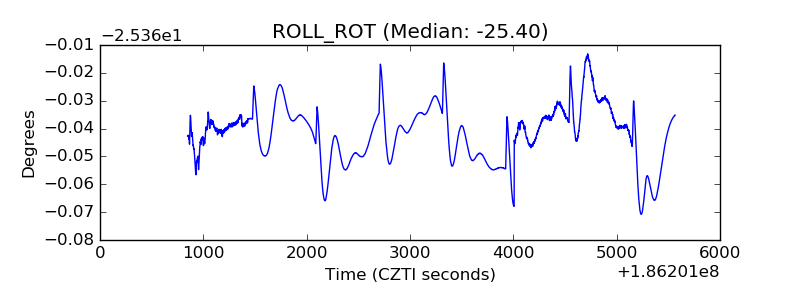 |
| _Roll_DEC | 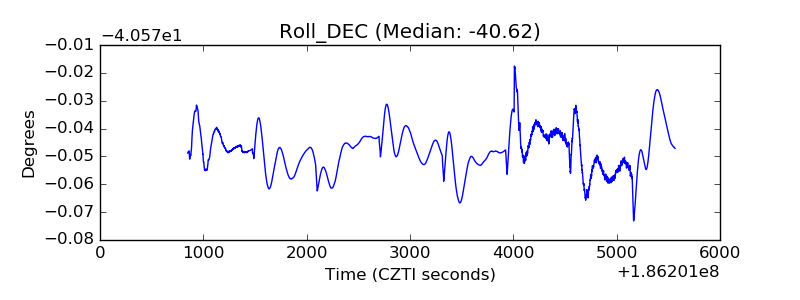 |
| _Roll_RA | 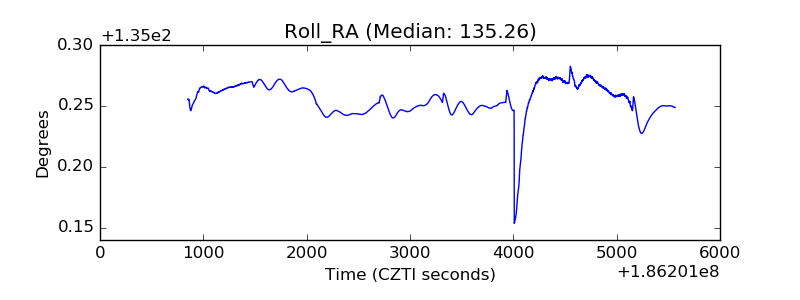 |
| Veto Counter | 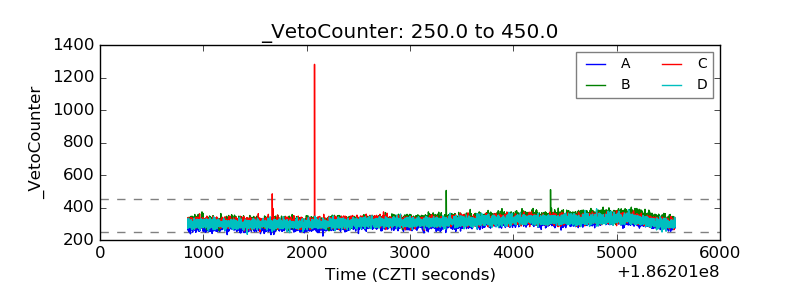 |