| Param | Original file | Final file |
|---|---|---|
| Filename | modeM0/AS1P01_889T01_9000000130cztM0_level2.fits | modeM0/AS1P01_889T01_9000000130cztM0_level2_quad_clean.evt |
| Size (bytes) | 15,477,120 | 11,266,560 |
| Size | 14.8 MB | 10.7 MB |
| Events in quadrant A | 94,718 | 61,751 |
| Events in quadrant B | 92,448 | 62,225 |
| Events in quadrant C | 52,702 | 13,393 |
| Events in quadrant D | 80,300 | 54,776 |
| Mode M0 | |||
|---|---|---|---|
| Quadrant | BADHDUFLAG | Total packets | Discarded packets |
| A | 0 | 8183 | 0 |
| B | 0 | 8568 | 0 |
| C | 0 | 16614 | 0 |
| D | 0 | 7607 | 0 |
| Mode SS | |||
|---|---|---|---|
| Quadrant | BADHDUFLAG | Total packets | Discarded packets |
| A | 0 | 40 | 0 |
| B | 0 | 40 | 0 |
| C | 0 | 40 | 0 |
| D | 0 | 40 | 0 |
| Quadrant | Total seconds | Saturated seconds | Saturation percentage |
|---|---|---|---|
| A | 2041 | 0 | 0.000000% |
| B | 2041 | 2 | 0.097991% |
| C | 2041 | 1345 | 65.899069% |
| D | 2041 | 2 | 0.097991% |
Noise dominated data is calculated using 1-second bins in cleaned event files. If a bin has >2000 counts, and if more than 50% of those come from <1% of pixels, then it is considered to be noise-dominated and hence unusable.
| Quadrant | # 1 sec bins | Bins with >0 counts | Bins with >2000 counts | High rate bins dominated by noise | Noise dominated (total time) | Noise dominated (detector-on time) | Marked lightcurve |
|---|---|---|---|---|---|---|---|
| A | 2041 | 2041 | 0 | 0 | 0.00% | 0.00% |  |
| B | 2041 | 2041 | 0 | 0 | 0.00% | 0.00% |  |
| C | 2040 | 2038 | 0 | 0 | 0.00% | 0.00% |  |
| D | 2041 | 2041 | 0 | 0 | 0.00% | 0.00% |  |
Top three noisy pixels from each quadrant. If the there are fewer than three noisy pixels in the level2.evt file, extra rows are filled as -1
| Pixel properties | Quadrant properties | ||||||
|---|---|---|---|---|---|---|---|
| Quadrant | DetID | PixID | Counts | Sigma | Mean | Median | Sigma |
| A | 7 | 110 | 89 | 8.41 | 24 | 23 | 7.9 |
| A | 0 | 29 | 84 | 7.77 | 24 | 23 | 7.9 |
| A | 15 | 47 | 76 | 6.75 | 24 | 23 | 7.9 |
| B | 2 | 9 | 69 | 6.84 | 24 | 23 | 6.7 |
| B | 10 | 225 | 65 | 6.25 | 24 | 23 | 6.7 |
| B | 3 | 17 | 64 | 6.1 | 24 | 23 | 6.7 |
| C | 12 | 249 | 40 | 5.37 | 13 | 13 | 5.0 |
| C | 3 | 202 | 40 | 5.37 | 13 | 13 | 5.0 |
| C | 12 | 241 | 39 | 5.17 | 13 | 13 | 5.0 |
| D | 6 | 114 | 65 | 6.04 | 22 | 21 | 7.3 |
| D | 6 | 232 | 63 | 5.77 | 22 | 21 | 7.3 |
| D | 3 | 30 | 63 | 5.77 | 22 | 21 | 7.3 |
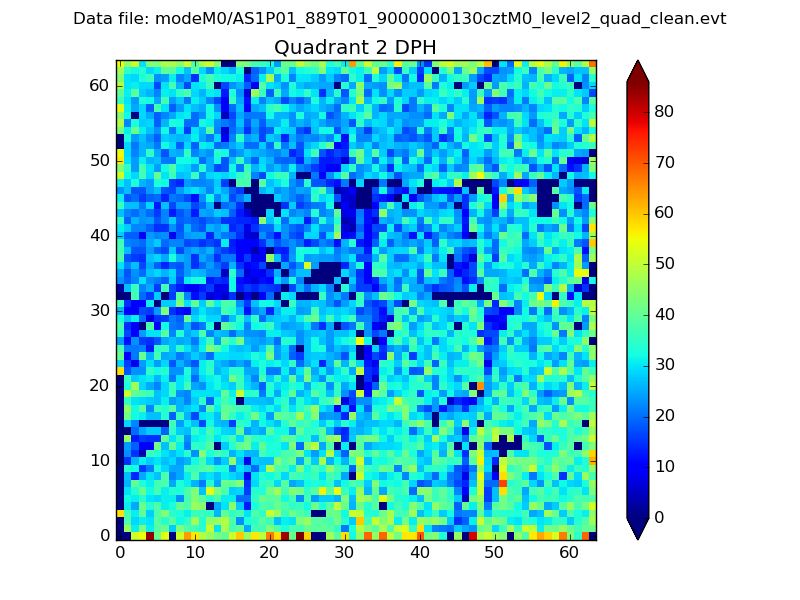
Histogram calculated using DETX and DETY for each event in the final _common_clean file
| Quadrant A |  |
 |
Quadrant B |
|---|---|---|---|
| Quadrant D | 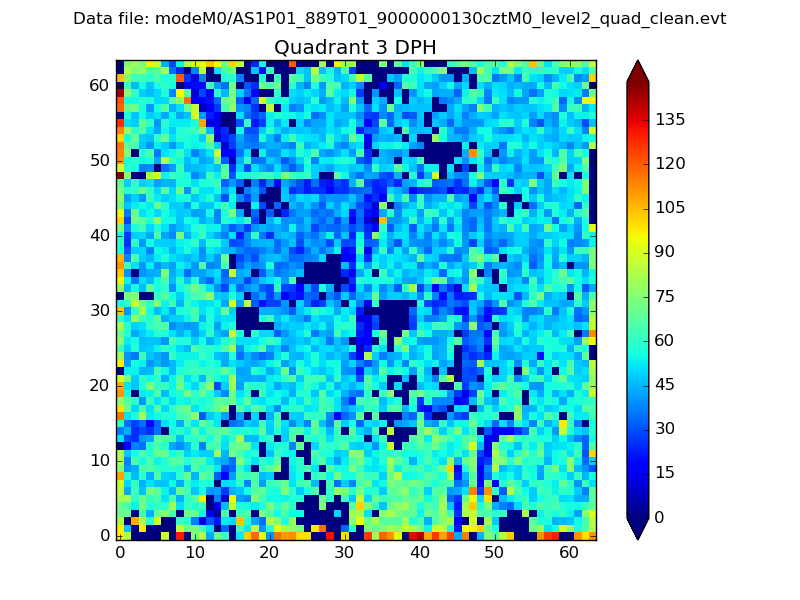 |
 |
Quadrant C |
| Plot type | Count rate plots | Images |
|---|---|---|
| Comparison with Poisson distribution Blue bars denote a histogram of data divided into 1 sec bins. Red curve is a Poisson curve with rate = median count rate of data. |
 |
 |
| Quadrant-wise count rates Data is divided into 100 sec bins |
 |
|
| Module-wise count rates for Quadrant A Data is divided into 100 sec bins |
 |
 |
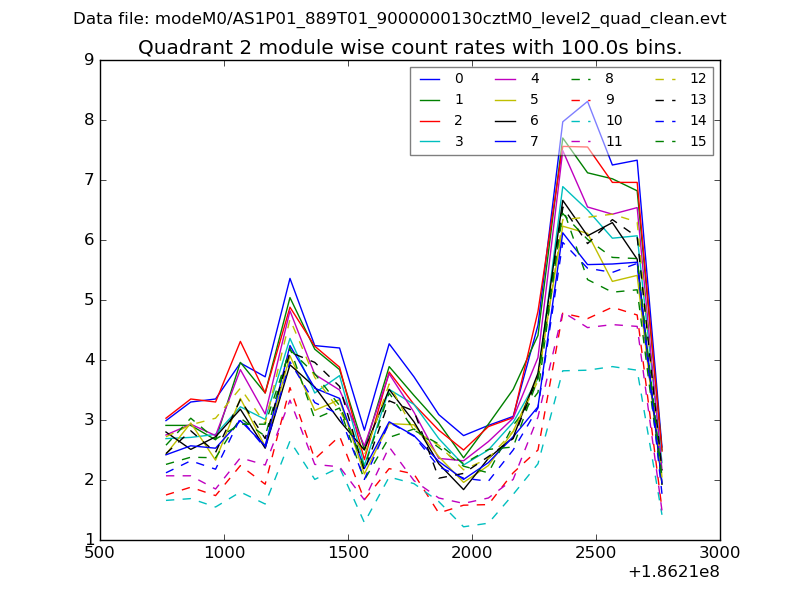
| Module-wise count rates for Quadrant B Data is divided into 100 sec bins |
 |
 |
| Module-wise count rates for Quadrant C Data is divided into 100 sec bins |
 |
 |
| Module-wise count rates for Quadrant D Data is divided into 100 sec bins |
 |
 |
| Parameter | Plot |
|---|---|
| CZT HV Monitor |  |
| D_VDD |  |
| Temperature 1 |  |
| Veto HV Monitor |  |
| Veto LLD |  |
| Alpha Counter |  |
| _CPM_Rate |  |
| CZT Counter | 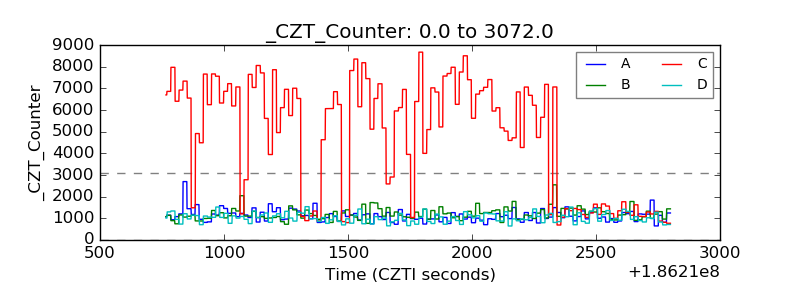 |
| +2.5 Volts monitor |  |
| +5 Volts monitor |  |
| _ROLL_ROT |  |
| _Roll_DEC | 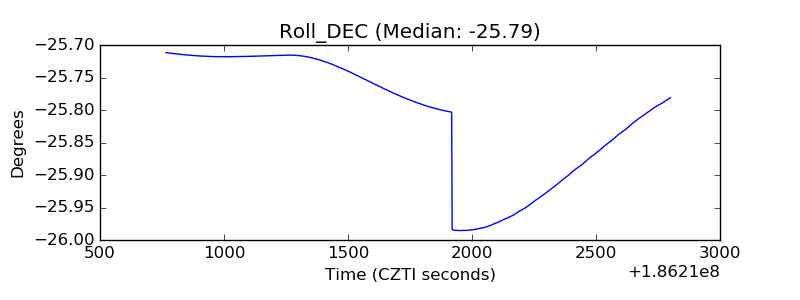 |
| _Roll_RA |  |
| Veto Counter | 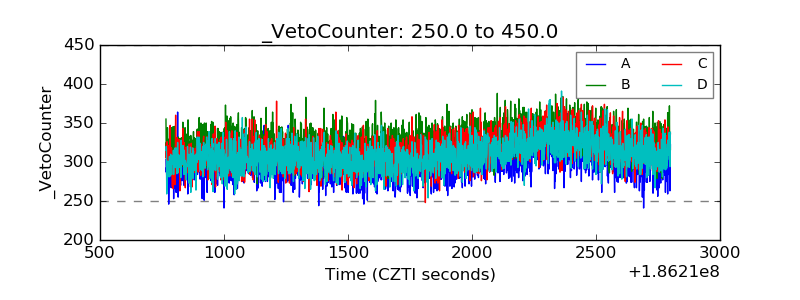 |