| Param | Original file | Final file |
|---|---|---|
| Filename | modeM0/AS1P01_889T01_9000000130_00875cztM0_level2.evt | modeM0/AS1P01_889T01_9000000130_00875cztM0_level2_quad_clean.evt |
| Size (bytes) | 392,935,680 | 28,388,160 |
| Size | 374.7 MB | 27.1 MB |
| Events in quadrant A | 2,273,258 | 201,246 |
| Events in quadrant B | 2,390,609 | 199,555 |
| Events in quadrant C | 5,031,375 | 114,676 |
| Events in quadrant D | 2,066,920 | 195,124 |
| Mode M0 | |||
|---|---|---|---|
| Quadrant | BADHDUFLAG | Total packets | Discarded packets |
| A | 0 | 8183 | 0 |
| B | 0 | 8568 | 0 |
| C | 0 | 16614 | 0 |
| D | 0 | 7607 | 0 |
| Mode SS | |||
|---|---|---|---|
| Quadrant | BADHDUFLAG | Total packets | Discarded packets |
| A | 0 | 40 | 0 |
| B | 0 | 40 | 0 |
| C | 0 | 40 | 0 |
| D | 0 | 40 | 0 |
| Quadrant | Total seconds | Saturated seconds | Saturation percentage |
|---|---|---|---|
| A | 2041 | 0 | 0.000000% |
| B | 2041 | 2 | 0.097991% |
| C | 2041 | 1345 | 65.899069% |
| D | 2041 | 2 | 0.097991% |
Noise dominated data is calculated using 1-second bins in cleaned event files. If a bin has >2000 counts, and if more than 50% of those come from <1% of pixels, then it is considered to be noise-dominated and hence unusable.
| Quadrant | # 1 sec bins | Bins with >0 counts | Bins with >2000 counts | High rate bins dominated by noise | Noise dominated (total time) | Noise dominated (detector-on time) | Marked lightcurve |
|---|---|---|---|---|---|---|---|
| A | 2041 | 2041 | 13 | 13 | 0.64% | 0.64% | 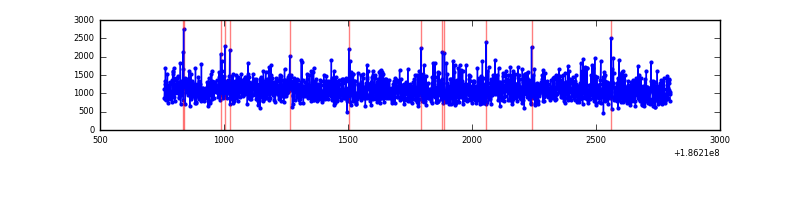 |
| B | 2041 | 2041 | 20 | 20 | 0.98% | 0.98% | 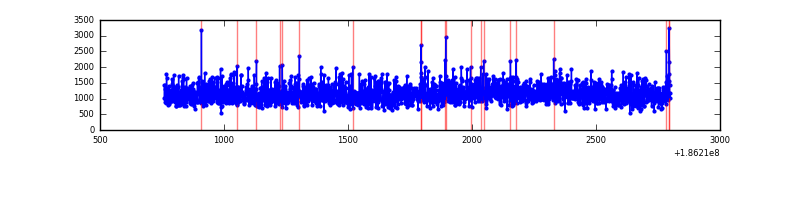 |
| C | 2041 | 2041 | 1379 | 1379 | 67.56% | 67.56% | 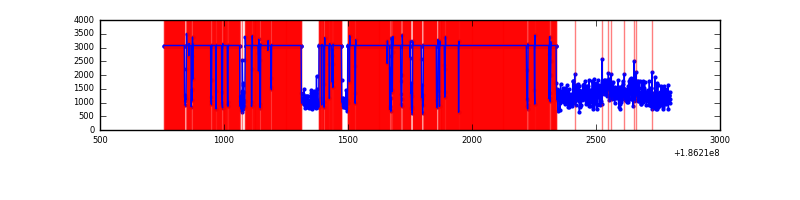 |
| D | 2041 | 2041 | 9 | 9 | 0.44% | 0.44% | 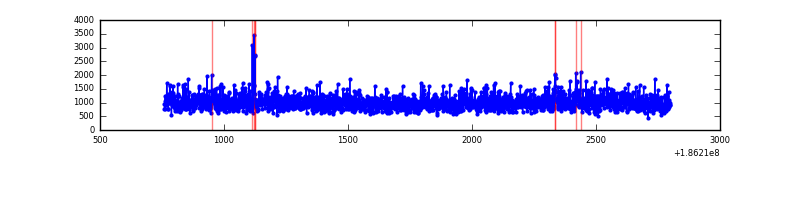 |
Top three noisy pixels from each quadrant. If the there are fewer than three noisy pixels in the level2.evt file, extra rows are filled as -1
| Pixel properties | Quadrant properties | ||||||
|---|---|---|---|---|---|---|---|
| Quadrant | DetID | PixID | Counts | Sigma | Mean | Median | Sigma |
| A | 10 | 133 | 3091 | 17.36 | 592 | 599 | 143.5 |
| A | 11 | 79 | 2831 | 15.55 | 592 | 599 | 143.5 |
| A | 3 | 111 | 1713 | 7.76 | 592 | 599 | 143.5 |
| B | 0 | 245 | 10380 | 65.72 | 621 | 624 | 148.4 |
| B | 5 | 249 | 6910 | 42.35 | 621 | 624 | 148.4 |
| B | 7 | 221 | 5095 | 30.12 | 621 | 624 | 148.4 |
| C | 9 | 83 | 3567723 | 34639.56 | 362 | 375 | 103.0 |
| C | 1 | 192 | 33017 | 316.96 | 362 | 375 | 103.0 |
| C | 3 | 111 | 6193 | 56.49 | 362 | 375 | 103.0 |
| D | 1 | 4 | 66591 | 396.76 | 523 | 542 | 166.5 |
| D | 2 | 16 | 11787 | 67.55 | 523 | 542 | 166.5 |
| D | 2 | 63 | 7118 | 39.5 | 523 | 542 | 166.5 |
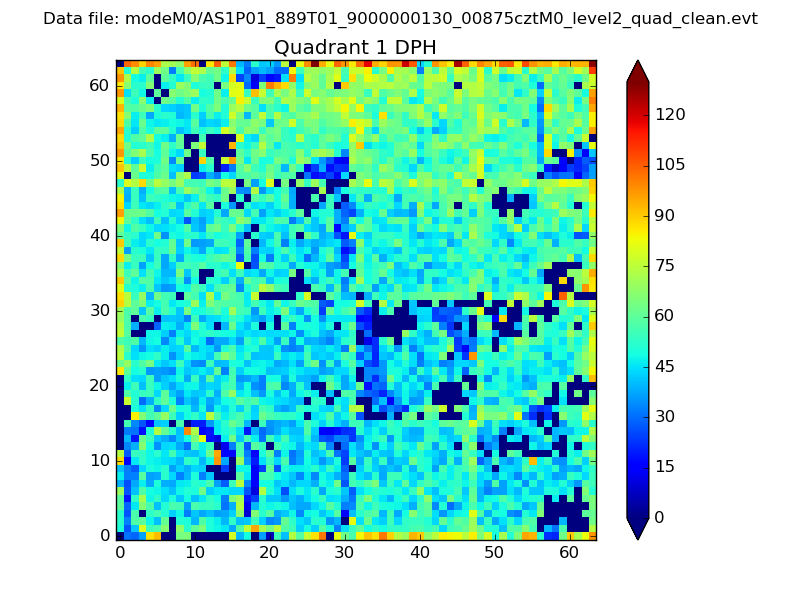
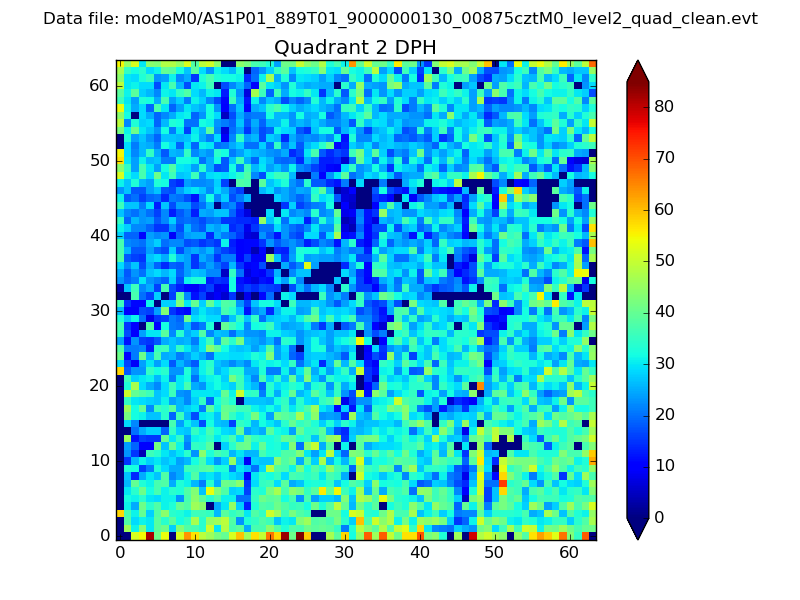
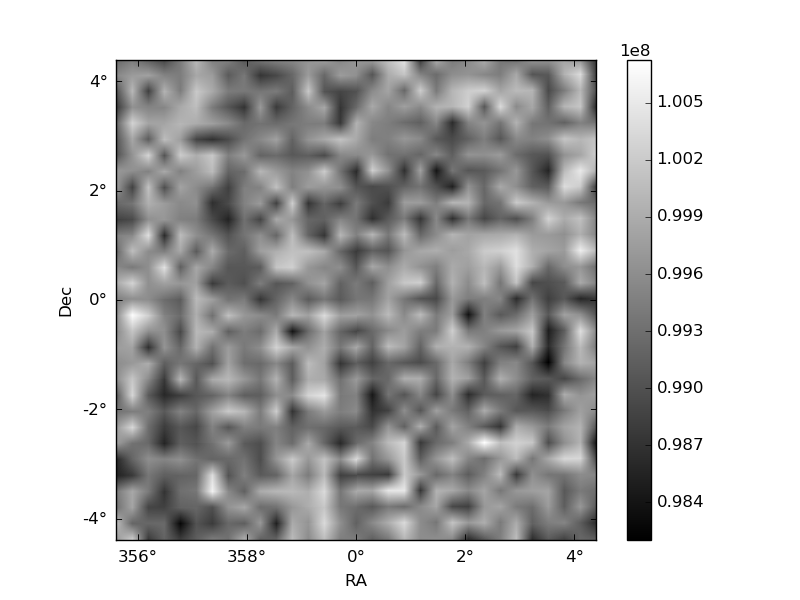
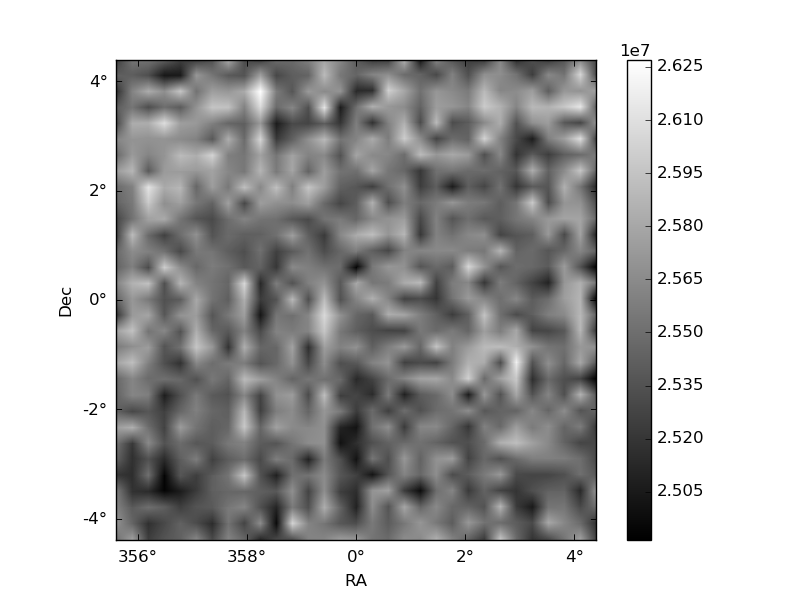
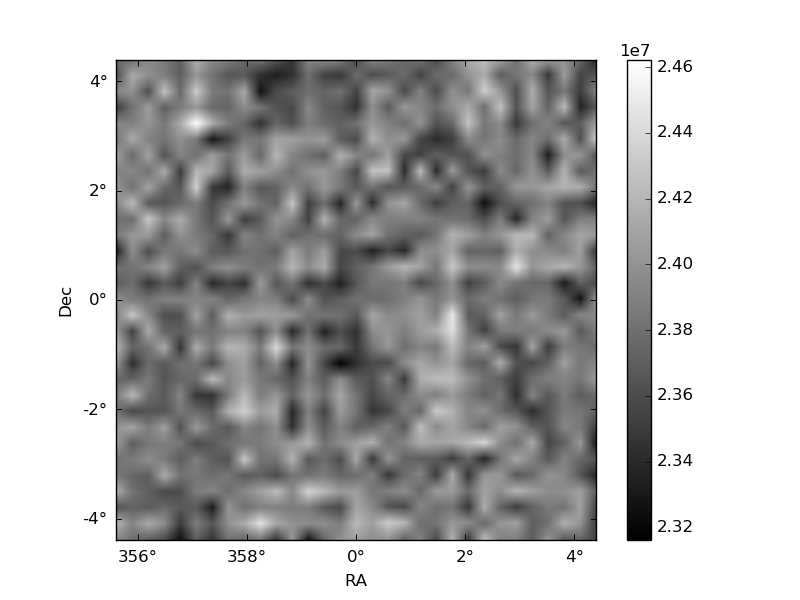
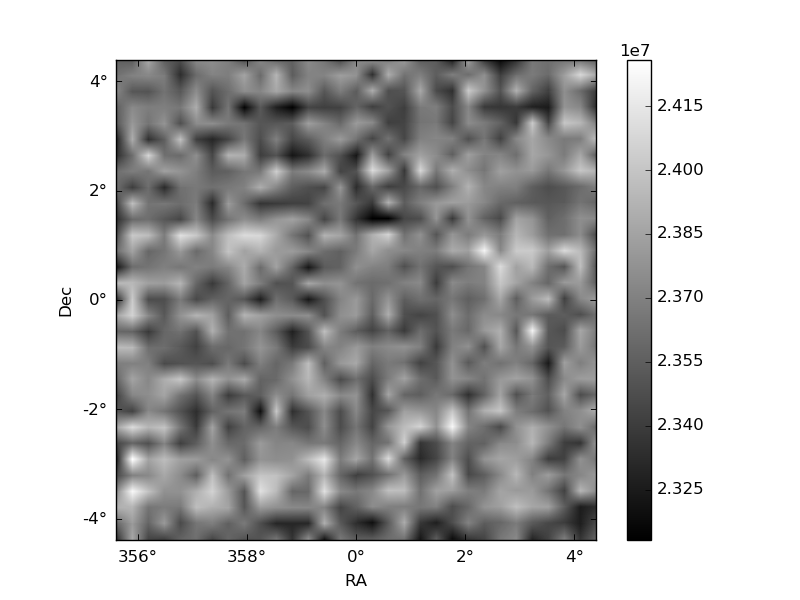
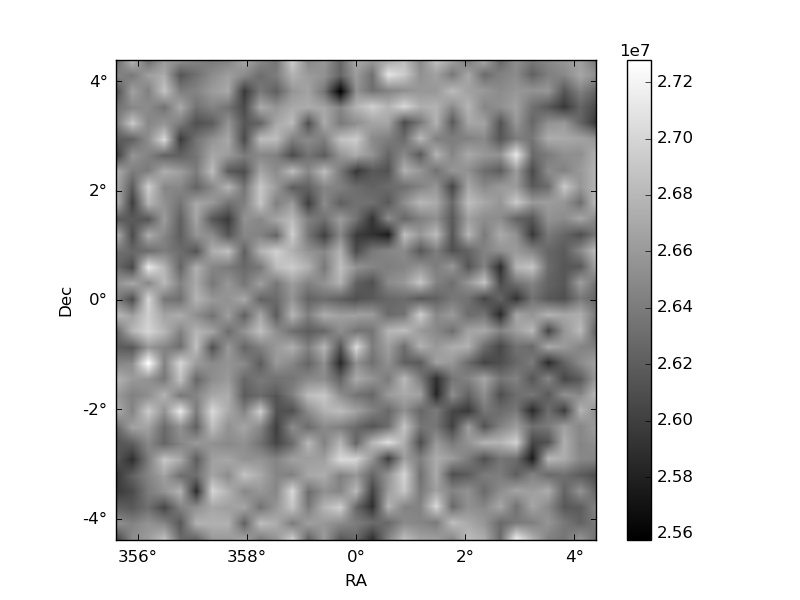
Histogram calculated using DETX and DETY for each event in the final _common_clean file
| Quadrant A |  |
 |
Quadrant B |
|---|---|---|---|
| Quadrant D | 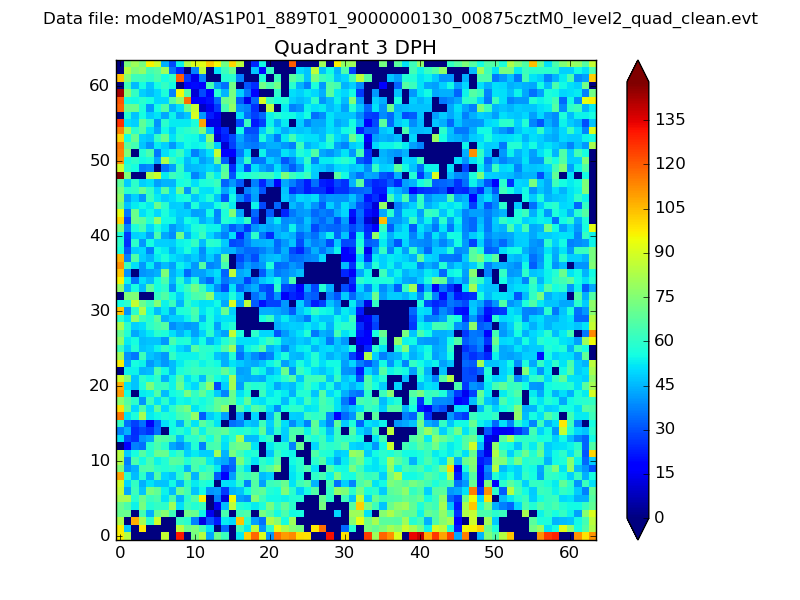 |
 |
Quadrant C |
| Plot type | Count rate plots | Images |
|---|---|---|
| Comparison with Poisson distribution Blue bars denote a histogram of data divided into 1 sec bins. Red curve is a Poisson curve with rate = median count rate of data. |
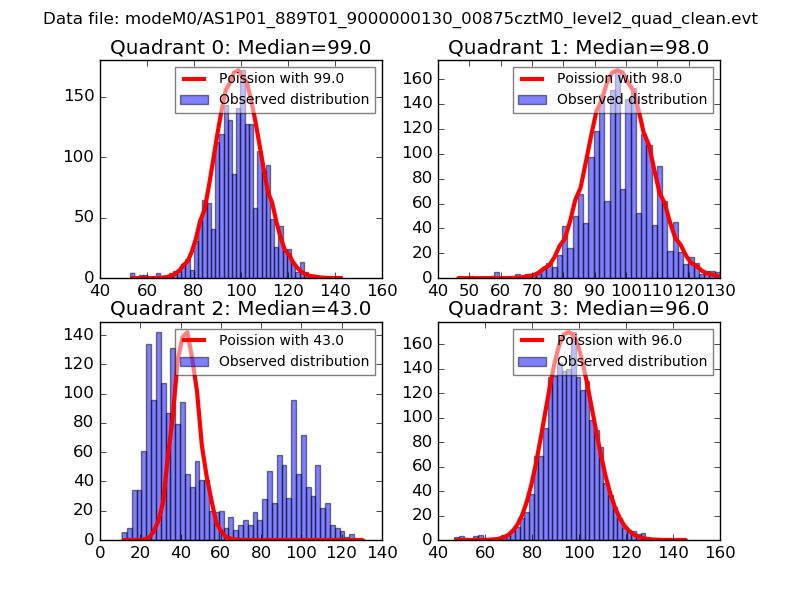 |
 |
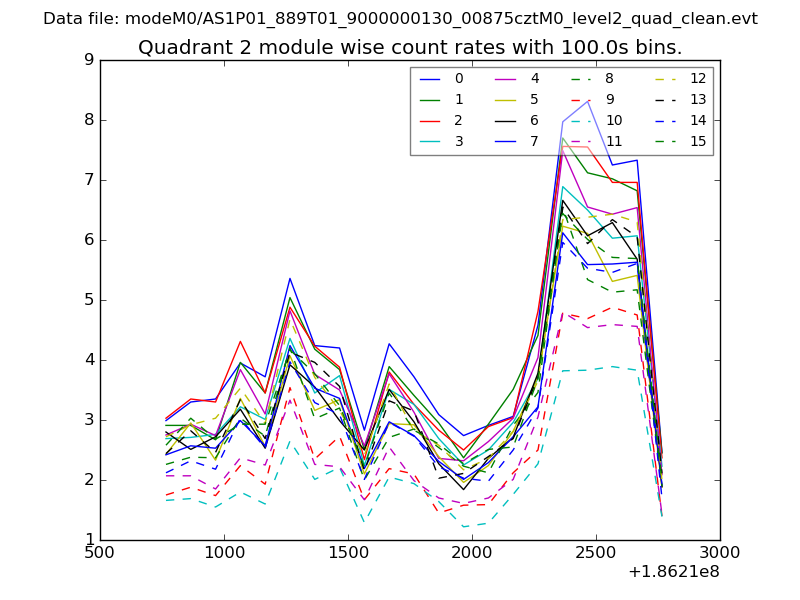
| Quadrant-wise count rates Data is divided into 100 sec bins |
 |
|
| Module-wise count rates for Quadrant A Data is divided into 100 sec bins |
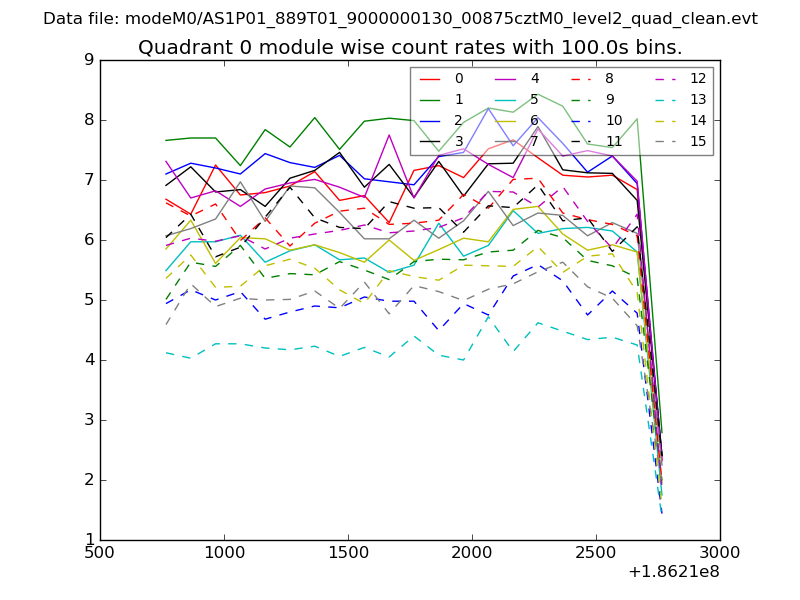 |
 |
| Module-wise count rates for Quadrant B Data is divided into 100 sec bins |
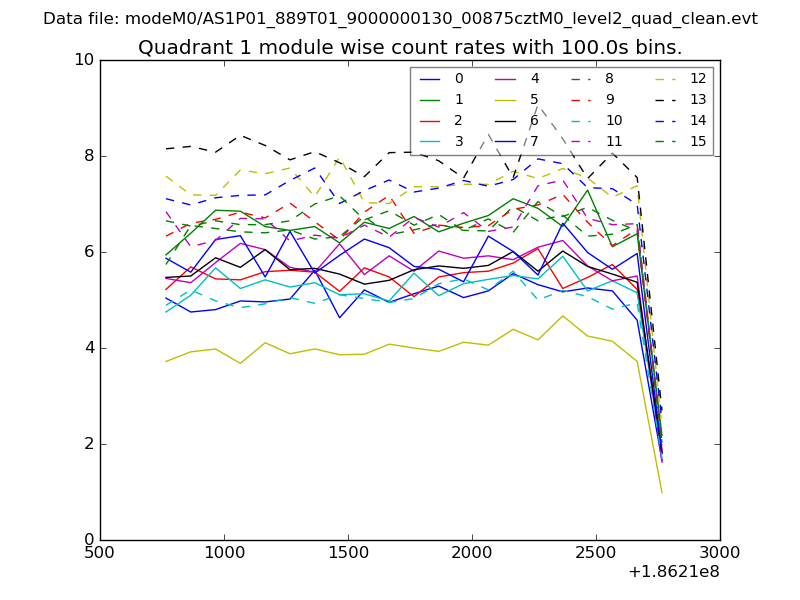 |
 |
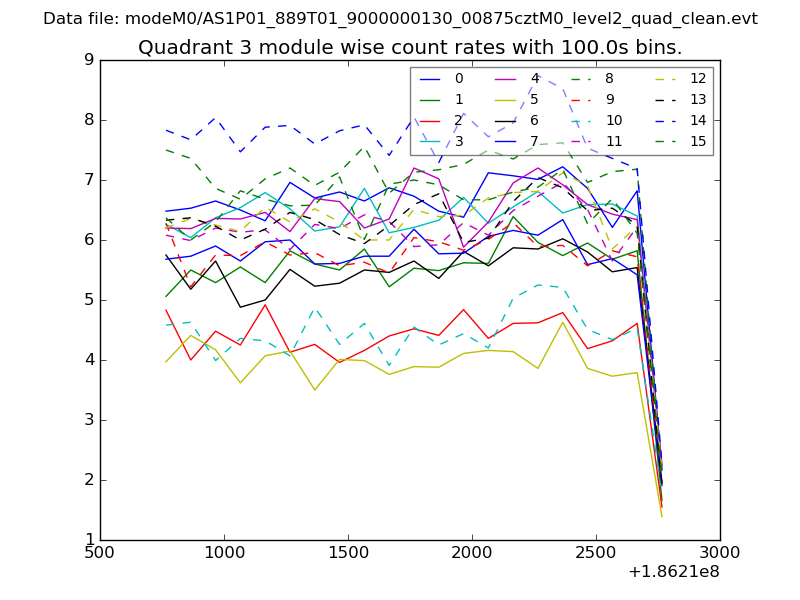
| Module-wise count rates for Quadrant C Data is divided into 100 sec bins |
 |
 |
| Module-wise count rates for Quadrant D Data is divided into 100 sec bins |
 |
 |
| Parameter | Plot |
|---|---|
| CZT HV Monitor | 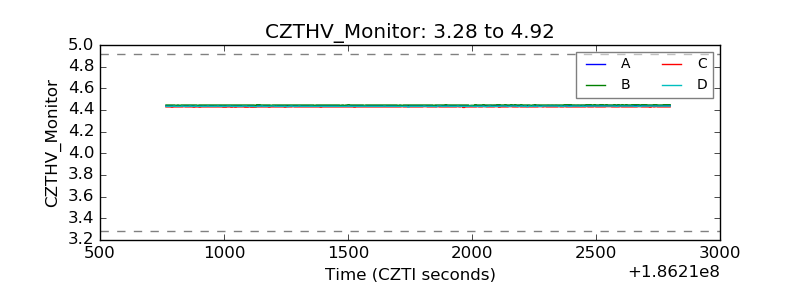 |
| D_VDD | 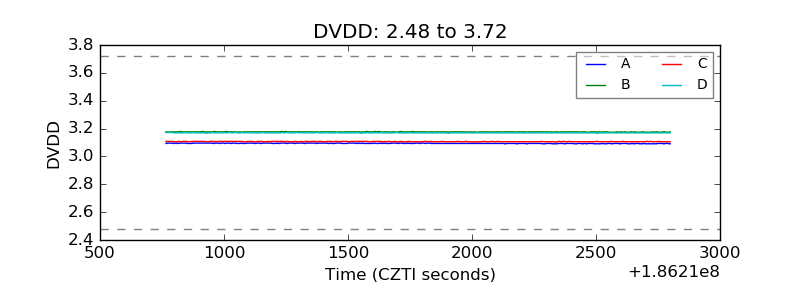 |
| Temperature 1 | 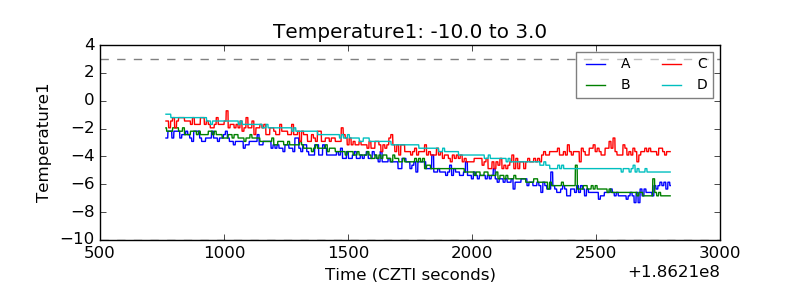 |
| Veto HV Monitor | 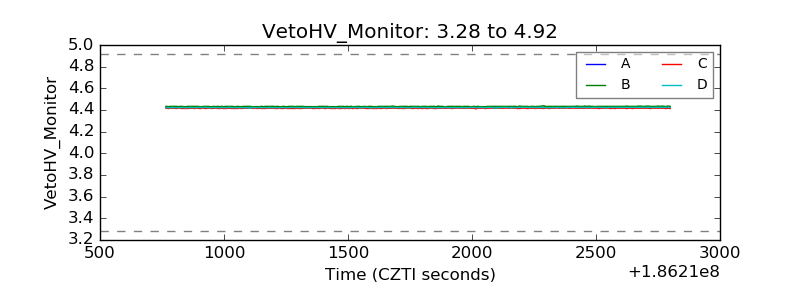 |
| Veto LLD | 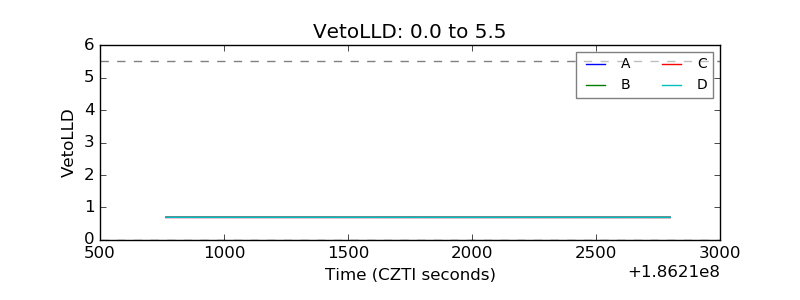 |
| Alpha Counter | 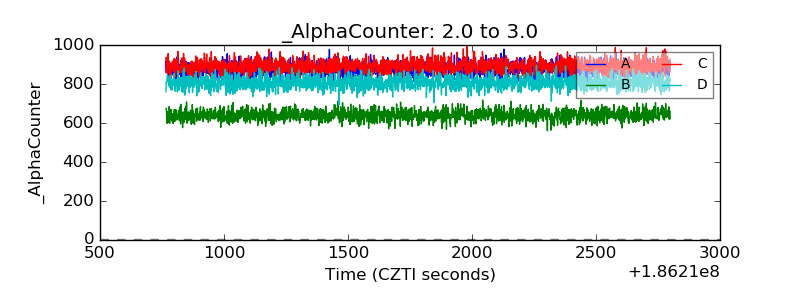 |
| _CPM_Rate | 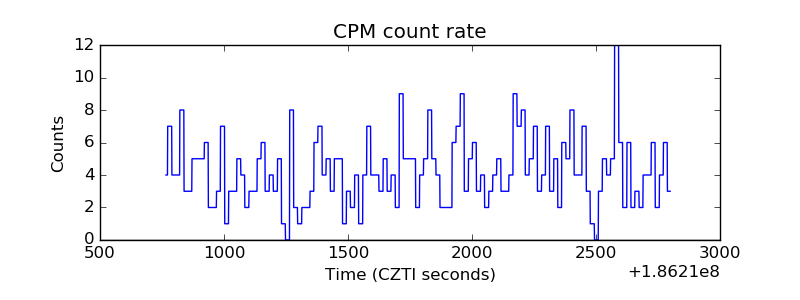 |
| CZT Counter | 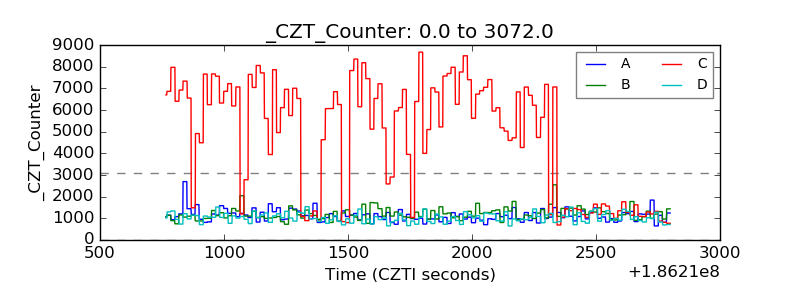 |
| +2.5 Volts monitor | 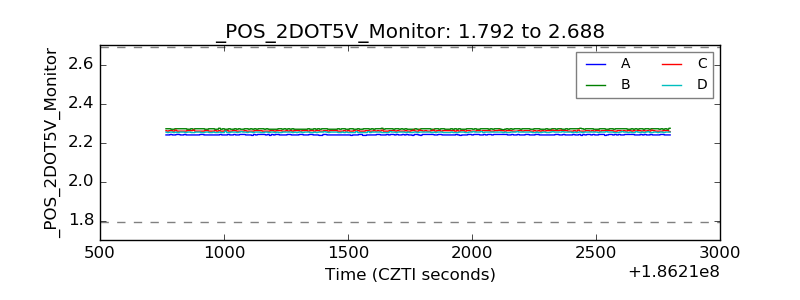 |
| +5 Volts monitor |  |
| _ROLL_ROT | 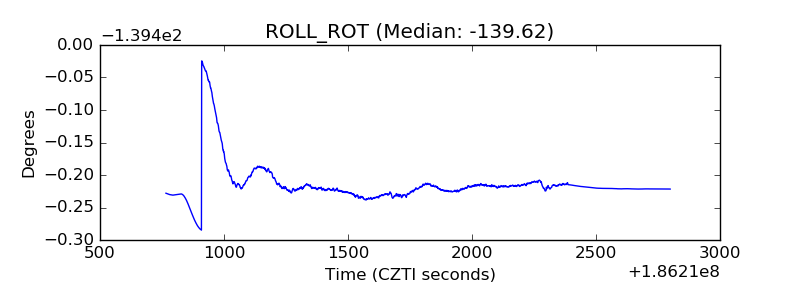 |
| _Roll_DEC | 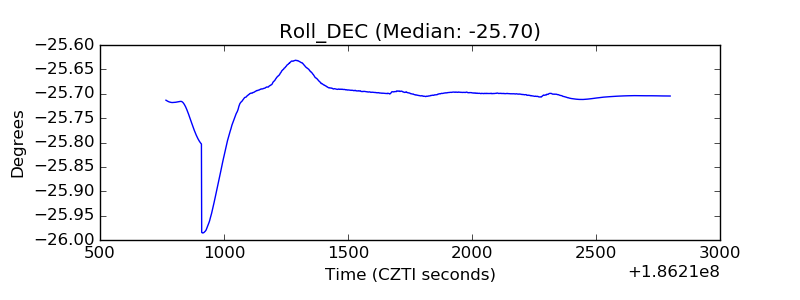 |
| _Roll_RA | 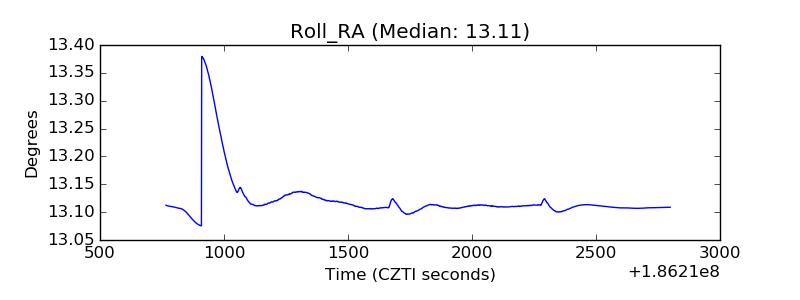 |
| Veto Counter | 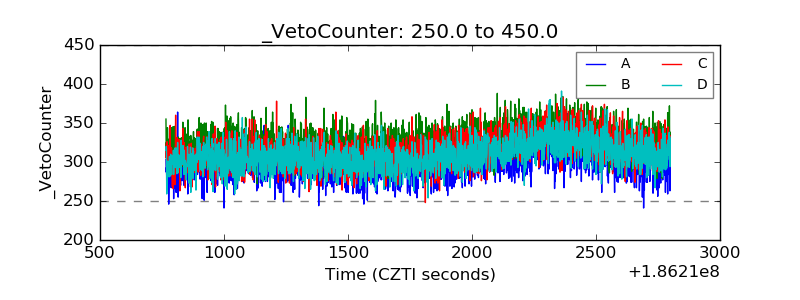 |