| Param | Original file | Final file |
|---|---|---|
| Filename | modeM0/AS1P01_889T01_9000000134cztM0_level2.fits | modeM0/AS1P01_889T01_9000000134cztM0_level2_quad_clean.evt |
| Size (bytes) | 16,441,920 | 12,052,800 |
| Size | 15.7 MB | 11.5 MB |
| Events in quadrant A | 91,210 | 56,033 |
| Events in quadrant B | 90,766 | 55,813 |
| Events in quadrant C | 89,770 | 53,967 |
| Events in quadrant D | 78,146 | 49,975 |
| Mode M0 | |||
|---|---|---|---|
| Quadrant | BADHDUFLAG | Total packets | Discarded packets |
| A | 0 | 8052 | 0 |
| B | 0 | 9424 | 0 |
| C | 0 | 7698 | 0 |
| D | 0 | 7390 | 0 |
| Mode SS | |||
|---|---|---|---|
| Quadrant | BADHDUFLAG | Total packets | Discarded packets |
| A | 0 | 40 | 0 |
| B | 0 | 40 | 0 |
| C | 0 | 40 | 0 |
| D | 0 | 40 | 0 |
| Quadrant | Total seconds | Saturated seconds | Saturation percentage |
|---|---|---|---|
| A | 2042 | 0 | 0.000000% |
| B | 2042 | 33 | 1.616063% |
| C | 2042 | 0 | 0.000000% |
| D | 2042 | 0 | 0.000000% |
Noise dominated data is calculated using 1-second bins in cleaned event files. If a bin has >2000 counts, and if more than 50% of those come from <1% of pixels, then it is considered to be noise-dominated and hence unusable.
| Quadrant | # 1 sec bins | Bins with >0 counts | Bins with >2000 counts | High rate bins dominated by noise | Noise dominated (total time) | Noise dominated (detector-on time) | Marked lightcurve |
|---|---|---|---|---|---|---|---|
| A | 2042 | 2042 | 0 | 0 | 0.00% | 0.00% |  |
| B | 2041 | 2041 | 0 | 0 | 0.00% | 0.00% |  |
| C | 2041 | 2041 | 0 | 0 | 0.00% | 0.00% |  |
| D | 2042 | 2042 | 0 | 0 | 0.00% | 0.00% |  |
Top three noisy pixels from each quadrant. If the there are fewer than three noisy pixels in the level2.evt file, extra rows are filled as -1
| Pixel properties | Quadrant properties | ||||||
|---|---|---|---|---|---|---|---|
| Quadrant | DetID | PixID | Counts | Sigma | Mean | Median | Sigma |
| A | 7 | 110 | 89 | 8.88 | 23 | 22 | 7.5 |
| A | 0 | 29 | 79 | 7.55 | 23 | 22 | 7.5 |
| A | 10 | 68 | 66 | 5.83 | 23 | 22 | 7.5 |
| B | 2 | 9 | 72 | 7.35 | 24 | 23 | 6.7 |
| B | 5 | 128 | 67 | 6.6 | 24 | 23 | 6.7 |
| B | 8 | 17 | 64 | 6.15 | 24 | 23 | 6.7 |
| C | 1 | 16 | 64 | 5.5 | 23 | 22 | 7.6 |
| C | 2 | 127 | 61 | 5.11 | 23 | 22 | 7.6 |
| C | -1 | -1 | -1 | -1.0 | 23 | 22 | 7.6 |
| D | 3 | 1 | 65 | 6.33 | 22 | 20 | 7.1 |
| D | 4 | 160 | 63 | 6.05 | 22 | 20 | 7.1 |
| D | 1 | 3 | 62 | 5.91 | 22 | 20 | 7.1 |
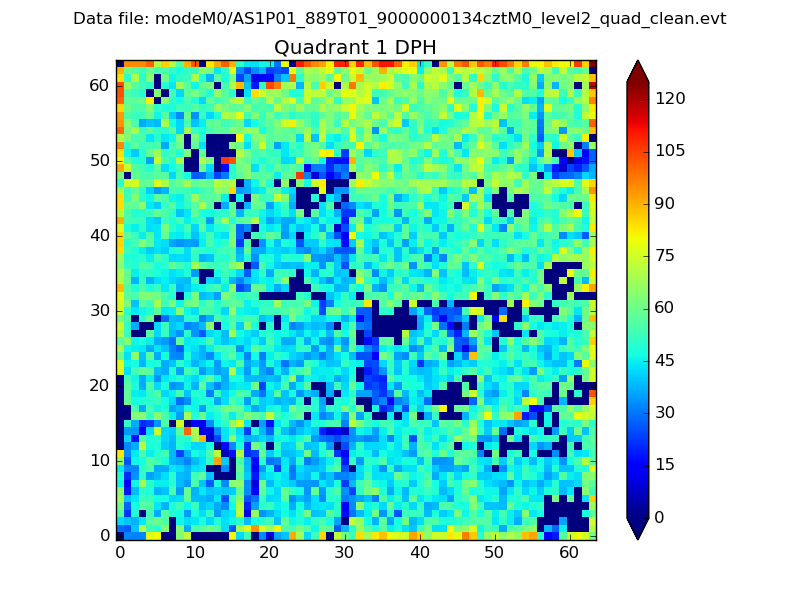
Histogram calculated using DETX and DETY for each event in the final _common_clean file
| Quadrant A |  |
 |
Quadrant B |
|---|---|---|---|
| Quadrant D |  |
 |
Quadrant C |
| Plot type | Count rate plots | Images |
|---|---|---|
| Comparison with Poisson distribution Blue bars denote a histogram of data divided into 1 sec bins. Red curve is a Poisson curve with rate = median count rate of data. |
 |
 |
| Quadrant-wise count rates Data is divided into 100 sec bins |
 |
|
| Module-wise count rates for Quadrant A Data is divided into 100 sec bins |
 |
 |
| Module-wise count rates for Quadrant B Data is divided into 100 sec bins |
 |
 |
| Module-wise count rates for Quadrant C Data is divided into 100 sec bins |
 |
 |
| Module-wise count rates for Quadrant D Data is divided into 100 sec bins |
 |
 |
| Parameter | Plot |
|---|---|
| CZT HV Monitor |  |
| D_VDD |  |
| Temperature 1 |  |
| Veto HV Monitor |  |
| Veto LLD |  |
| Alpha Counter |  |
| _CPM_Rate | 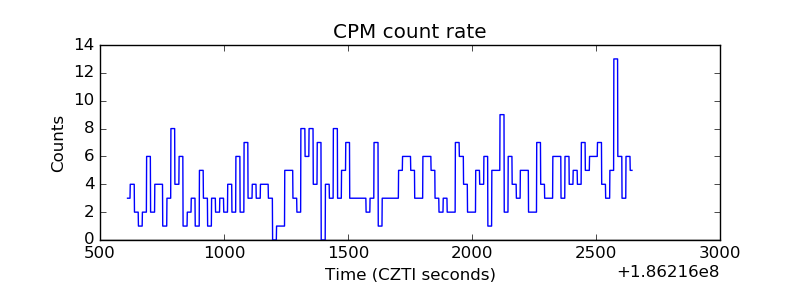 |
| CZT Counter |  |
| +2.5 Volts monitor |  |
| +5 Volts monitor |  |
| _ROLL_ROT |  |
| _Roll_DEC |  |
| _Roll_RA |  |
| Veto Counter |  |