| Param | Original file | Final file |
|---|---|---|
| Filename | modeM0/AS1P01_889T01_9000000134_00876cztM0_level2.evt | modeM0/AS1P01_889T01_9000000134_00876cztM0_level2_quad_clean.evt |
| Size (bytes) | 302,091,840 | 30,608,640 |
| Size | 288.1 MB | 29.2 MB |
| Events in quadrant A | 2,223,533 | 197,275 |
| Events in quadrant B | 2,678,948 | 193,731 |
| Events in quadrant C | 2,109,756 | 194,853 |
| Events in quadrant D | 1,998,268 | 192,499 |
| Mode M0 | |||
|---|---|---|---|
| Quadrant | BADHDUFLAG | Total packets | Discarded packets |
| A | 0 | 8052 | 0 |
| B | 0 | 9424 | 0 |
| C | 0 | 7698 | 0 |
| D | 0 | 7390 | 0 |
| Mode SS | |||
|---|---|---|---|
| Quadrant | BADHDUFLAG | Total packets | Discarded packets |
| A | 0 | 40 | 0 |
| B | 0 | 40 | 0 |
| C | 0 | 40 | 0 |
| D | 0 | 40 | 0 |
| Quadrant | Total seconds | Saturated seconds | Saturation percentage |
|---|---|---|---|
| A | 2042 | 0 | 0.000000% |
| B | 2042 | 33 | 1.616063% |
| C | 2042 | 0 | 0.000000% |
| D | 2042 | 0 | 0.000000% |
Noise dominated data is calculated using 1-second bins in cleaned event files. If a bin has >2000 counts, and if more than 50% of those come from <1% of pixels, then it is considered to be noise-dominated and hence unusable.
| Quadrant | # 1 sec bins | Bins with >0 counts | Bins with >2000 counts | High rate bins dominated by noise | Noise dominated (total time) | Noise dominated (detector-on time) | Marked lightcurve |
|---|---|---|---|---|---|---|---|
| A | 2042 | 2042 | 3 | 3 | 0.15% | 0.15% | 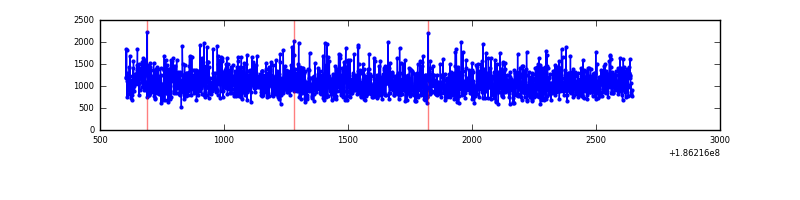 |
| B | 2041 | 2041 | 168 | 168 | 8.23% | 8.23% | 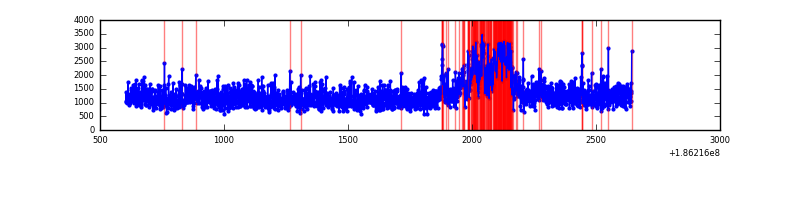 |
| C | 2042 | 2042 | 14 | 14 | 0.69% | 0.69% | 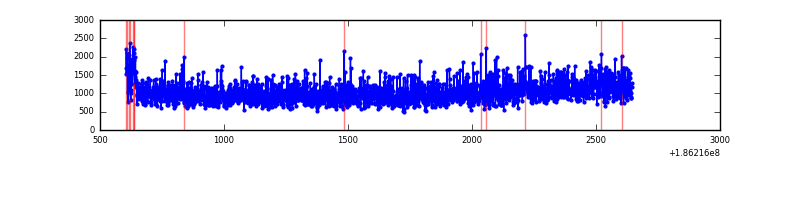 |
| D | 2042 | 2042 | 7 | 7 | 0.34% | 0.34% |  |
Top three noisy pixels from each quadrant. If the there are fewer than three noisy pixels in the level2.evt file, extra rows are filled as -1
| Pixel properties | Quadrant properties | ||||||
|---|---|---|---|---|---|---|---|
| Quadrant | DetID | PixID | Counts | Sigma | Mean | Median | Sigma |
| A | 11 | 79 | 2219 | 11.61 | 579 | 586 | 140.7 |
| A | 3 | 111 | 1626 | 7.39 | 579 | 586 | 140.7 |
| A | 10 | 133 | 1600 | 7.21 | 579 | 586 | 140.7 |
| B | 8 | 38 | 318437 | 2201.38 | 604 | 608 | 144.4 |
| B | 0 | 220 | 50818 | 347.77 | 604 | 608 | 144.4 |
| B | 7 | 221 | 3676 | 21.25 | 604 | 608 | 144.4 |
| C | 1 | 192 | 54466 | 367.4 | 520 | 535 | 146.8 |
| C | 3 | 111 | 9891 | 63.74 | 520 | 535 | 146.8 |
| C | 3 | 79 | 9748 | 62.76 | 520 | 535 | 146.8 |
| D | 1 | 4 | 61817 | 394.48 | 497 | 511 | 155.4 |
| D | 13 | 169 | 46802 | 297.86 | 497 | 511 | 155.4 |
| D | 13 | 170 | 6772 | 40.29 | 497 | 511 | 155.4 |
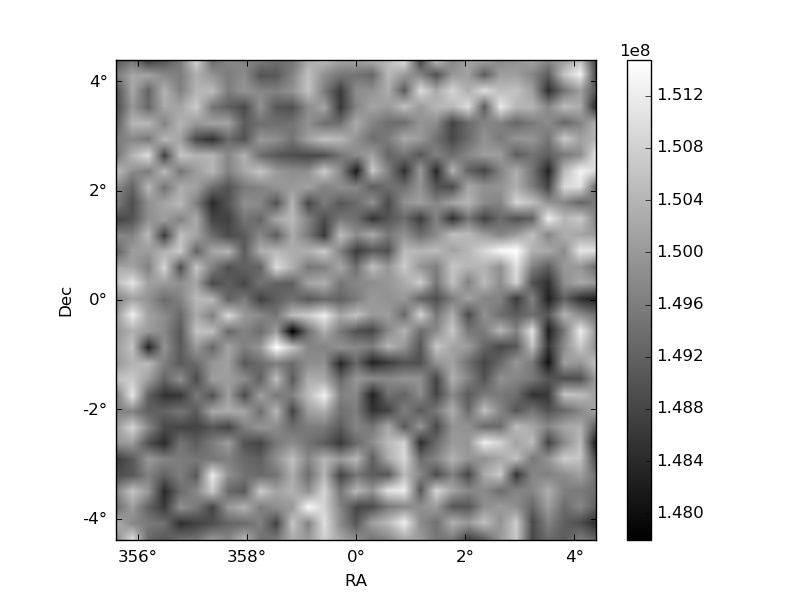
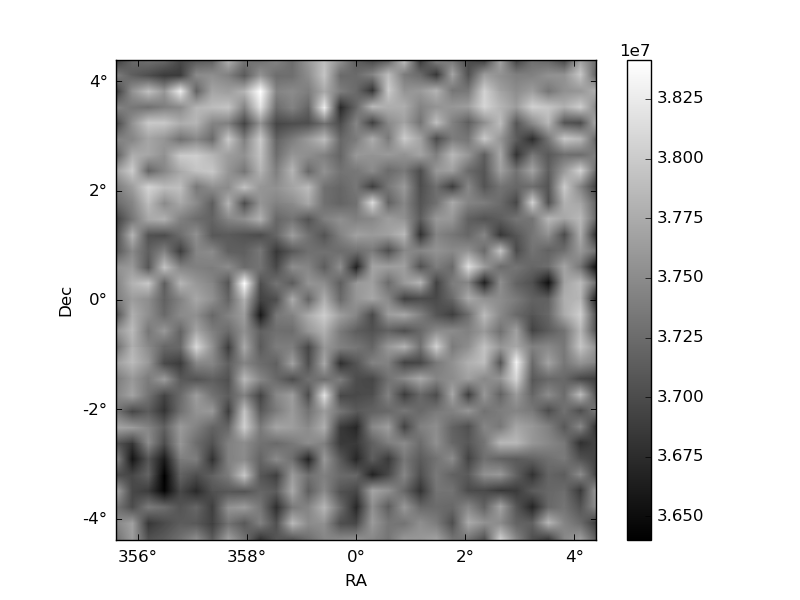
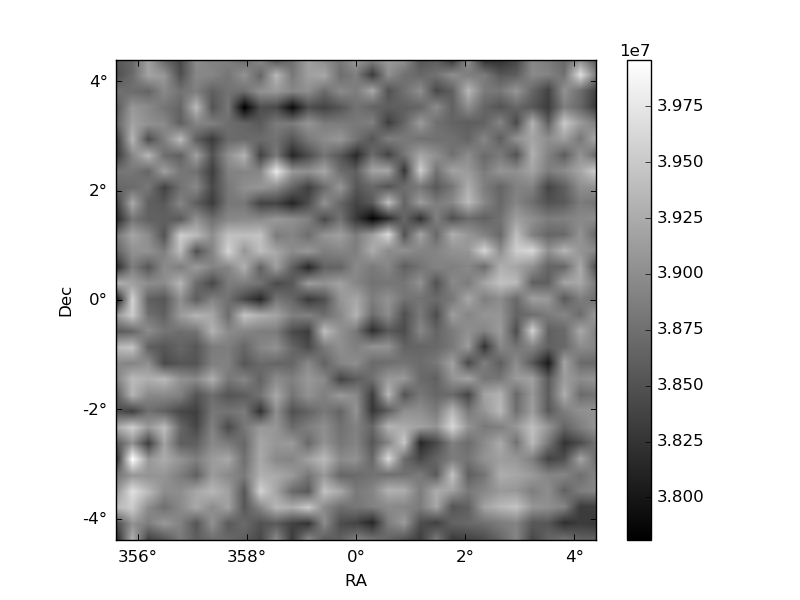
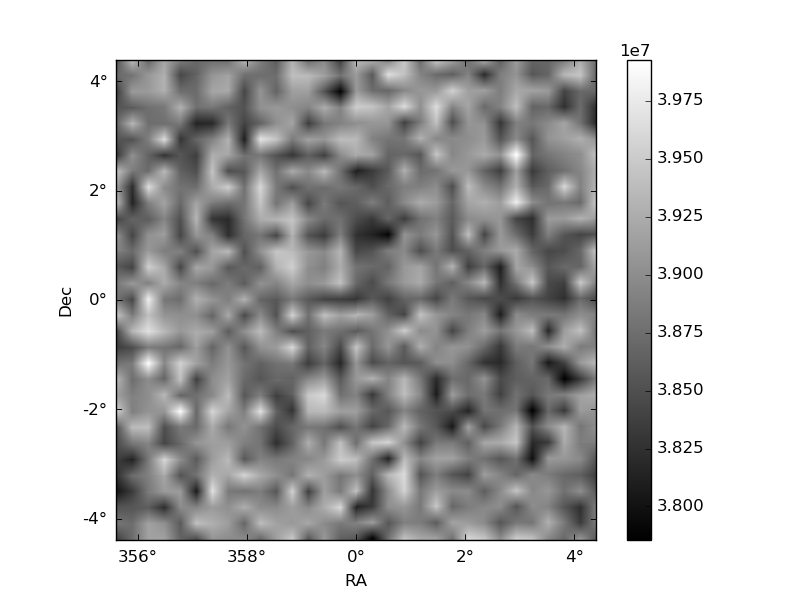
Histogram calculated using DETX and DETY for each event in the final _common_clean file
| Quadrant A |  |
 |
Quadrant B |
|---|---|---|---|
| Quadrant D |  |
 |
Quadrant C |
| Plot type | Count rate plots | Images |
|---|---|---|
| Comparison with Poisson distribution Blue bars denote a histogram of data divided into 1 sec bins. Red curve is a Poisson curve with rate = median count rate of data. |
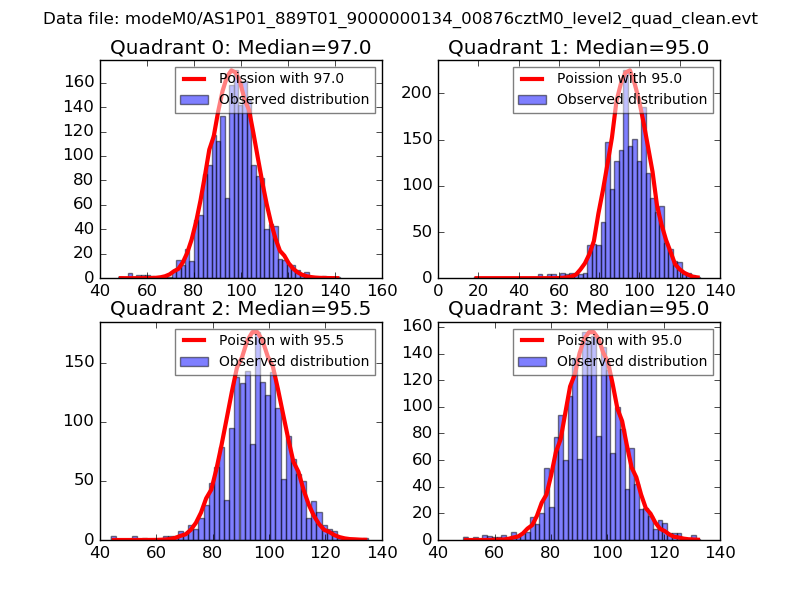 |
 |
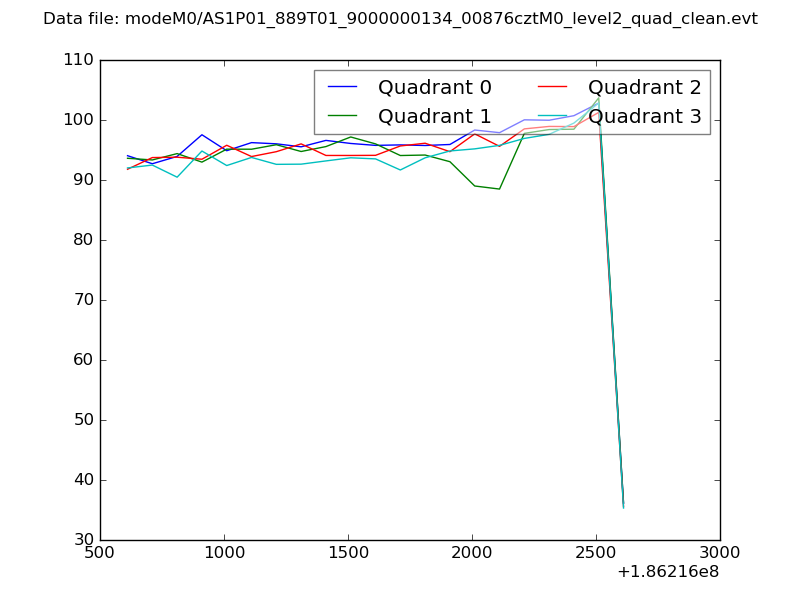
| Quadrant-wise count rates Data is divided into 100 sec bins |
 |
|
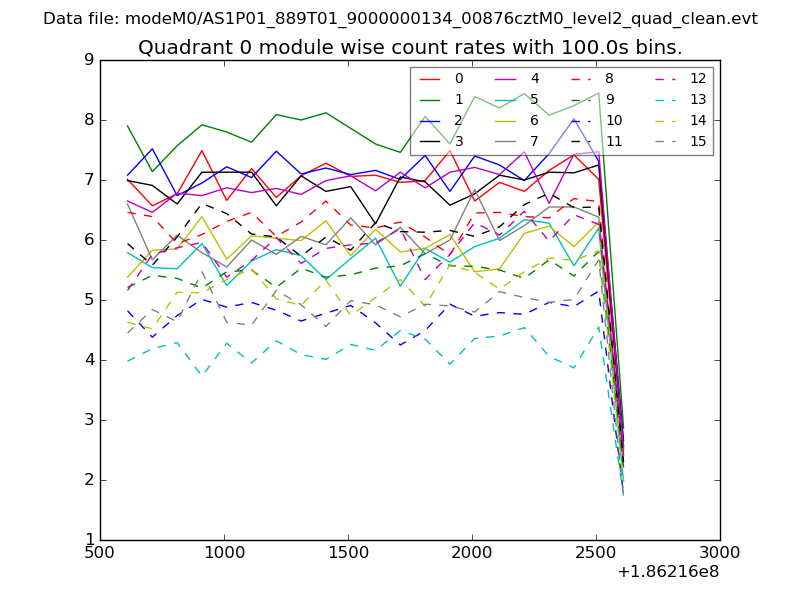
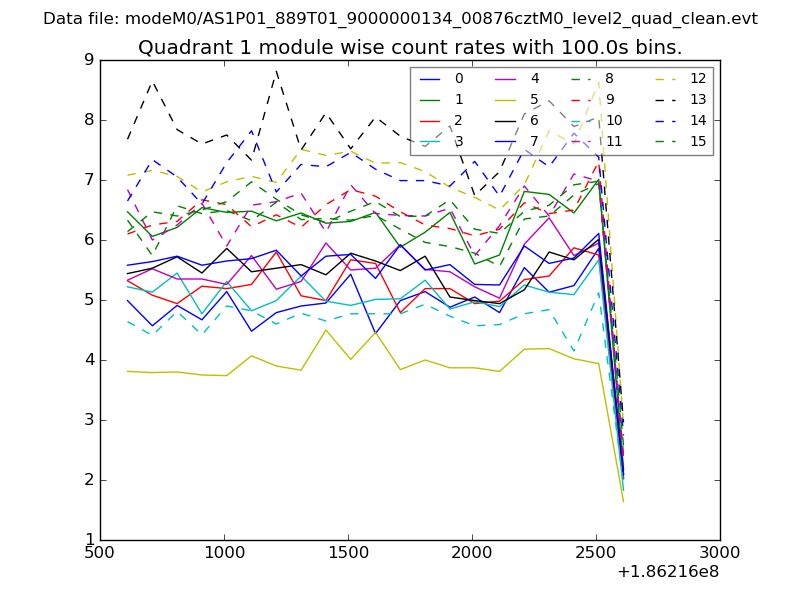
| Module-wise count rates for Quadrant A Data is divided into 100 sec bins |
 |
 |
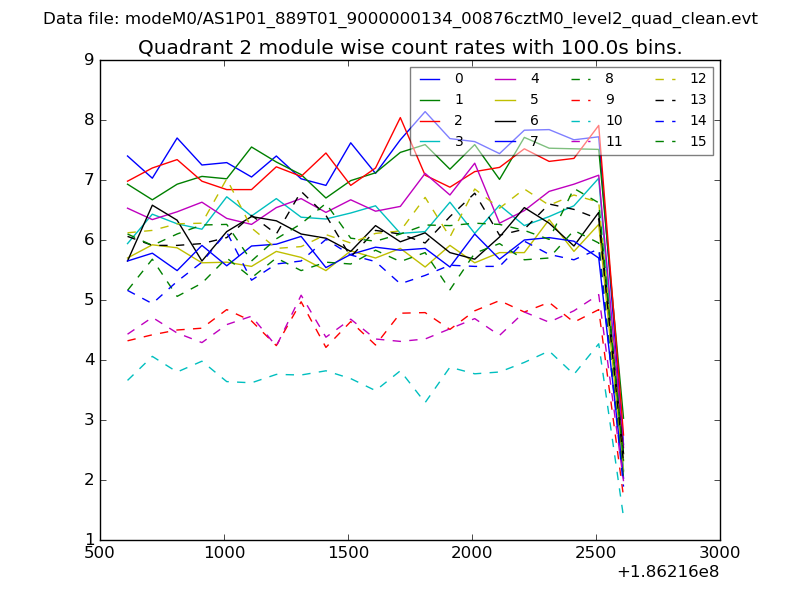
| Module-wise count rates for Quadrant B Data is divided into 100 sec bins |
 |
 |
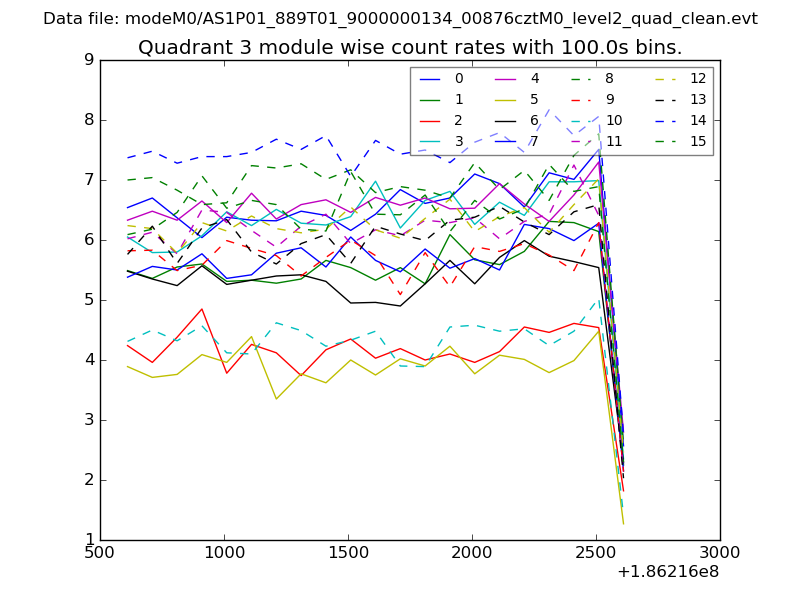
| Module-wise count rates for Quadrant C Data is divided into 100 sec bins |
 |
 |
| Module-wise count rates for Quadrant D Data is divided into 100 sec bins |
 |
 |
| Parameter | Plot |
|---|---|
| CZT HV Monitor | 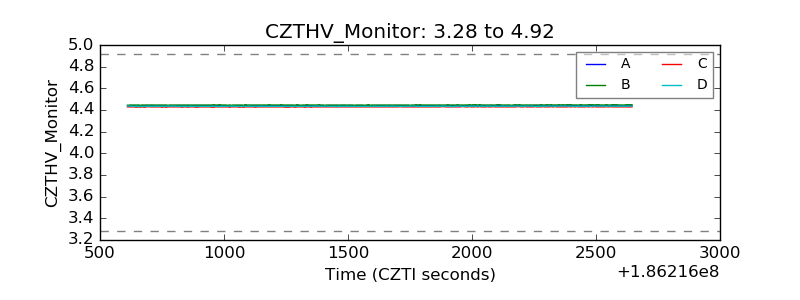 |
| D_VDD | 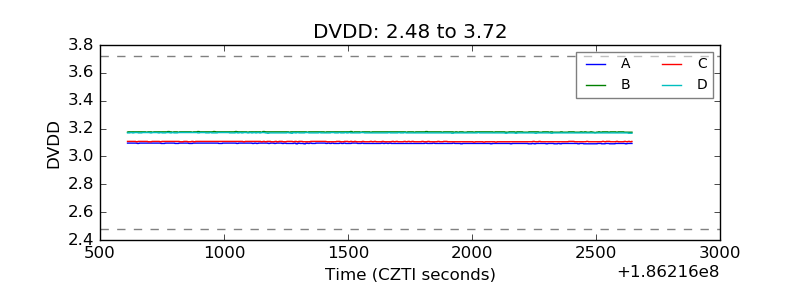 |
| Temperature 1 | 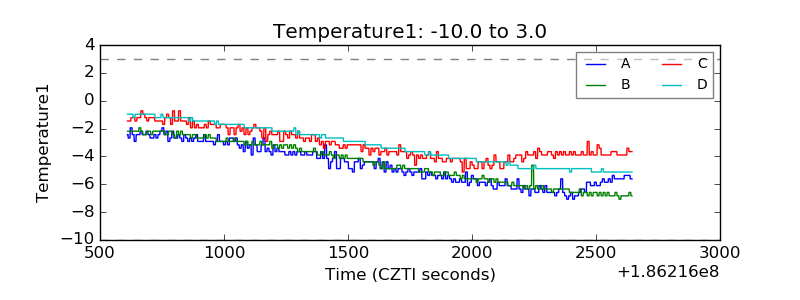 |
| Veto HV Monitor | 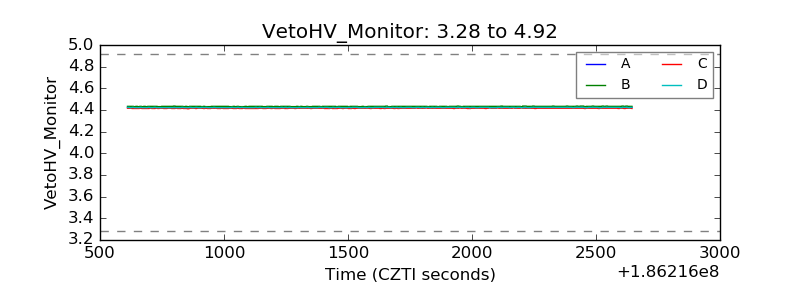 |
| Veto LLD | 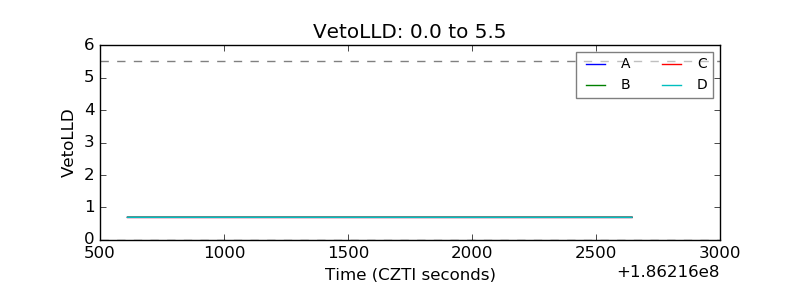 |
| Alpha Counter | 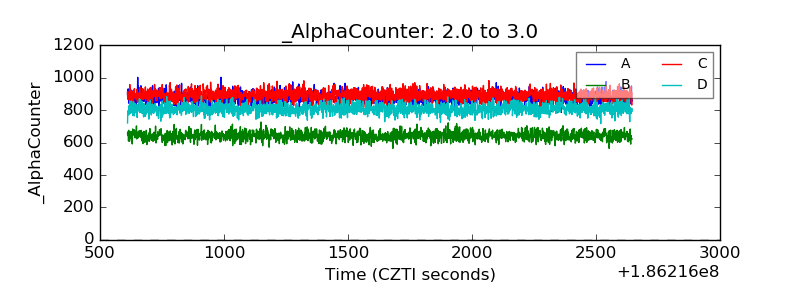 |
| _CPM_Rate | 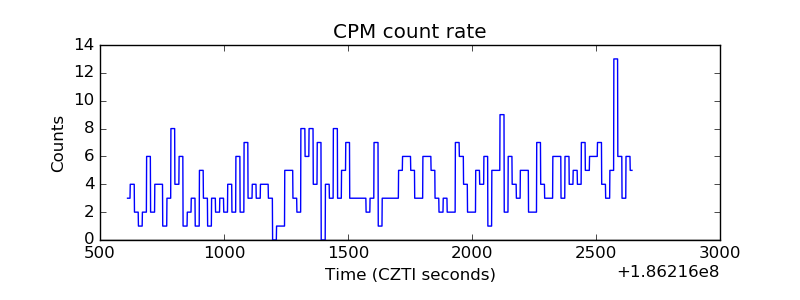 |
| CZT Counter | 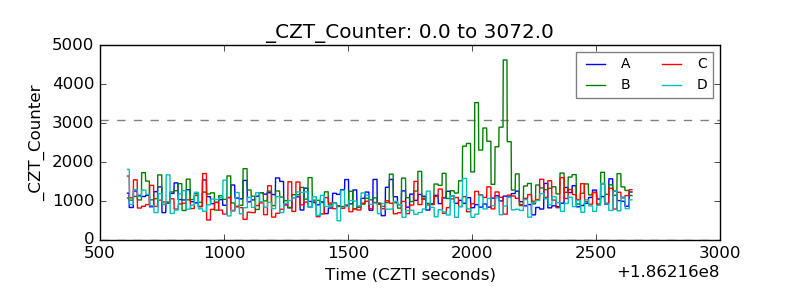 |
| +2.5 Volts monitor |  |
| +5 Volts monitor |  |
| _ROLL_ROT | 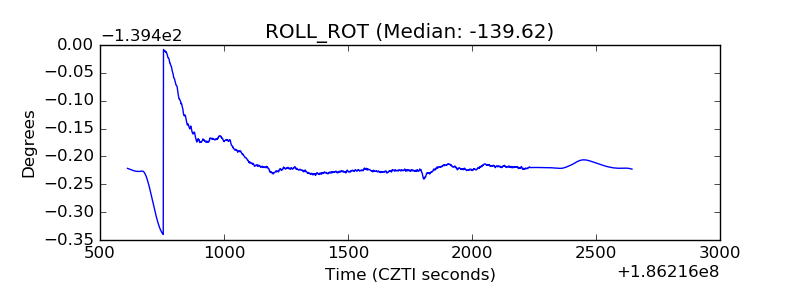 |
| _Roll_DEC | 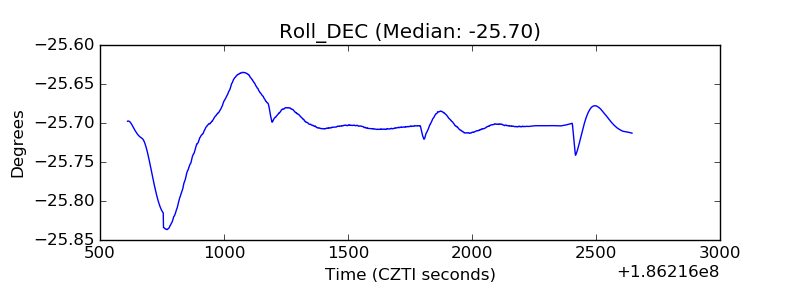 |
| _Roll_RA | 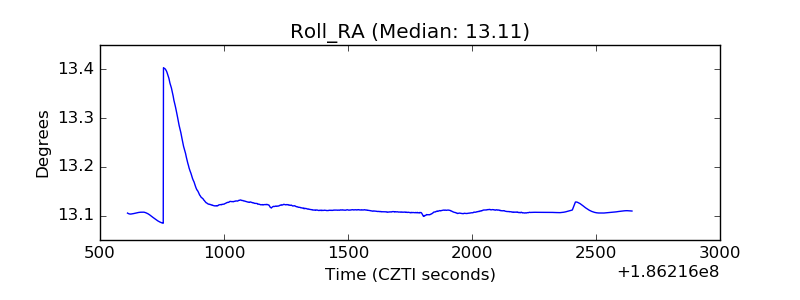 |
| Veto Counter | 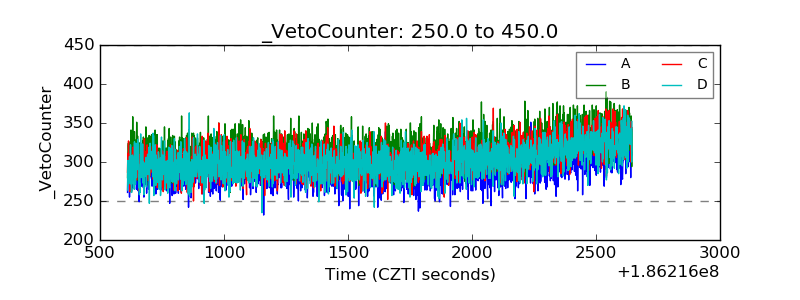 |